
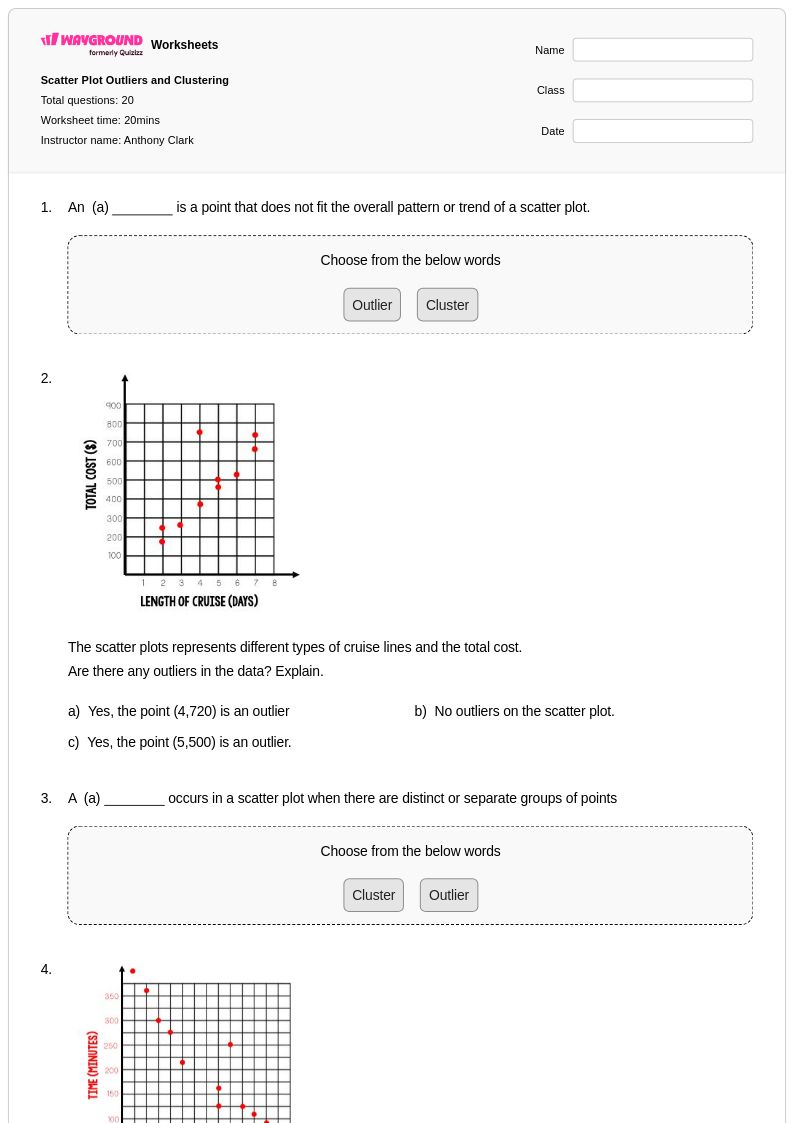
20 Q
8th - Uni
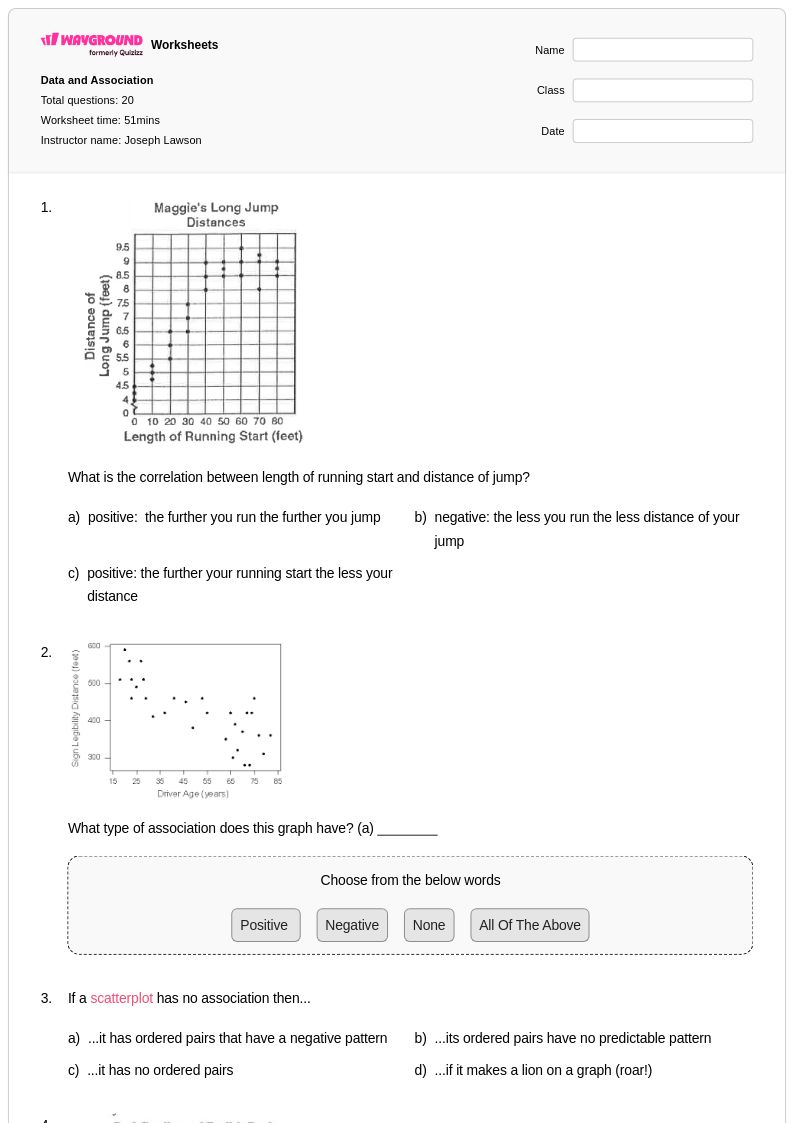
20 Q
8th
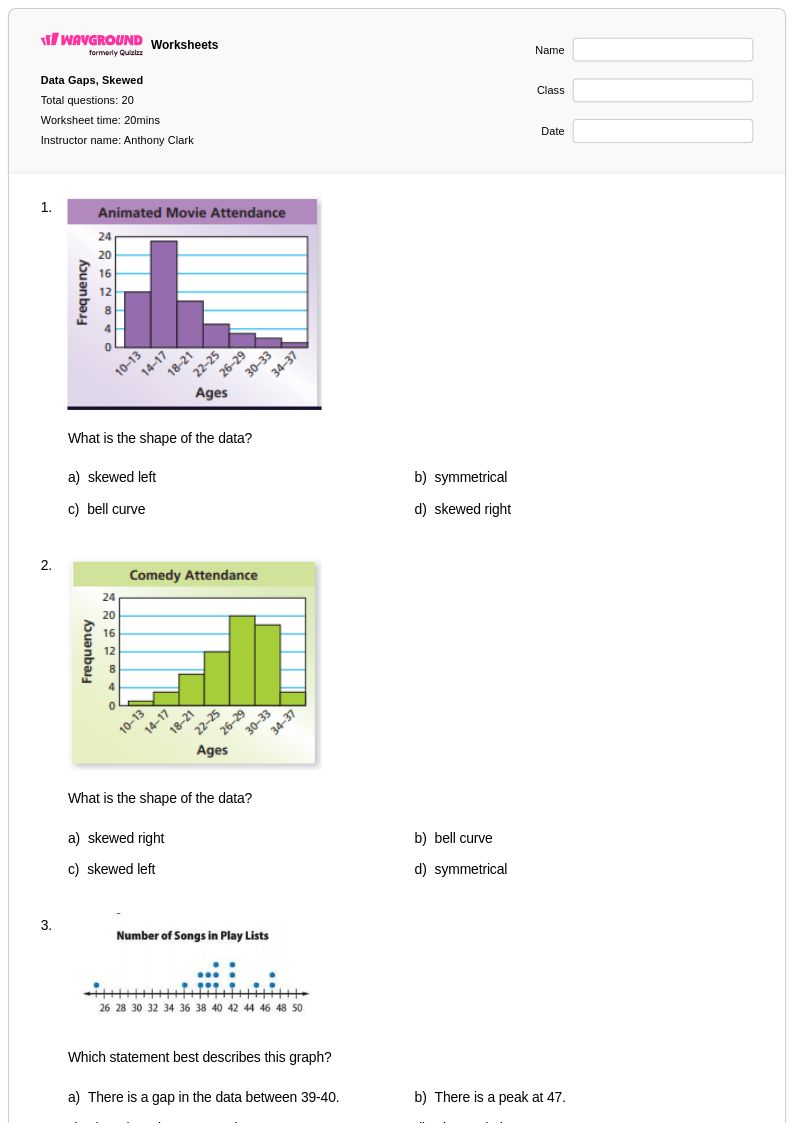
20 Q
6th - Uni
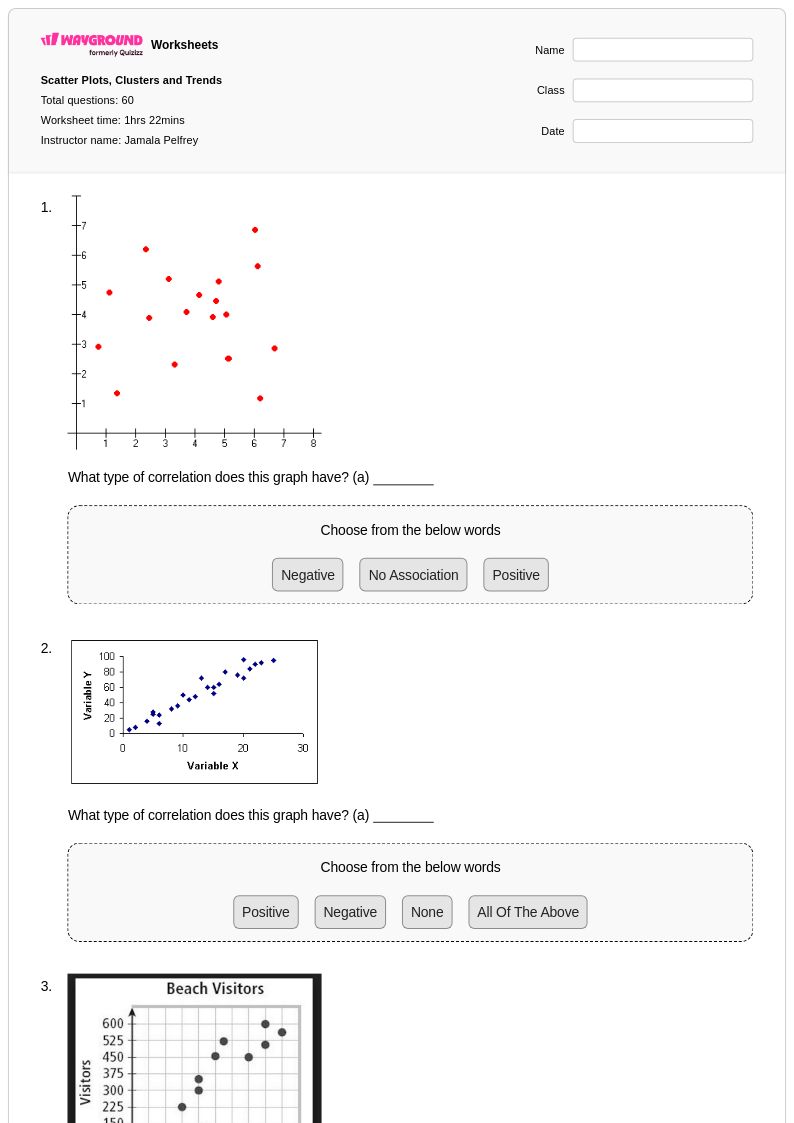
60 Q
8th - 9th
20 Q
6th - 8th
20 Q
8th - Uni
20 Q
8th - Uni
16 Q
8th
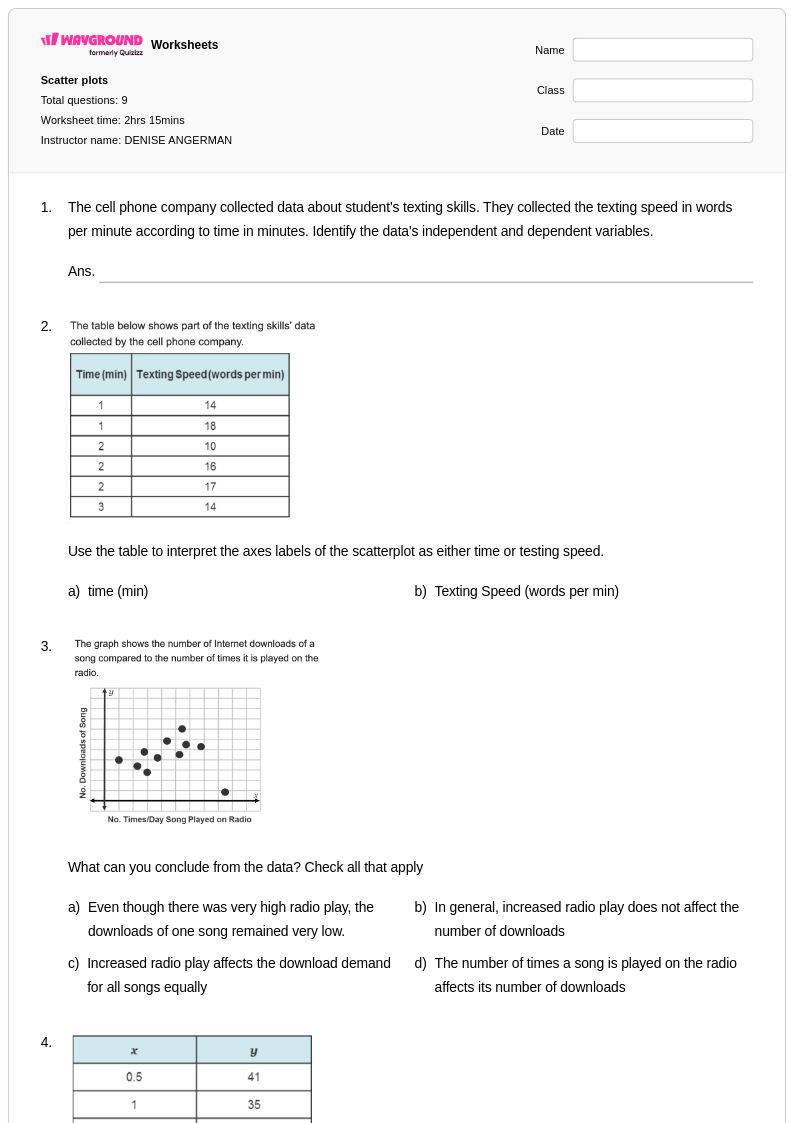
9 Q
8th
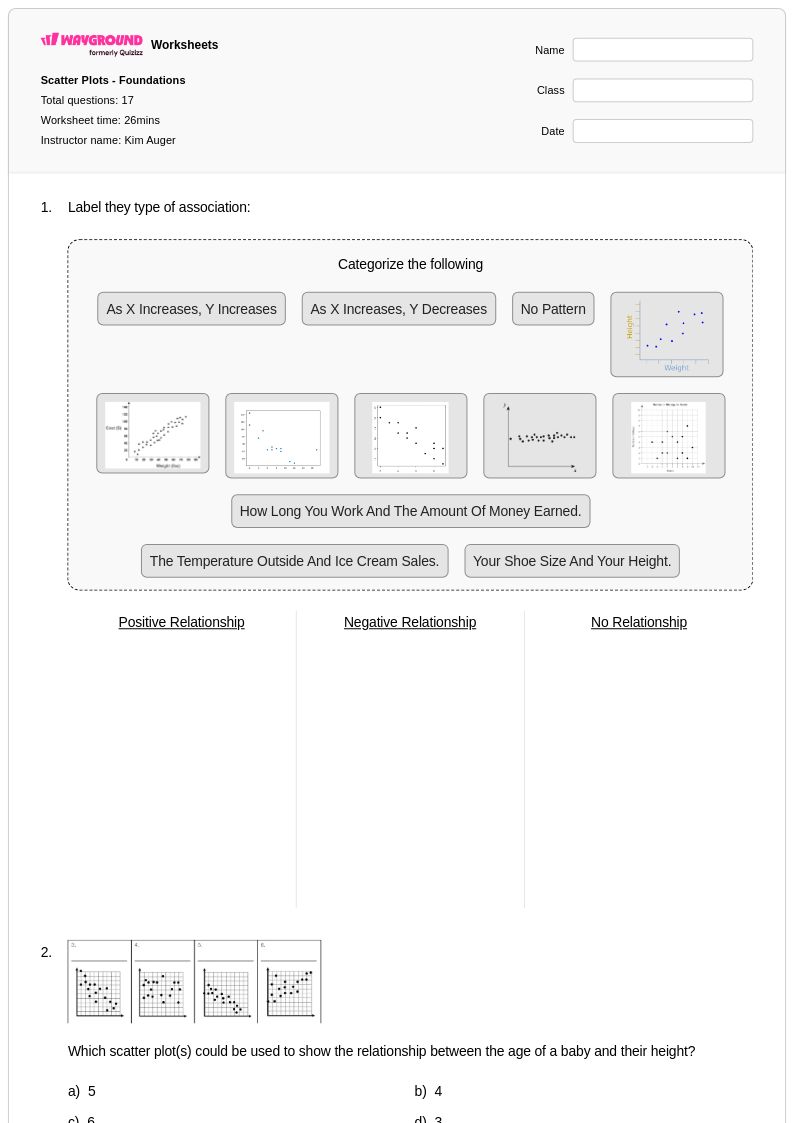
17 Q
8th
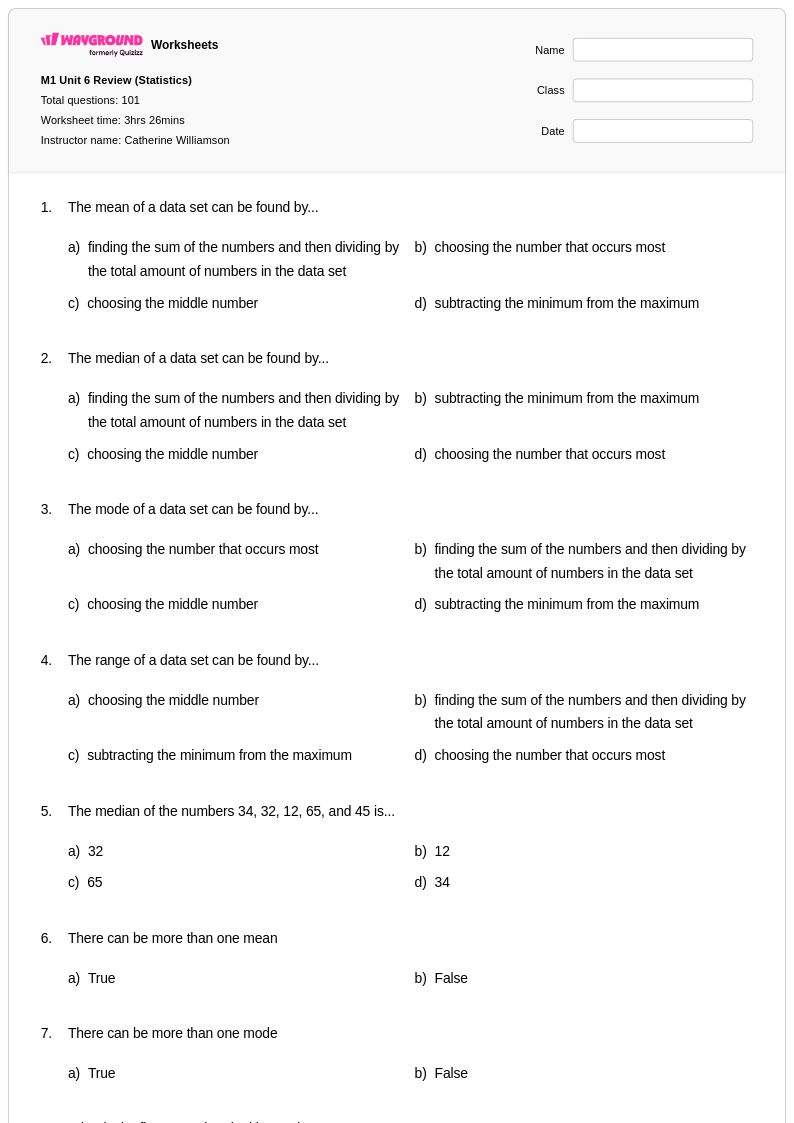
101 Q
8th
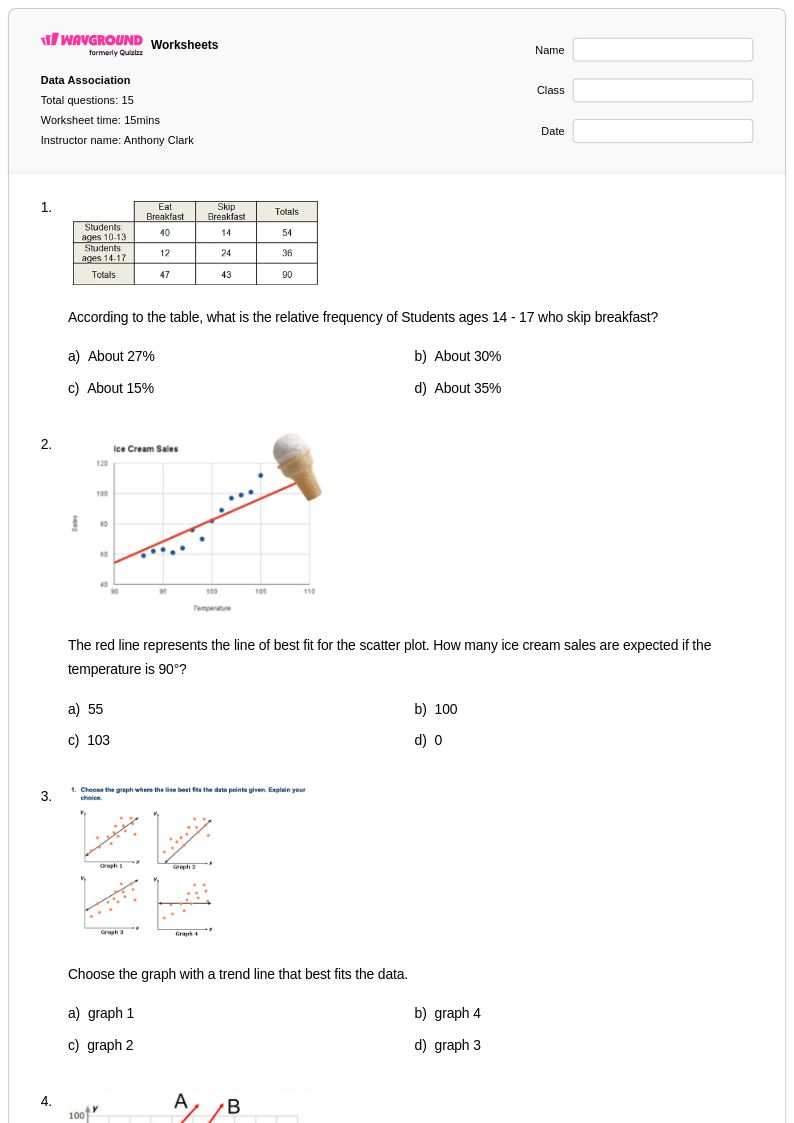
15 Q
8th - Uni
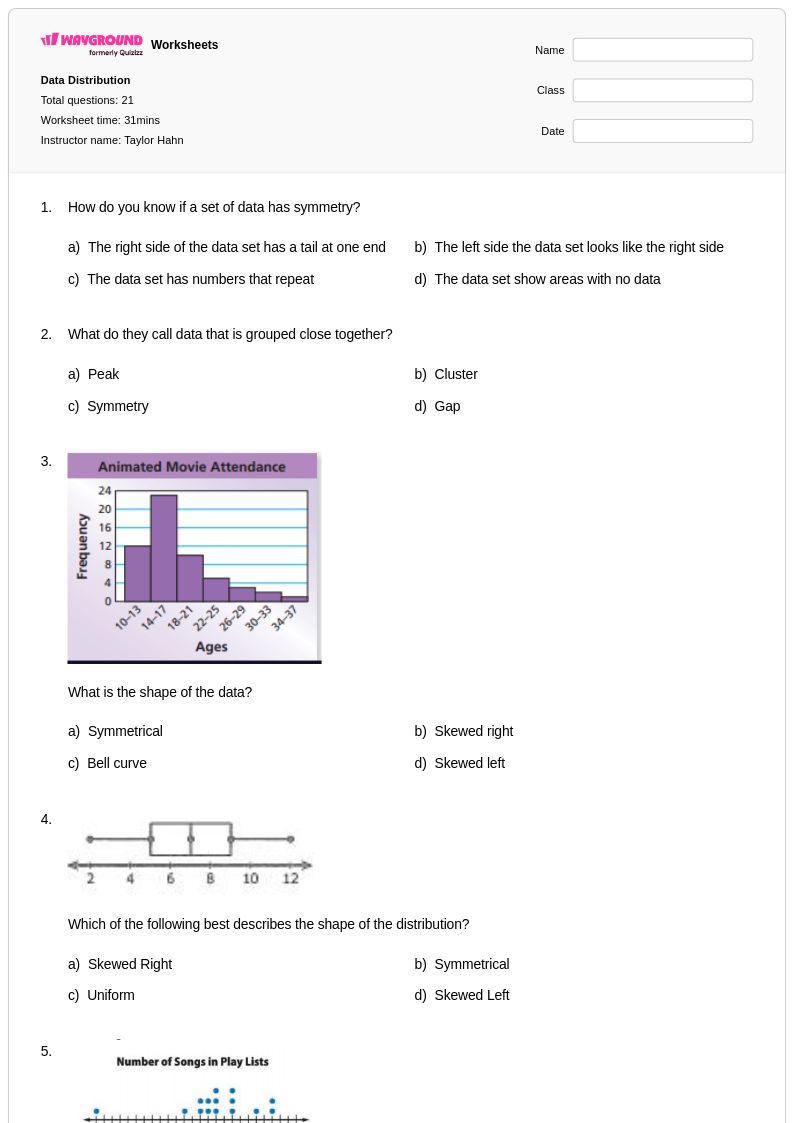
21 Q
8th
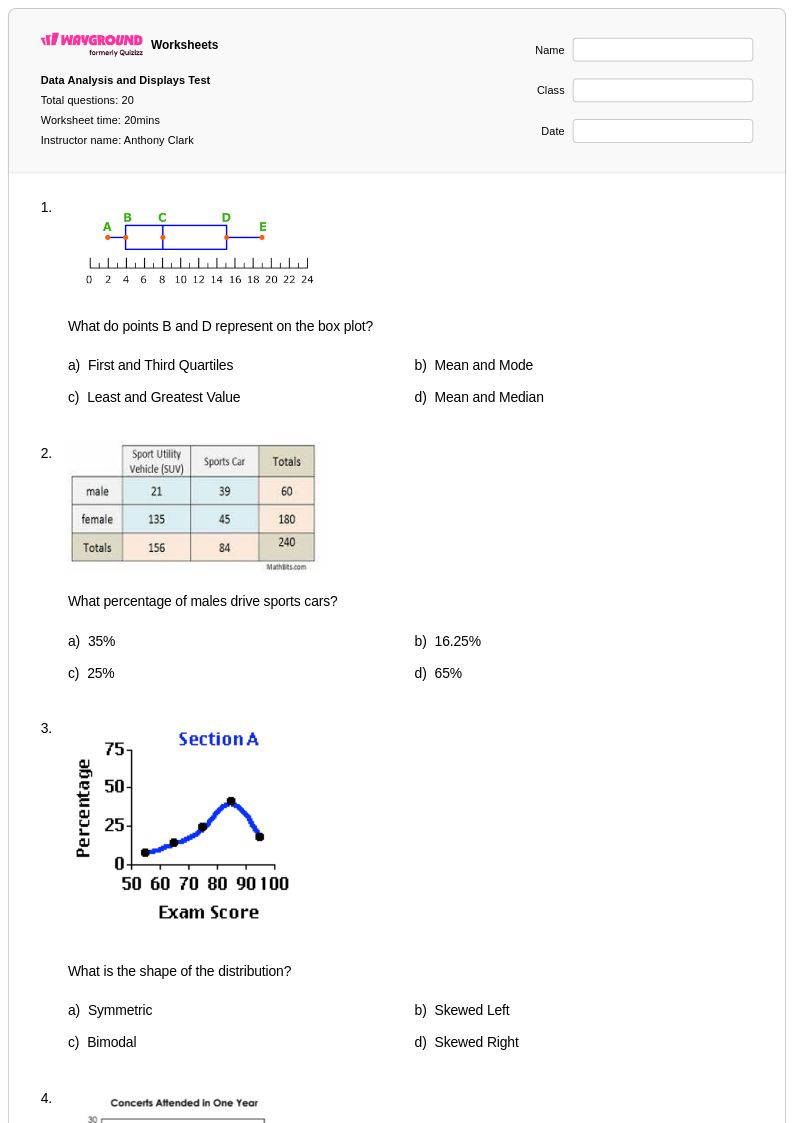
20 Q
7th - Uni
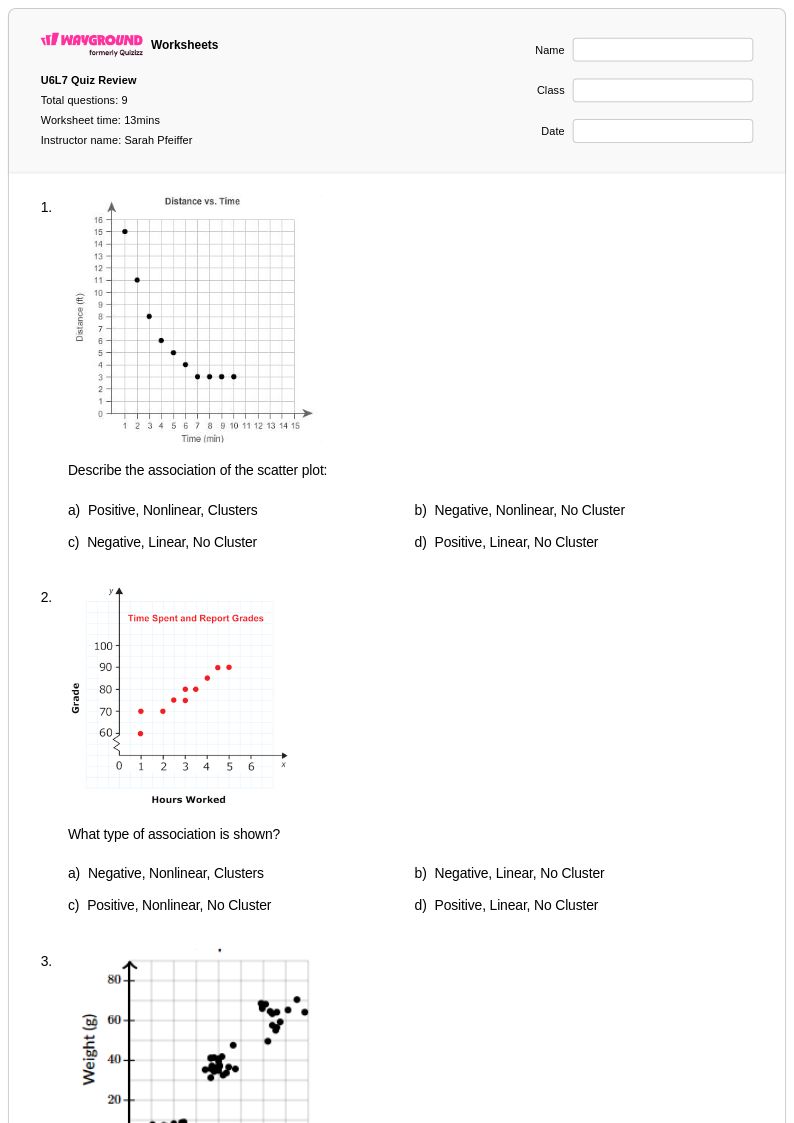
9 Q
8th
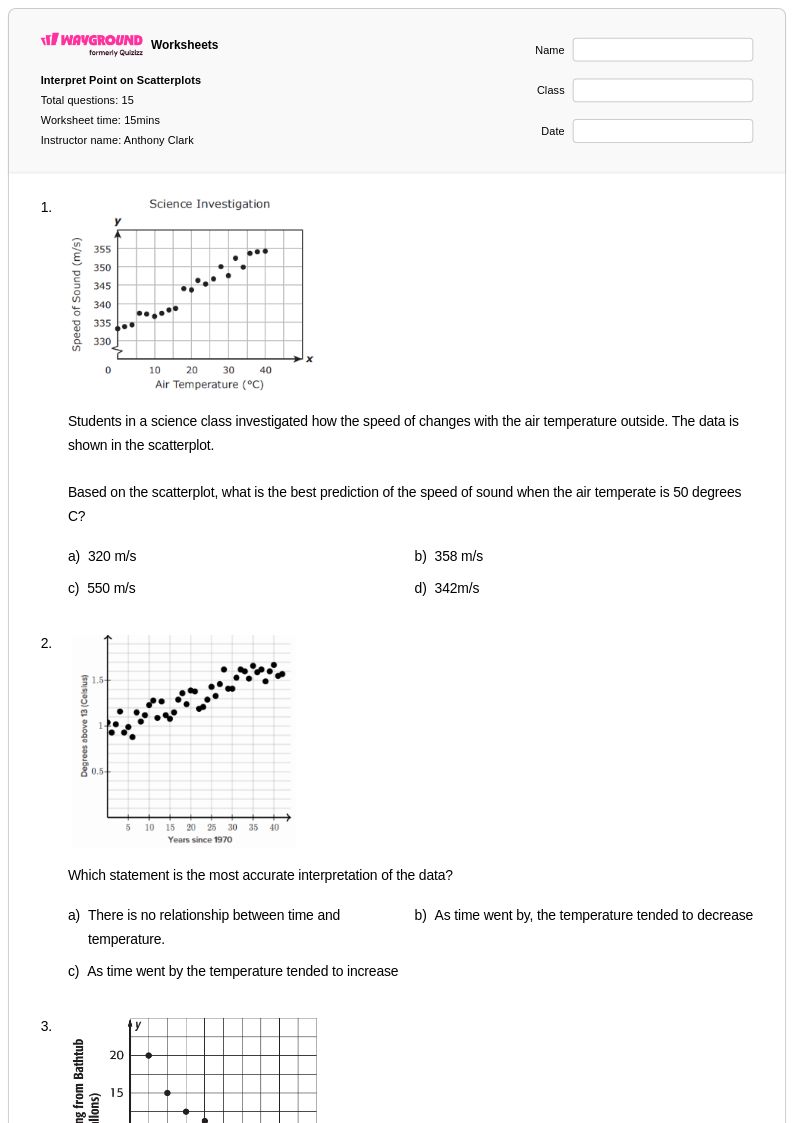
15 Q
8th - Uni
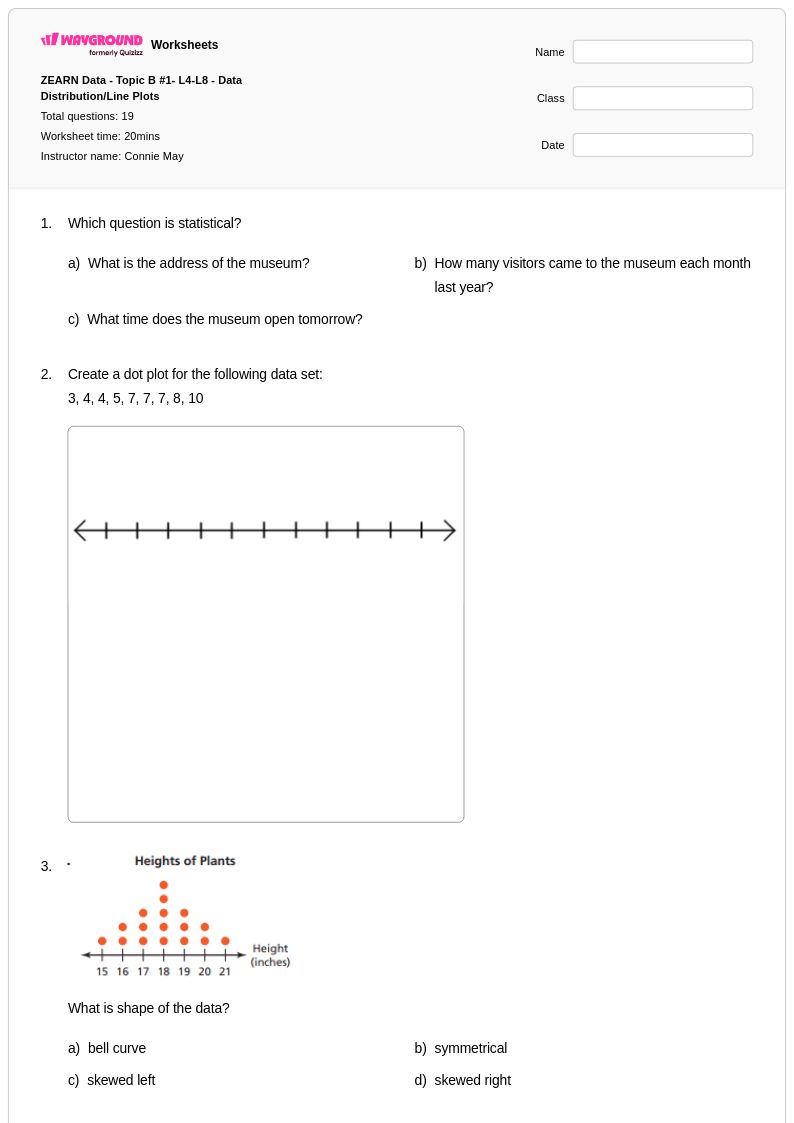
19 Q
6th - 8th
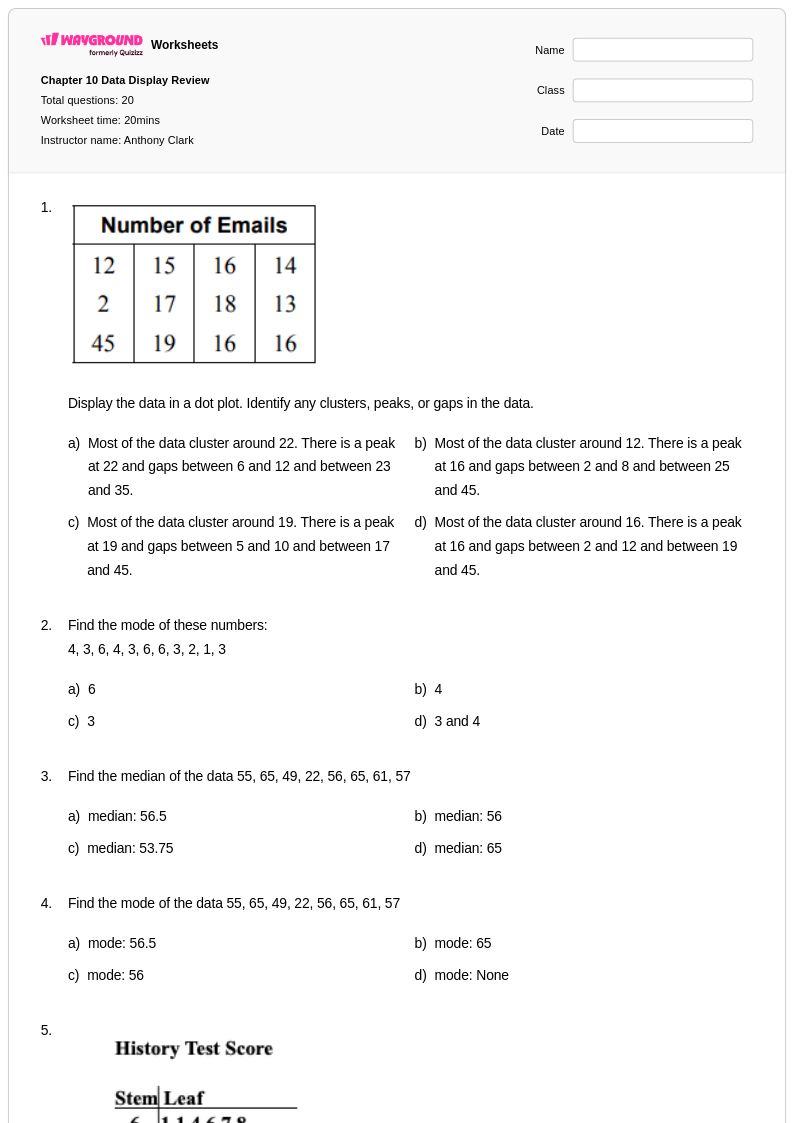
20 Q
6th - Uni
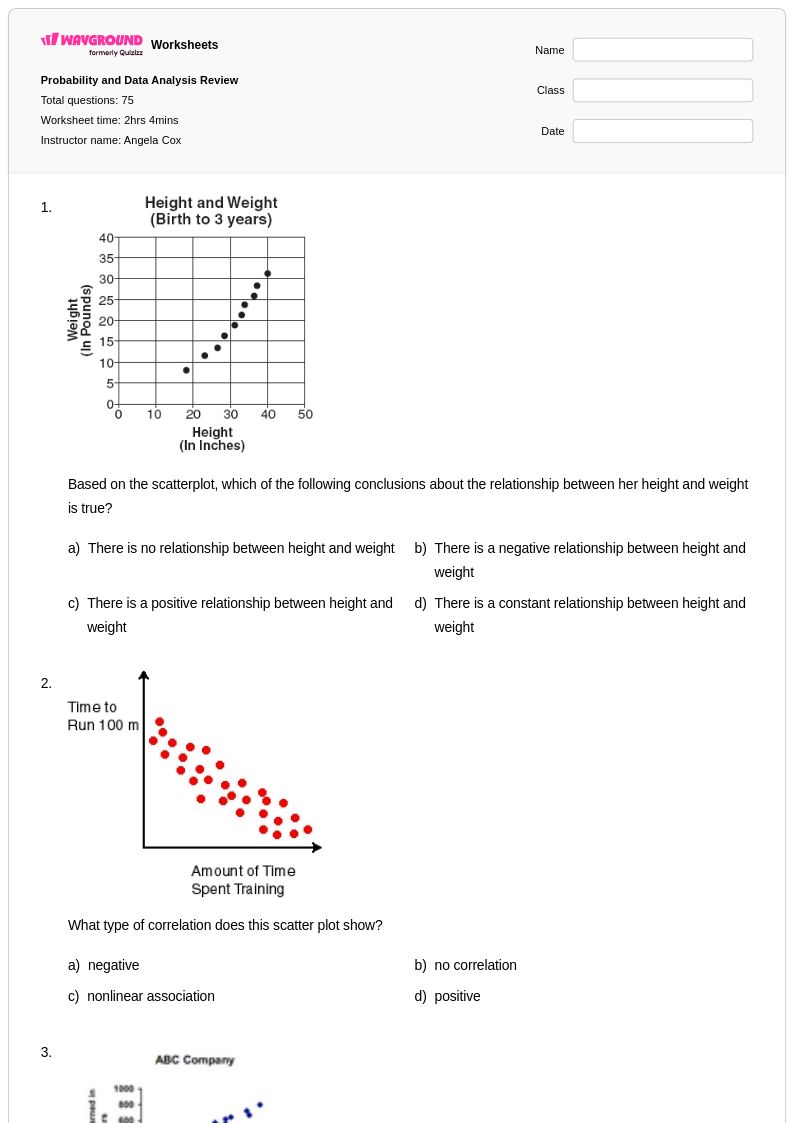
75 Q
8th
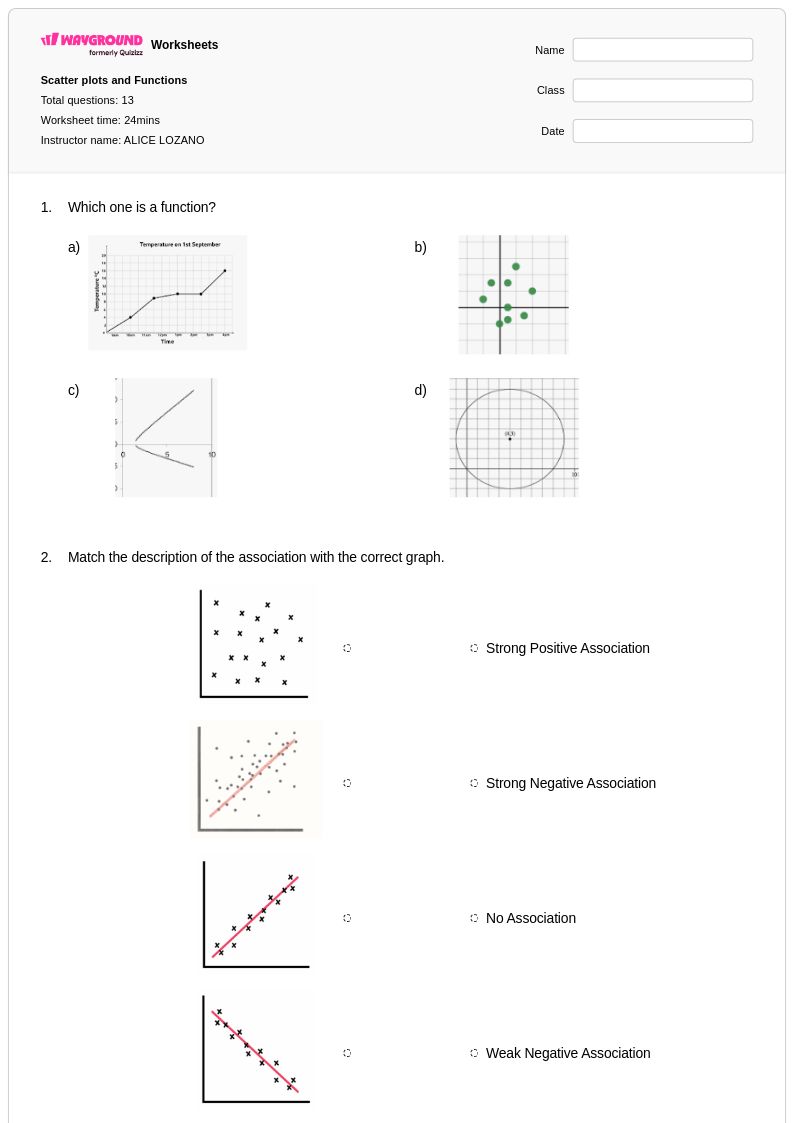
13 Q
8th
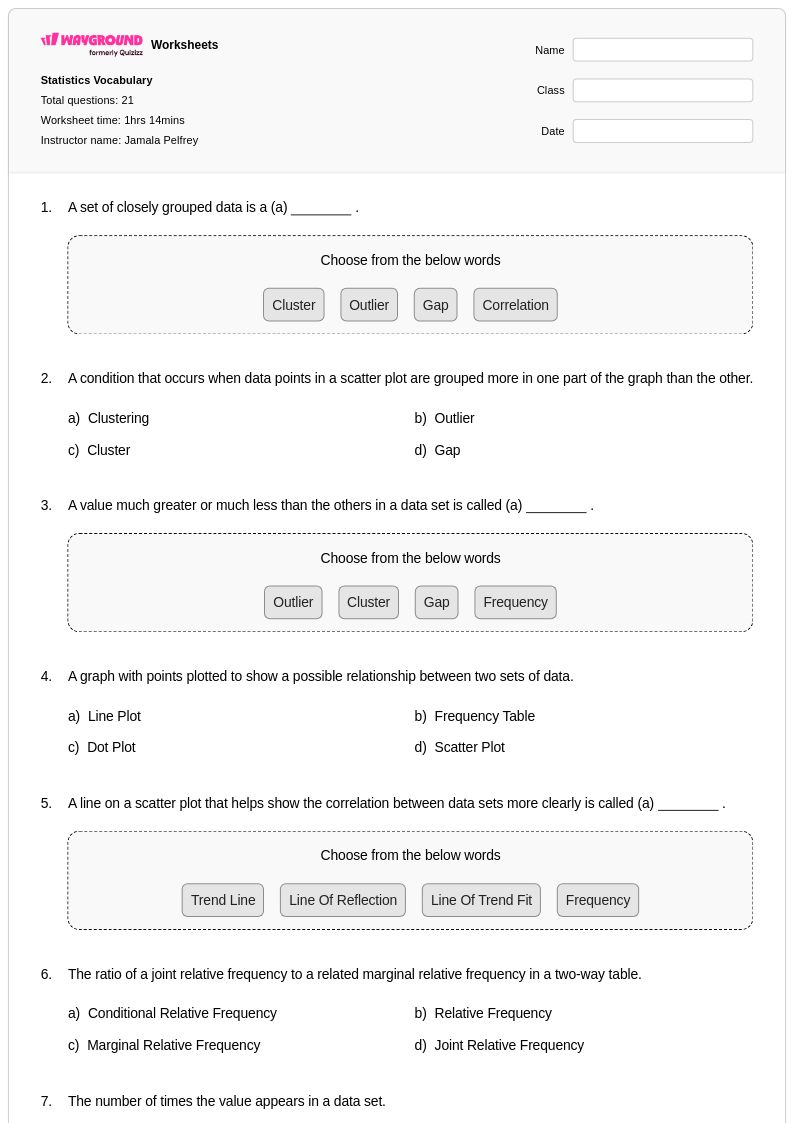
21 Q
8th
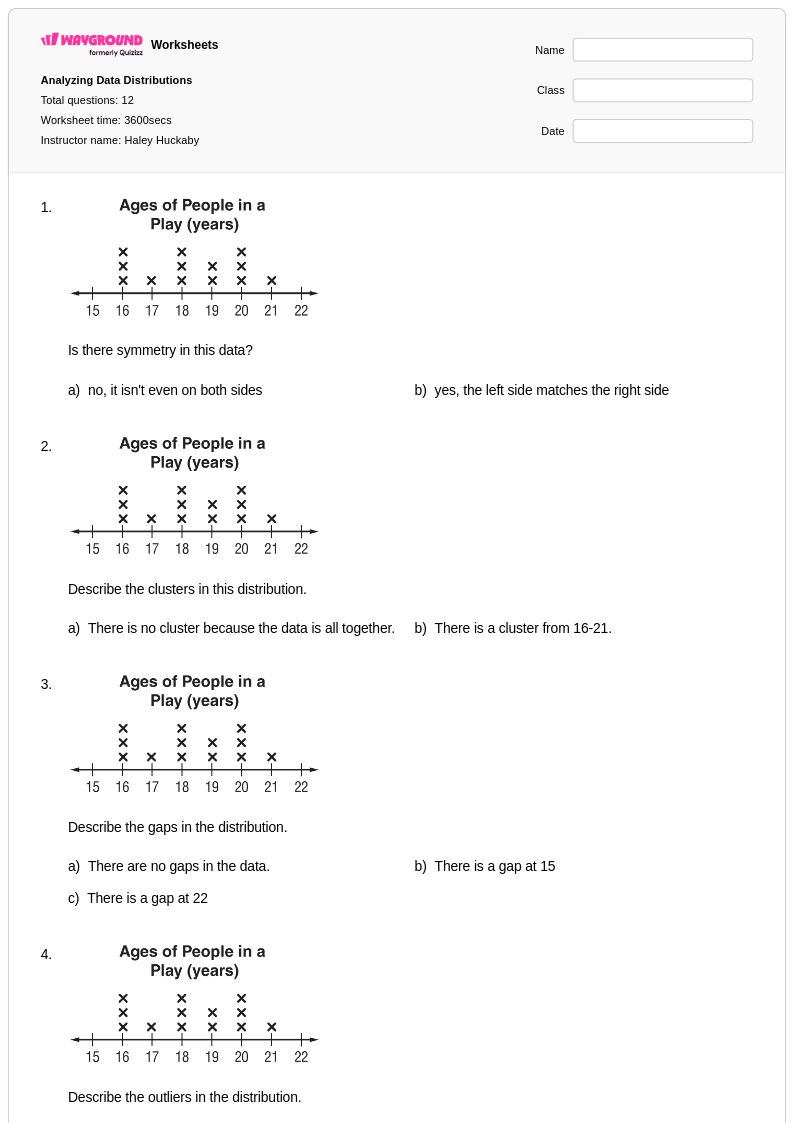
12 Q
8th
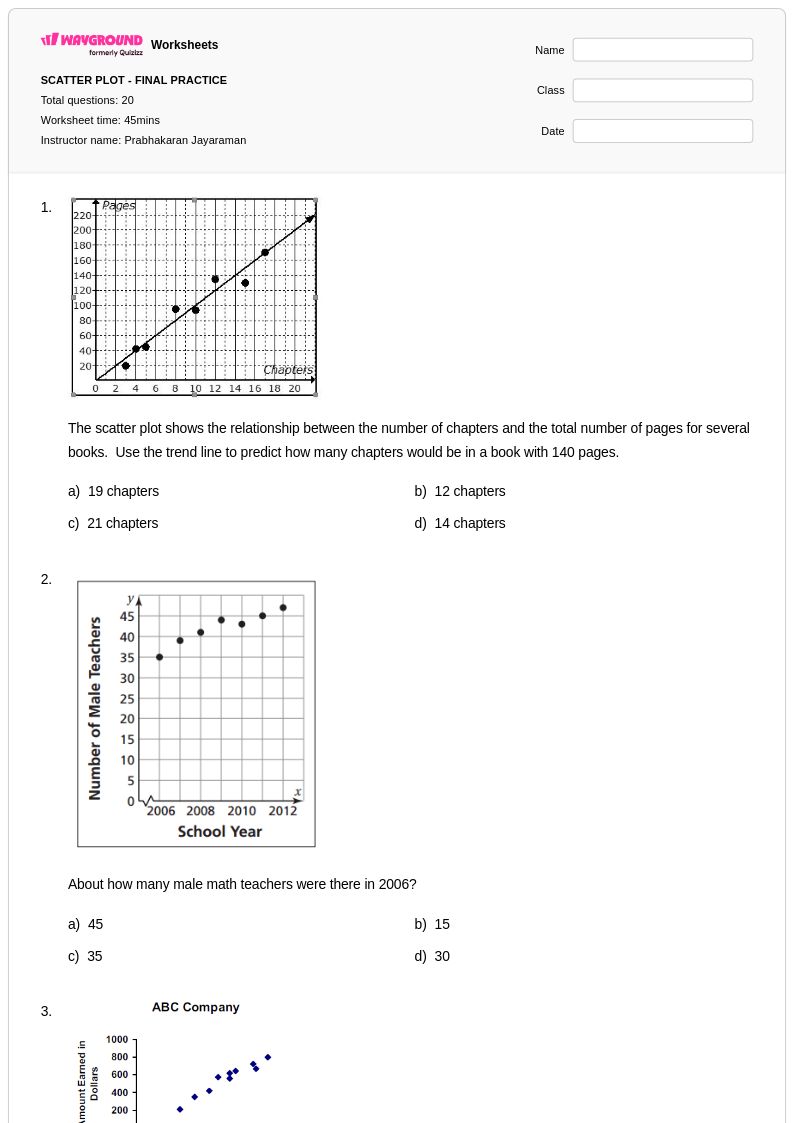
20 Q
8th
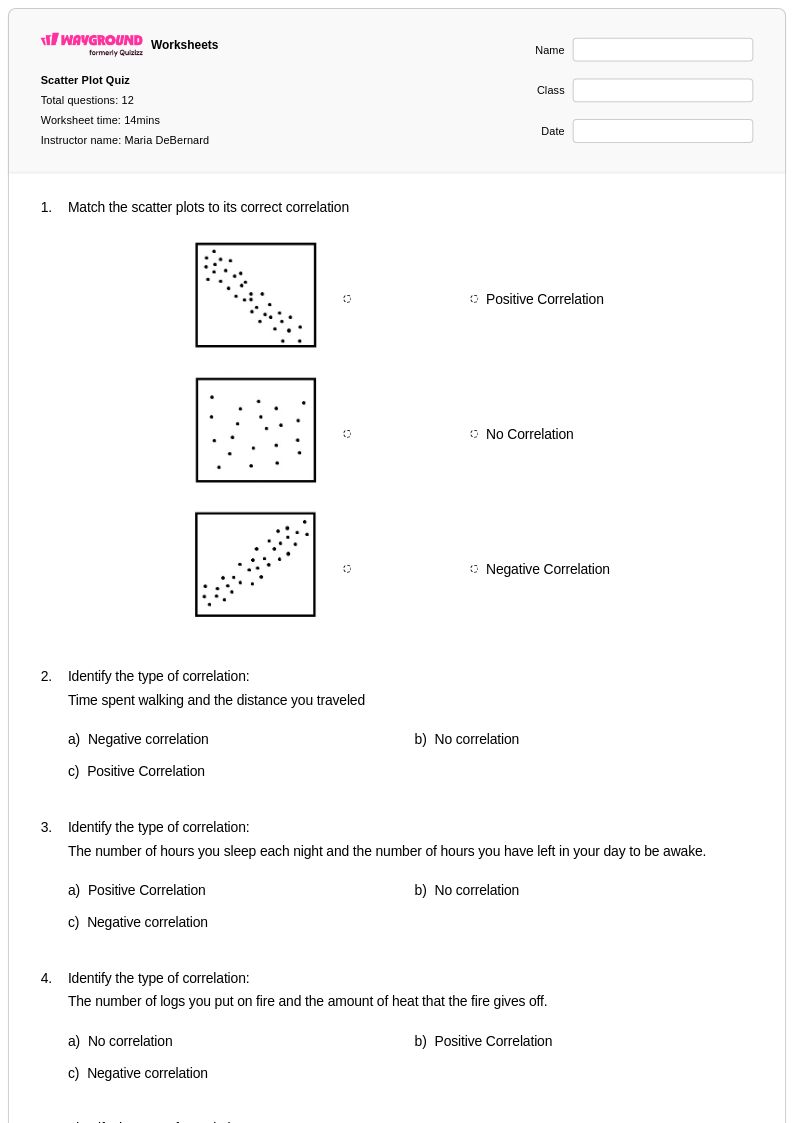
12 Q
8th
Explore Other Subject Worksheets for year 8
Explore printable Data Clusters worksheets for Year 8
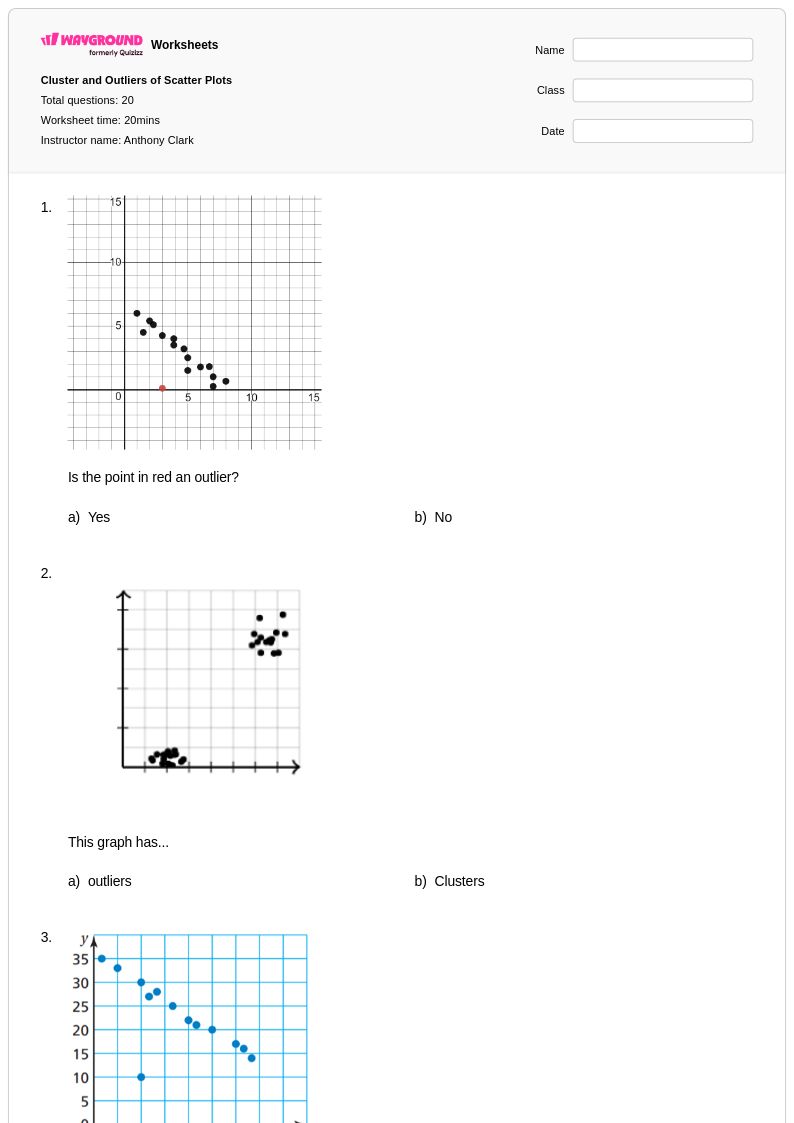
Data clusters worksheets for Year 8 mathematics through Wayground (formerly Quizizz) provide comprehensive practice opportunities for students to identify, analyze, and interpret clustered data patterns in various statistical representations. These educational resources strengthen critical analytical skills by challenging students to recognize groupings of data points, determine gaps and outliers, and draw meaningful conclusions from clustered information in scatter plots, dot plots, and other graphical displays. The collection includes diverse practice problems that progress from basic cluster identification to more complex analysis tasks, with each worksheet featuring a complete answer key to support independent learning and self-assessment. Teachers can access these free printables in convenient PDF format, making it simple to distribute materials for classroom instruction, homework assignments, or assessment preparation.
Wayground's extensive platform supports educators with millions of teacher-created data clusters resources specifically designed for Year 8 mathematics instruction. The robust search and filtering system allows teachers to quickly locate worksheets that align with specific curriculum standards and match their students' current skill levels, while built-in differentiation tools enable seamless customization for diverse learning needs. These versatile materials are available in both printable and digital formats, including downloadable PDFs that facilitate flexible lesson planning and implementation across various teaching environments. The comprehensive worksheet collection proves invaluable for targeted skill practice, remediation sessions for struggling learners, and enrichment activities for advanced students, ensuring that all Year 8 students can develop confidence in analyzing data clusters and interpreting statistical patterns.
FAQs
How do I teach data clusters in Grade 8 math?
What data-cluster exercises are useful for eighth graders?
What mistakes do Grade 8 students make when interpreting clustered data?
How can I use Grade 8 data clusters worksheets on Wayground?
How do data clusters connect to the Grade 8 Common Core math curriculum?
How can I differentiate Grade 8 data-clusters practice?
What grade level is data-cluster analysis taught at?