

15Q
8th
23Q
7th - 8th

20Q
8th - 9th
20Q
8th - Uni

10Q
8th
20Q
6th - 10th
6Q
KG - Uni
12Q
6th - 8th
24Q
8th
12Q
8th - 9th
20Q
7th - 8th
20Q
7th - 9th
14Q
8th
20Q
8th - 10th
45Q
6th - 8th
20Q
7th - Uni
25Q
7th - 8th
20Q
6th - Uni
20Q
7th - Uni
20Q
7th - Uni
9Q
1st - 10th
20Q
7th - Uni
20Q
6th - Uni
20Q
7th - 9th
Explorar Misleading Graphs hojas de trabajo por grados
Explore otras hojas de trabajo de materias para year 8
Explore printable Misleading Graphs worksheets for Year 8
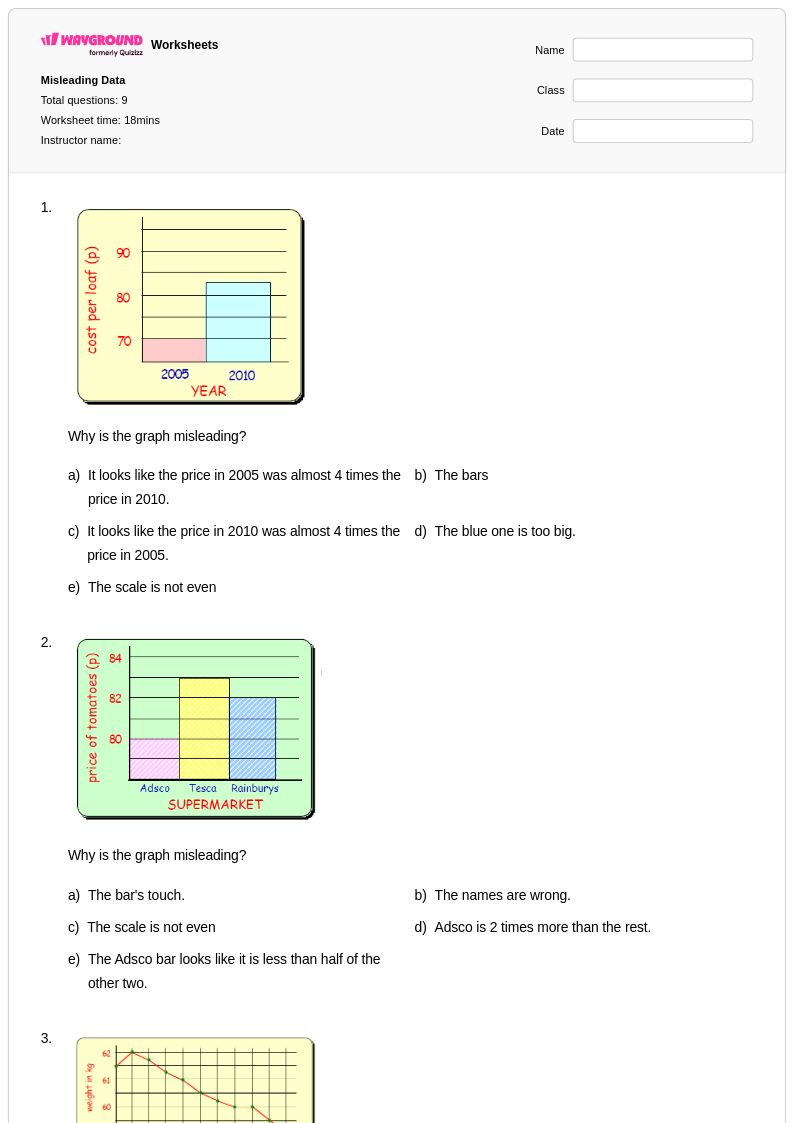
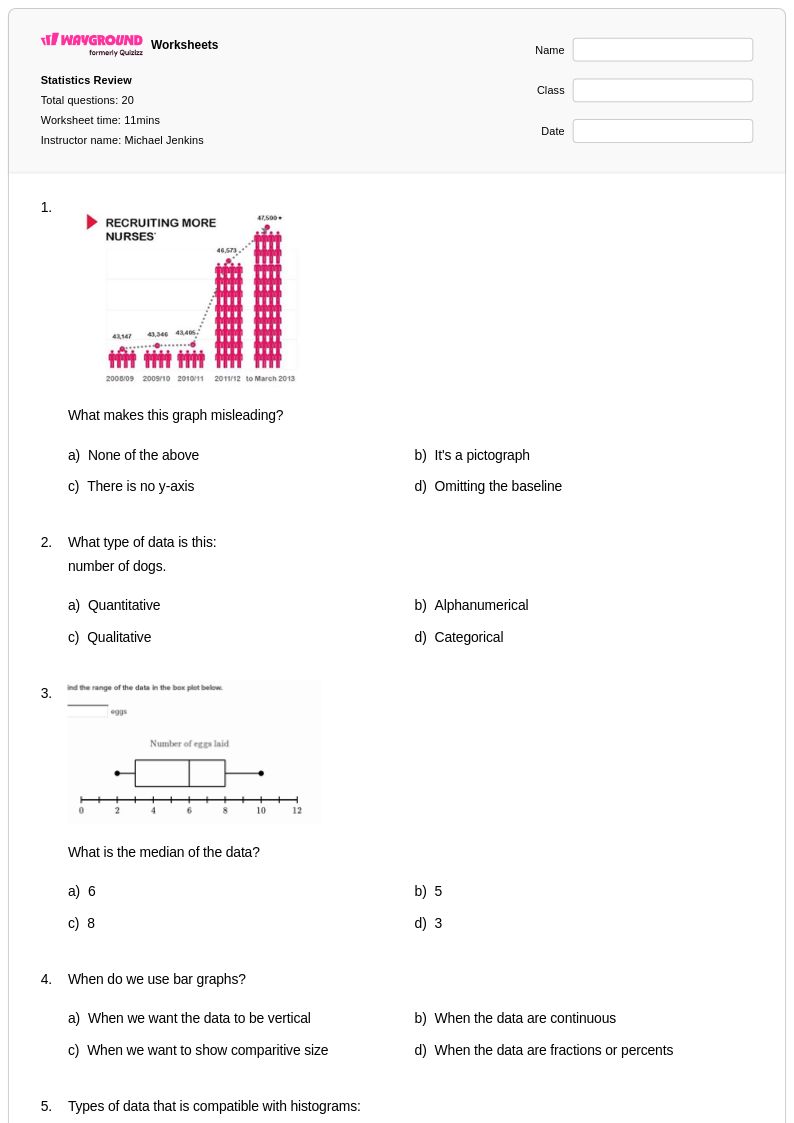
Misleading graphs worksheets for Year 8 students available through Wayground (formerly Quizizz) provide essential practice in developing critical data analysis skills that are fundamental to mathematical literacy. These comprehensive worksheet collections focus on teaching students how to identify deceptive visual representations of data, including manipulated scales, truncated axes, inappropriate graph types, and misleading titles or labels that can distort statistical information. Students work through carefully designed practice problems that challenge them to examine real-world examples of misleading graphs, analyze the techniques used to manipulate data presentation, and learn to create accurate, honest visual representations of statistical information. Each worksheet includes a detailed answer key that explains the specific misleading elements and guides students through proper graph interpretation, making these free printables valuable resources for both independent study and classroom instruction.
Wayground (formerly Quizizz) supports mathematics educators with an extensive collection of teacher-created misleading graphs worksheets that can be seamlessly integrated into Year 8 data analysis curriculum. The platform's millions of educational resources include standards-aligned materials that address specific learning objectives related to graph interpretation and statistical reasoning, with robust search and filtering capabilities that allow teachers to quickly locate worksheets targeting particular misconceptions or skill levels. Teachers can customize these materials to meet diverse student needs, creating differentiated assignments for remediation or enrichment while maintaining focus on essential graph literacy skills. Available in both printable pdf format and interactive digital versions, these worksheet collections support flexible lesson planning and provide educators with reliable tools for skill practice, formative assessment, and targeted intervention in helping students become discerning consumers of statistical information.