
20 Q
9th - Uni
9 Q
9th - 12th
8 Q
9th
20 Q
9th - Uni
15 Q
9th - Uni
18 Q
9th - 12th
22 Q
9th
45 Q
9th
28 Q
9th - 12th
12 Q
9th - 10th
13 Q
9th - 12th
26 Q
9th - Uni
15 Q
9th - 12th
8 Q
6th - Uni
22 Q
9th - 10th
33 Q
9th - 12th
14 Q
9th - 12th
19 Q
9th
17 Q
9th
25 Q
9th
64 Q
9th
21 Q
9th
25 Q
9th - 12th
Explore Other Subject Worksheets for year 9
Explore printable Residuals worksheets for Year 9
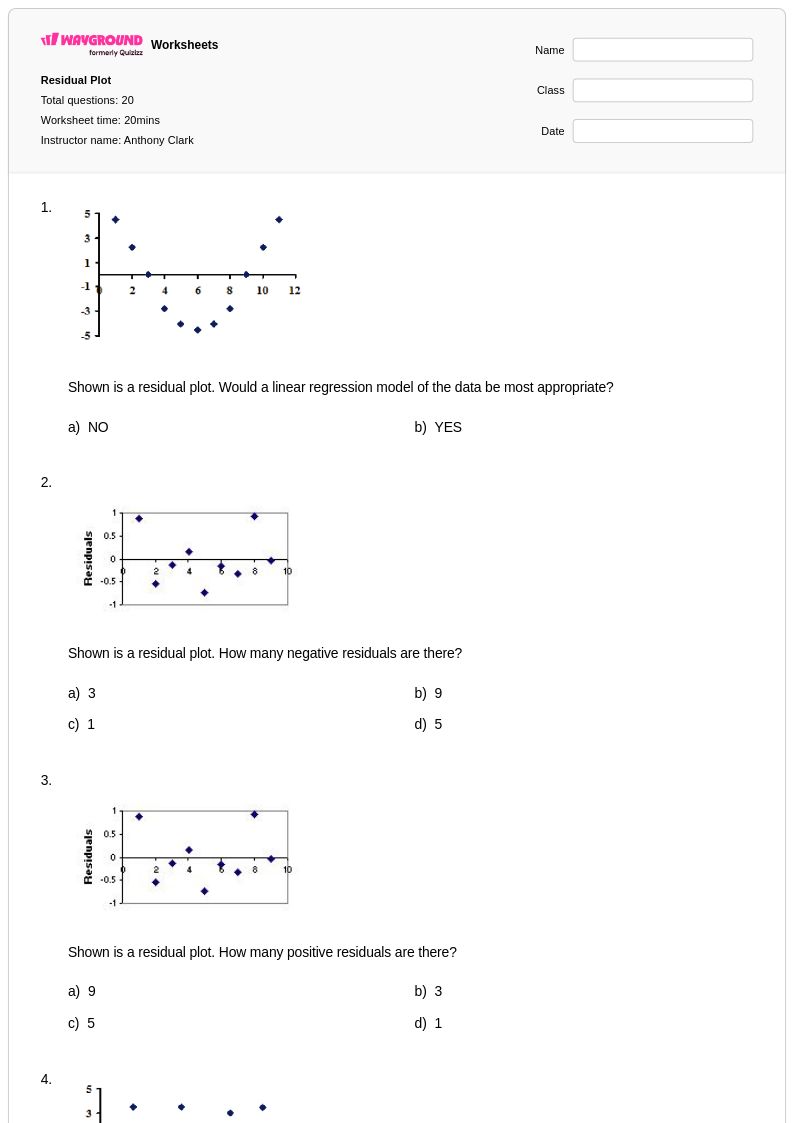
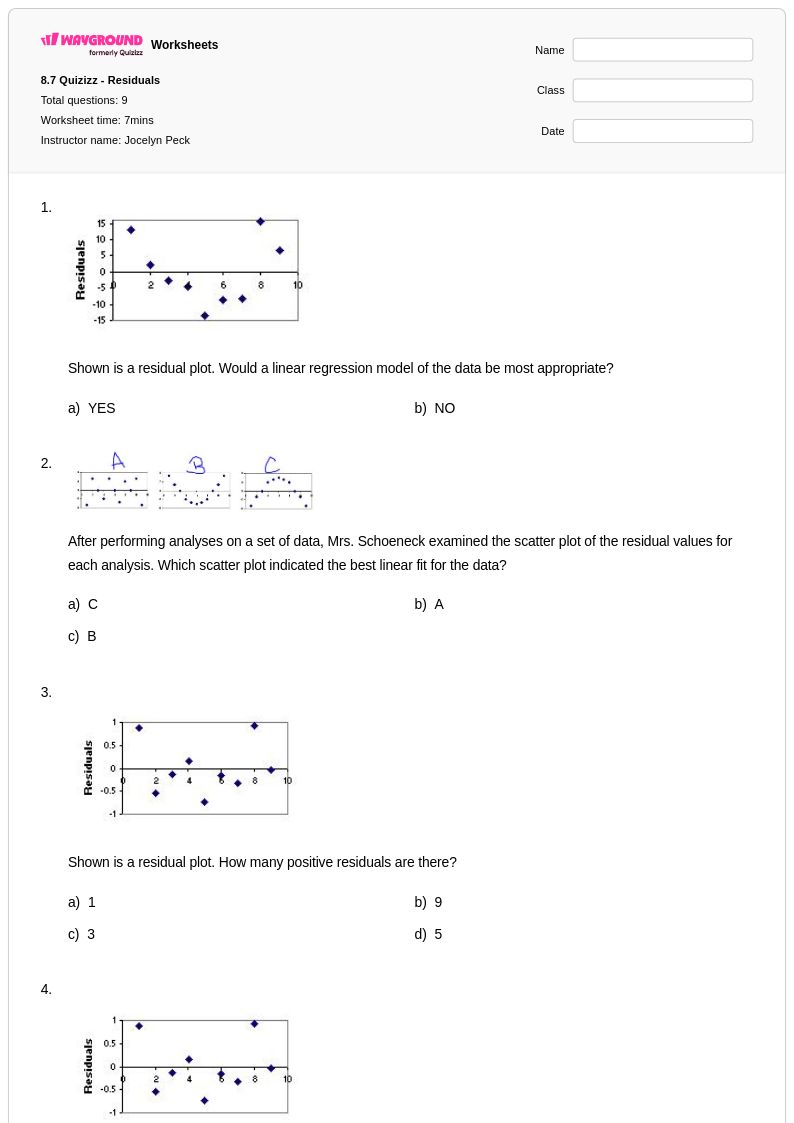
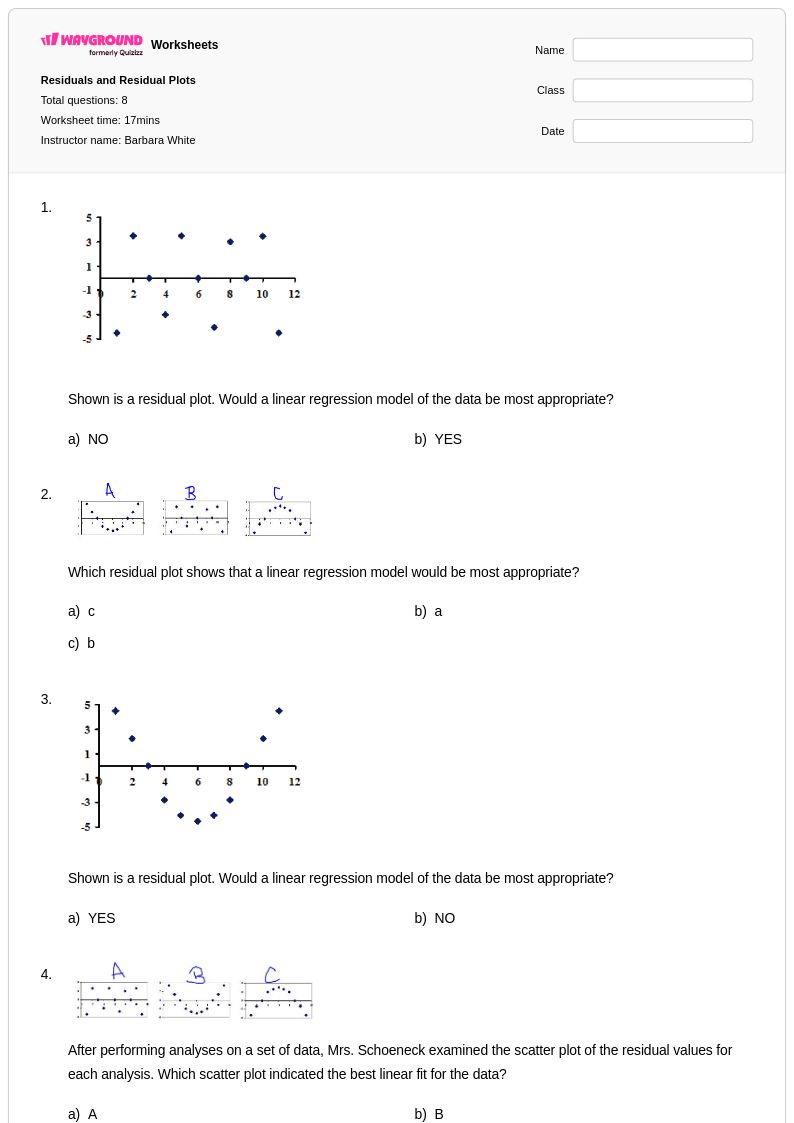
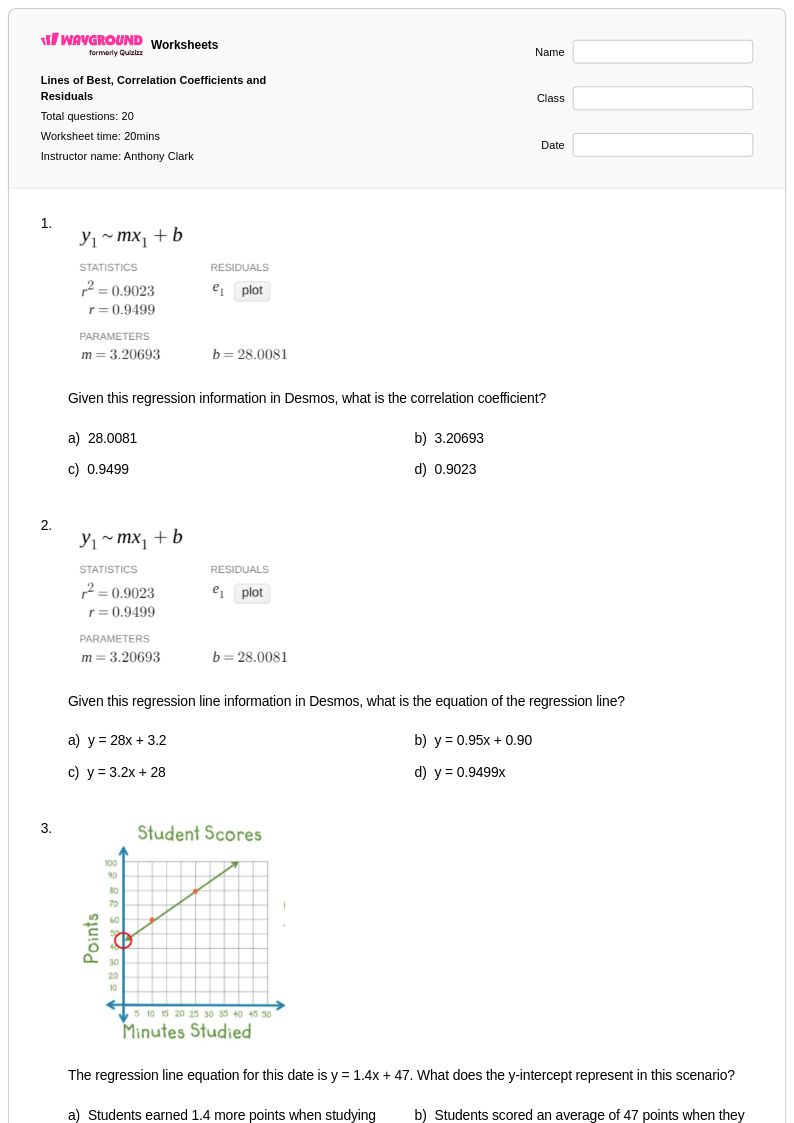
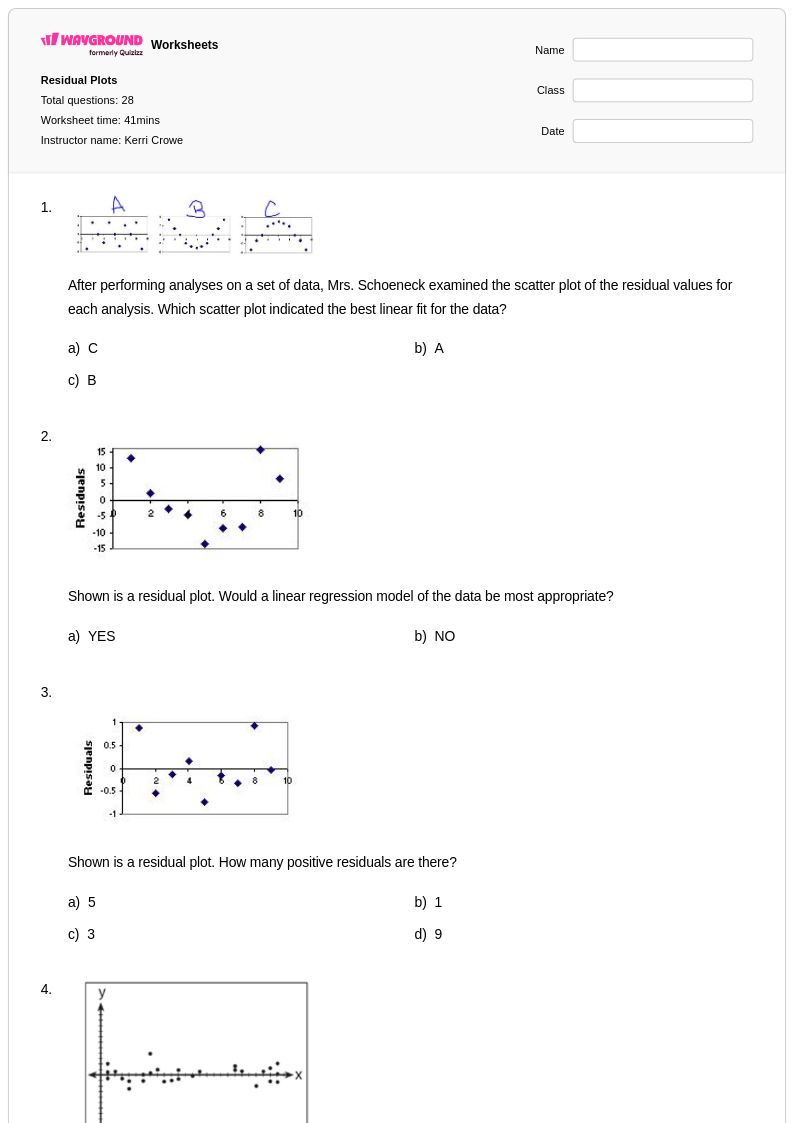
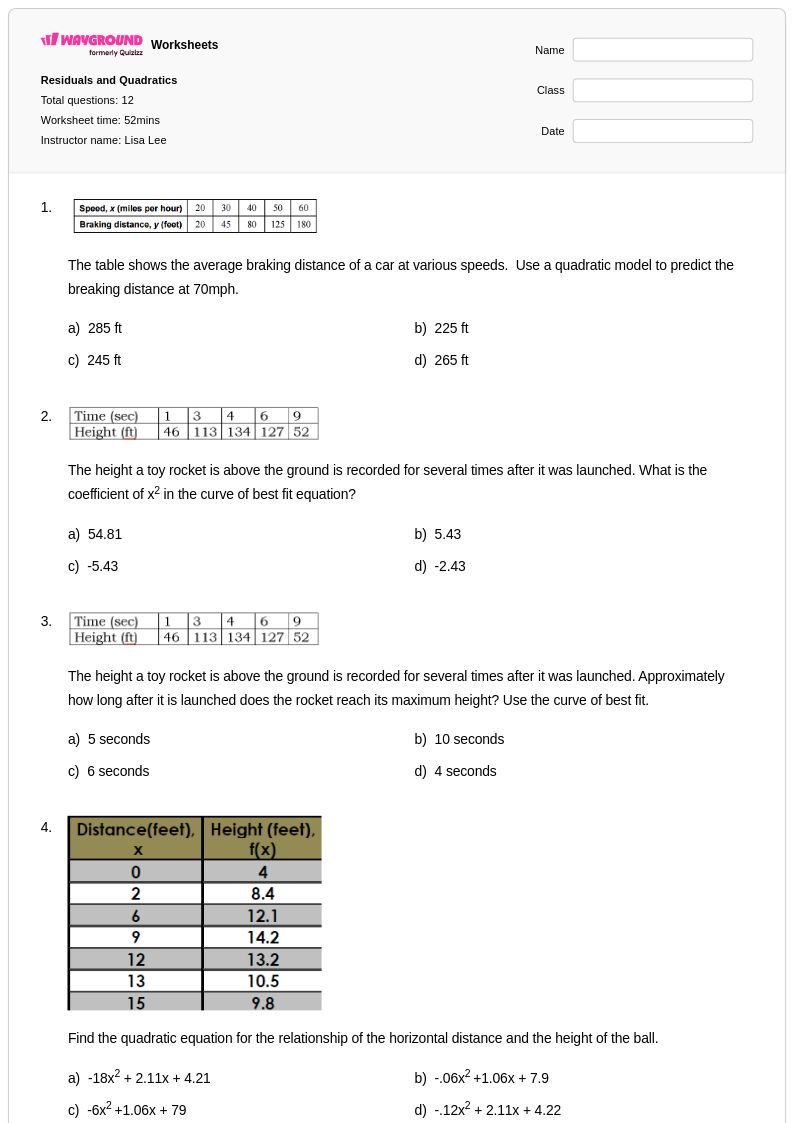
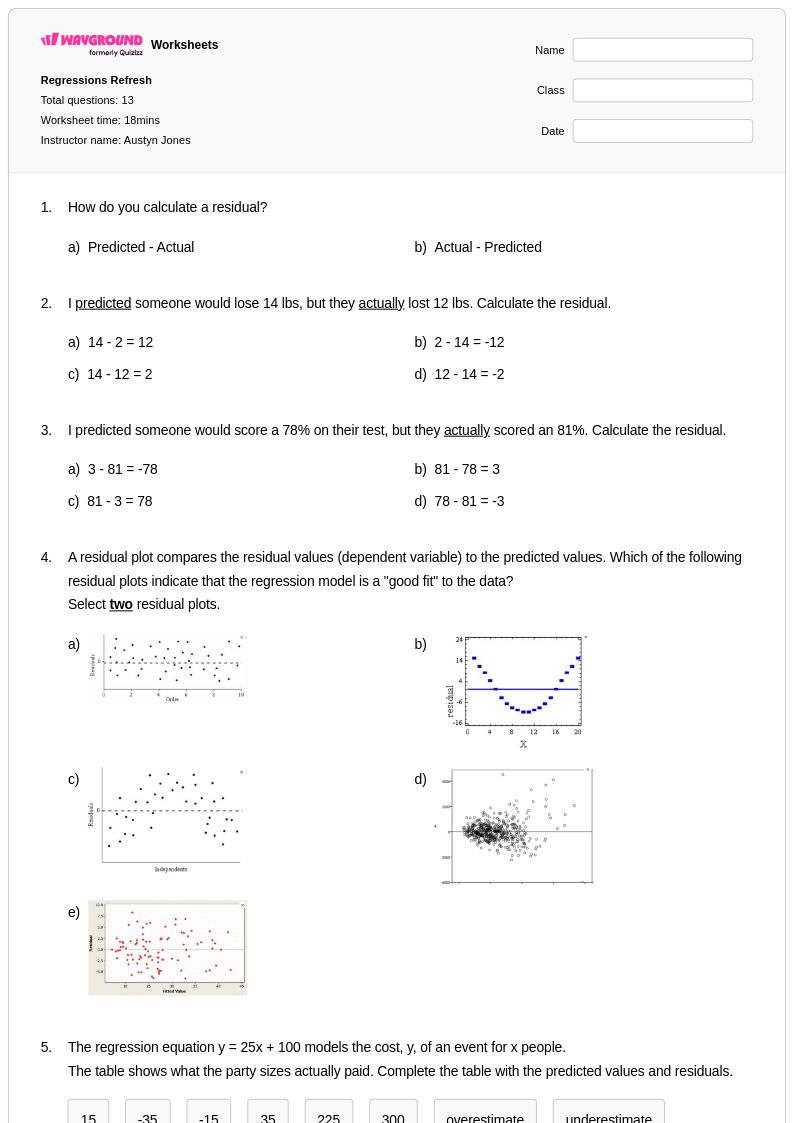
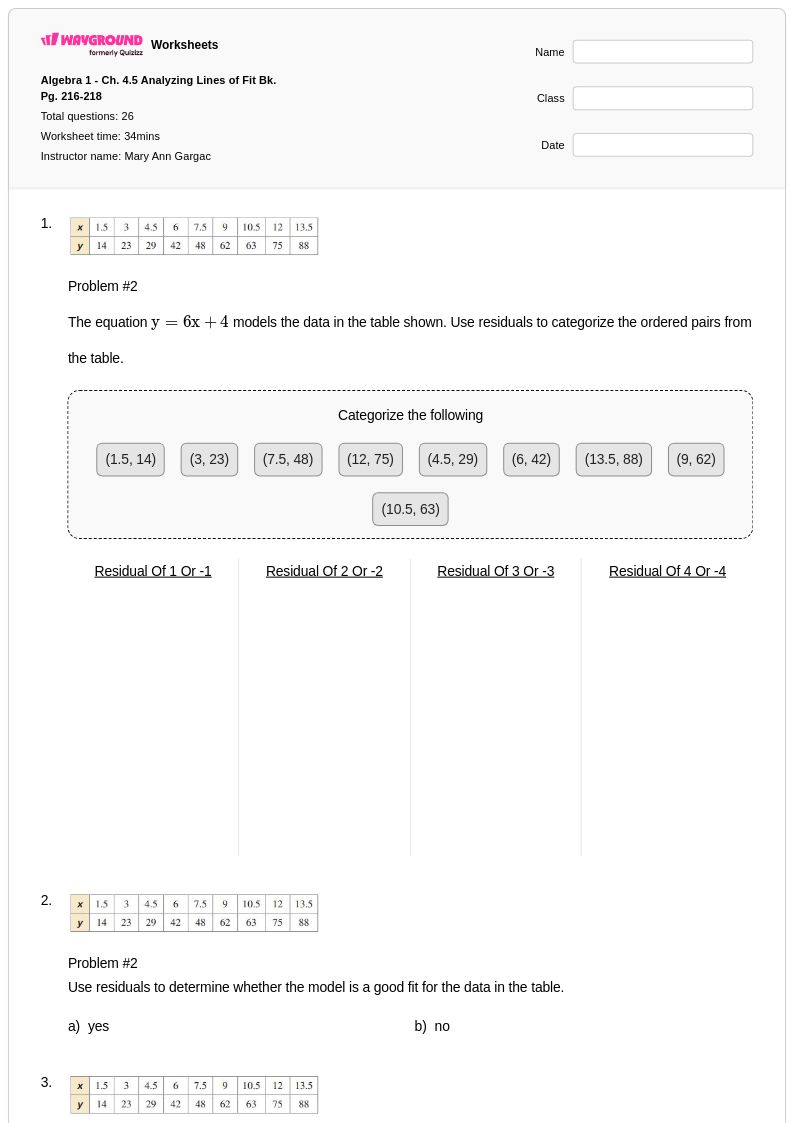
Residuals worksheets for Year 9 students available through Wayground (formerly Quizizz) provide comprehensive practice in analyzing the differences between observed and predicted values in statistical models. These expertly designed worksheets strengthen essential skills in interpreting scatter plots, calculating residual values, identifying patterns in residual plots, and understanding what residuals reveal about the appropriateness of linear models. Students work through systematic practice problems that build their ability to determine whether a linear regression model fits data well by examining residual patterns, while developing critical thinking skills about statistical analysis. Each worksheet includes detailed answer keys and explanations, and these free printables offer teachers reliable resources for reinforcing this fundamental concept in probability and statistics education.
Wayground (formerly Quizizz) supports mathematics educators with an extensive collection of teacher-created residuals worksheets that can be easily searched, filtered, and customized to meet diverse classroom needs. The platform's millions of resources include materials aligned to curriculum standards, offering teachers flexibility to select worksheets appropriate for different skill levels and learning objectives. These versatile tools are available in both printable pdf format and interactive digital versions, enabling teachers to seamlessly integrate residuals practice into lesson planning, targeted remediation for students struggling with regression analysis concepts, and enrichment activities for advanced learners. The platform's differentiation capabilities allow educators to modify worksheets based on individual student needs, ensuring that all Year 9 students can develop confidence in analyzing residual plots and understanding their significance in statistical modeling.