Graphing the Relationship Between Two Variables - Printable Scatter-plot-correlation Worksheets Year 12 - Quizizz
Graphing the Relationship Between Two Variables

20 Q

8th - Uni

Patterns with Scatter Plots - Printable Scatter-plot-correlation Worksheets Year 12 - Quizizz
Patterns with Scatter Plots

20 Q

8th - Uni

Scatter Plots, Functions, Two-Way Tables - Printable Scatter-plot-correlation Worksheets Year 12 - Quizizz
Scatter Plots, Functions, Two-Way Tables

15 Q

8th - Uni

Line Graph and Scatter Plot - Printable Scatter-plot-correlation Worksheets Year 12 - Quizizz
Line Graph and Scatter Plot

15 Q

9th - Uni

Correlation of Data Sets - Printable Scatter-plot-correlation Worksheets Year 12 - Quizizz
Correlation of Data Sets

20 Q

8th - Uni

Scatter Plot - Printable Scatter-plot-correlation Worksheets Year 12 - Quizizz
Scatter Plot

15 Q

8th - Uni

Scatter Plot - Printable Scatter-plot-correlation Worksheets Year 12 - Quizizz
Scatter Plot

9 Q

7th - 12th

Desmos Associations in Data - Printable Scatter-plot-correlation Worksheets Year 12 - Quizizz
Desmos Associations in Data

20 Q

8th - Uni

Linear Which Correlation Best Describes The Strength Of The Linear Association - Printable Scatter-plot-correlation Worksheets Year 12 - Quizizz
Linear Which Correlation Best Describes The Strength Of The Linear Association

20 Q

9th - Uni

2025 AP Stats Correlation - Printable Scatter-plot-correlation Worksheets Year 12 - Quizizz
2025 AP Stats Correlation

20 Q

9th - 12th

Residual Plots - Printable Scatter-plot-correlation Worksheets Year 12 - Quizizz
Residual Plots

28 Q

9th - 12th

Unit 6 Bivariate Data Review - Printable Scatter-plot-correlation Worksheets Year 12 - Quizizz
Unit 6 Bivariate Data Review

11 Q

9th - 12th

Linear Which Correlation Best Describes The Strength Of The Linear Association Table - Printable Scatter-plot-correlation Worksheets Year 12 - Quizizz
Linear Which Correlation Best Describes The Strength Of The Linear Association Table

20 Q

9th - Uni

Read Graph Linear - Printable Scatter-plot-correlation Worksheets Year 12 - Quizizz
Read Graph Linear

20 Q

8th - Uni

1.8 Lines and Correlations - Printable Scatter-plot-correlation Worksheets Year 12 - Quizizz
1.8 Lines and Correlations

15 Q

9th - 12th

JHS ALG QUIZ 7.1 - Printable Scatter-plot-correlation Worksheets Year 12 - Quizizz
JHS ALG QUIZ 7.1

20 Q

9th - 12th

Alg 1 Term 1 Final Exam - Printable Scatter-plot-correlation Worksheets Year 12 - Quizizz
Alg 1 Term 1 Final Exam

9 Q

9th - 12th

SHS Algebra Unit 7 Practice Test - Printable Scatter-plot-correlation Worksheets Year 12 - Quizizz
SHS Algebra Unit 7 Practice Test

29 Q

9th - 12th

Bivariate Data Asssessment - Printable Scatter-plot-correlation Worksheets Year 12 - Quizizz
Bivariate Data Asssessment

21 Q

9th - 12th

Plot Order Pairs - Printable Scatter-plot-correlation Worksheets Year 12 - Quizizz
Plot Order Pairs

18 Q

7th - Uni

THE ALGEBRA I FINAL FOR HOLIDAY HAPPINESS - Printable Scatter-plot-correlation Worksheets Year 12 - Quizizz
THE ALGEBRA I FINAL FOR HOLIDAY HAPPINESS

24 Q

9th - 12th

Algebra Readiness Final Review - Printable Scatter-plot-correlation Worksheets Year 12 - Quizizz
Algebra Readiness Final Review

40 Q

9th - 12th

Math Nation Algebra - Printable Scatter-plot-correlation Worksheets Year 12 - Quizizz
Math Nation Algebra

20 Q

9th - Uni

T3U12 Upper Regressions Practice Long - Printable Scatter-plot-correlation Worksheets Year 12 - Quizizz
T3U12 Upper Regressions Practice Long

15 Q

12th

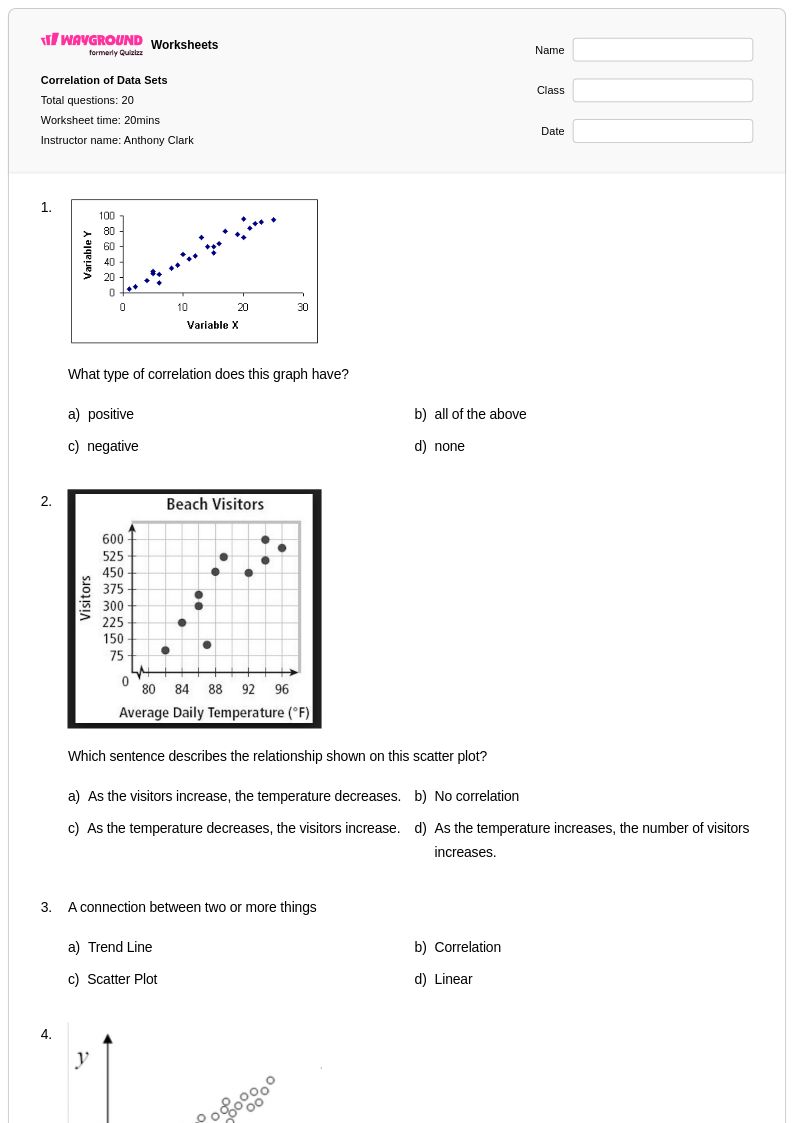
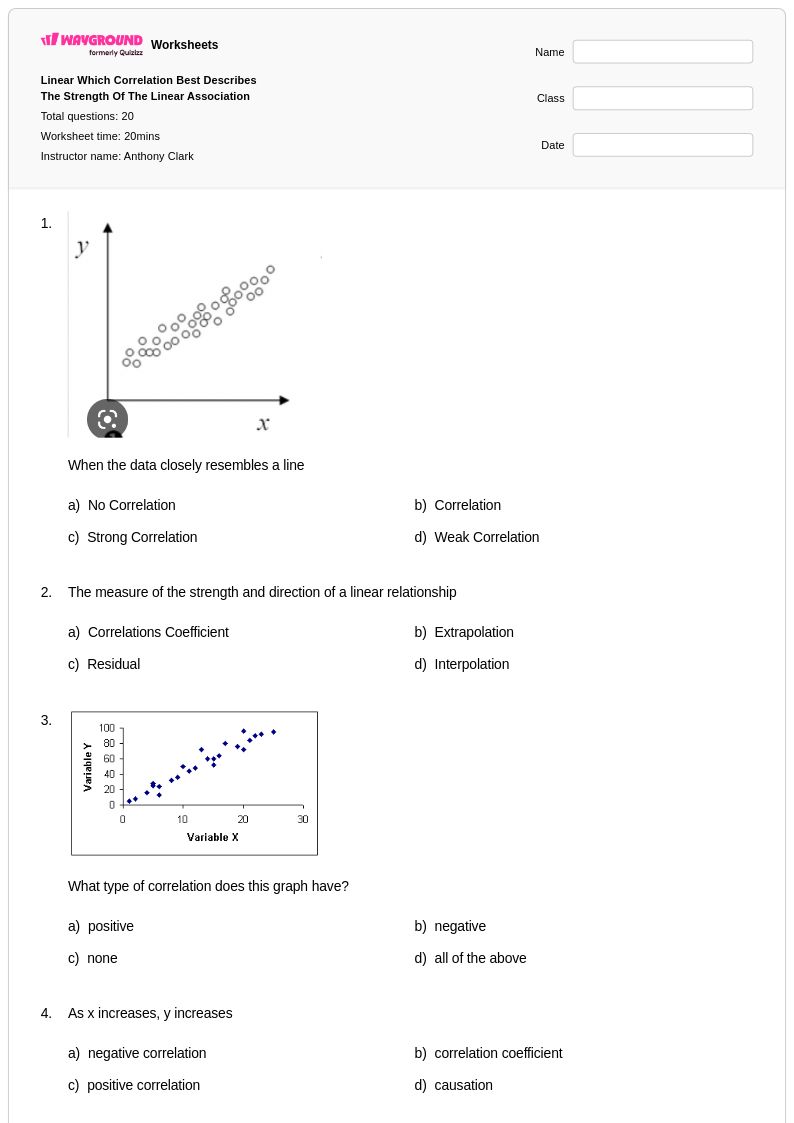
Explore printable Scatter Plot Correlation worksheets for Year 12

Scatter plot correlation worksheets for Year 12 students available through Wayground (formerly Quizizz) provide comprehensive practice in analyzing relationships between quantitative variables and interpreting correlation coefficients. These expertly crafted worksheets strengthen essential statistical skills including identifying positive, negative, and zero correlations, calculating correlation coefficients, distinguishing between correlation and causation, and making predictions using trend lines. Students engage with real-world data sets through carefully designed practice problems that progress from basic scatter plot interpretation to advanced correlation analysis, with complete answer keys provided to support independent learning and self-assessment. The free printable resources and pdf formats ensure accessibility for diverse learning environments while building the critical thinking skills necessary for advanced mathematics and data science applications.

Wayground (formerly Quizizz) empowers educators with millions of teacher-created scatter plot correlation resources specifically designed for Year 12 mathematics instruction, featuring robust search and filtering capabilities that allow teachers to locate materials perfectly aligned with curriculum standards and learning objectives. The platform's comprehensive collection supports differentiated instruction through customizable worksheets that can be modified for various skill levels, from foundational correlation concepts for students needing remediation to complex statistical analysis for advanced learners seeking enrichment. Teachers benefit from flexible delivery options including both printable and digital formats, enabling seamless integration into classroom instruction, homework assignments, or independent study sessions. These thoughtfully curated resources streamline lesson planning while providing the scaffolded practice students need to master correlation analysis and develop confidence in interpreting statistical relationships within scatter plots.