
24 Q
6th - 8th
11 Q
6th - 8th
17 Q
6th - 8th
25 Q
5th - Uni
10 Q
6th - 8th
21 Q
6th
10 Q
6th
22 Q
6th
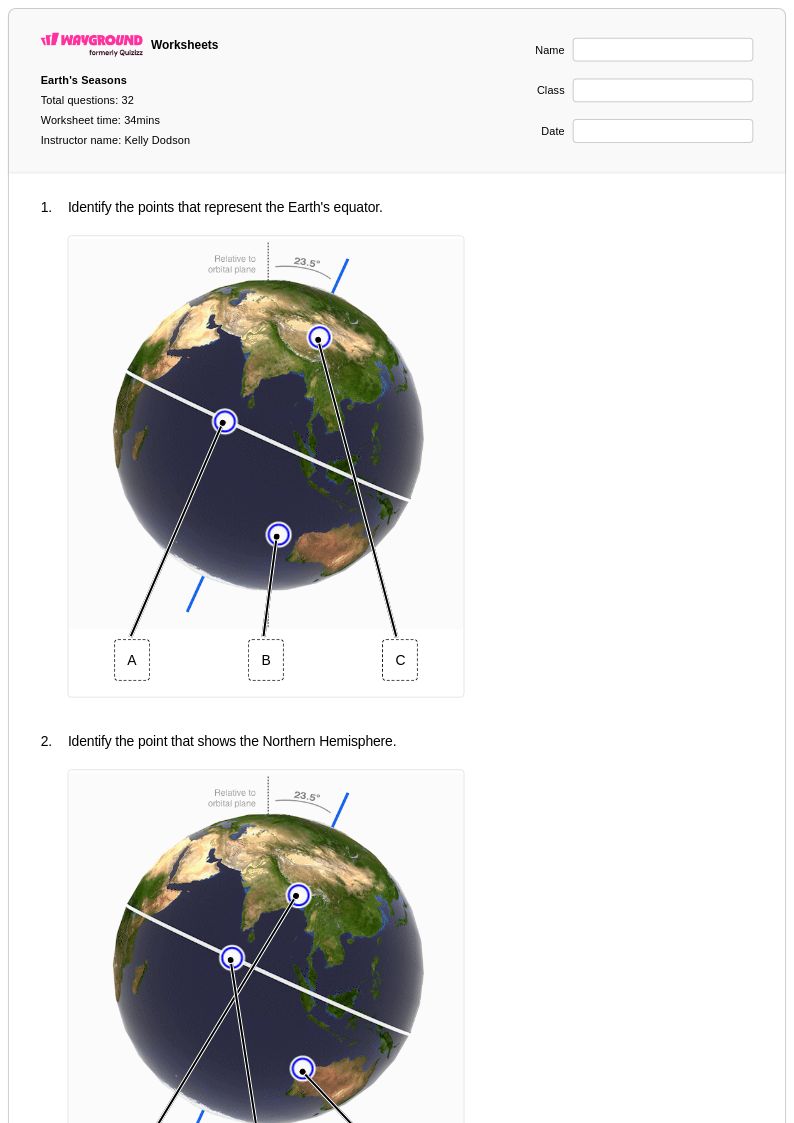
32 Q
6th
415 Q
6th - 8th
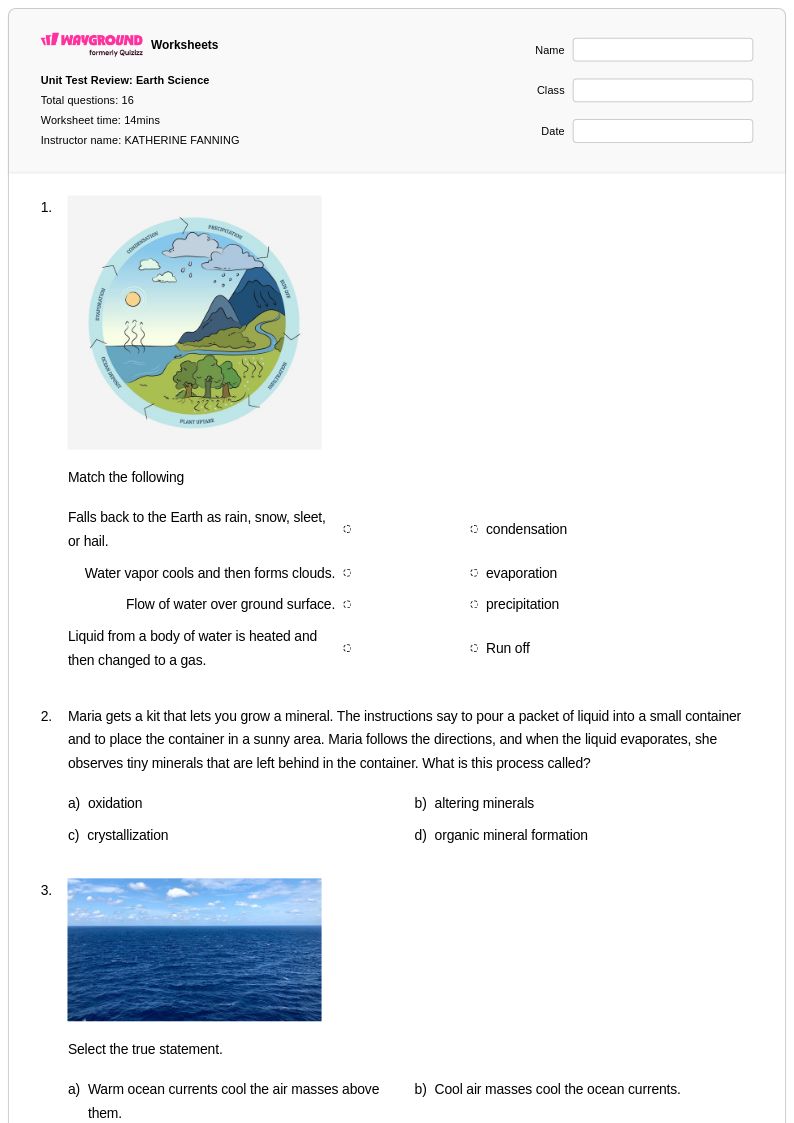
16 Q
6th
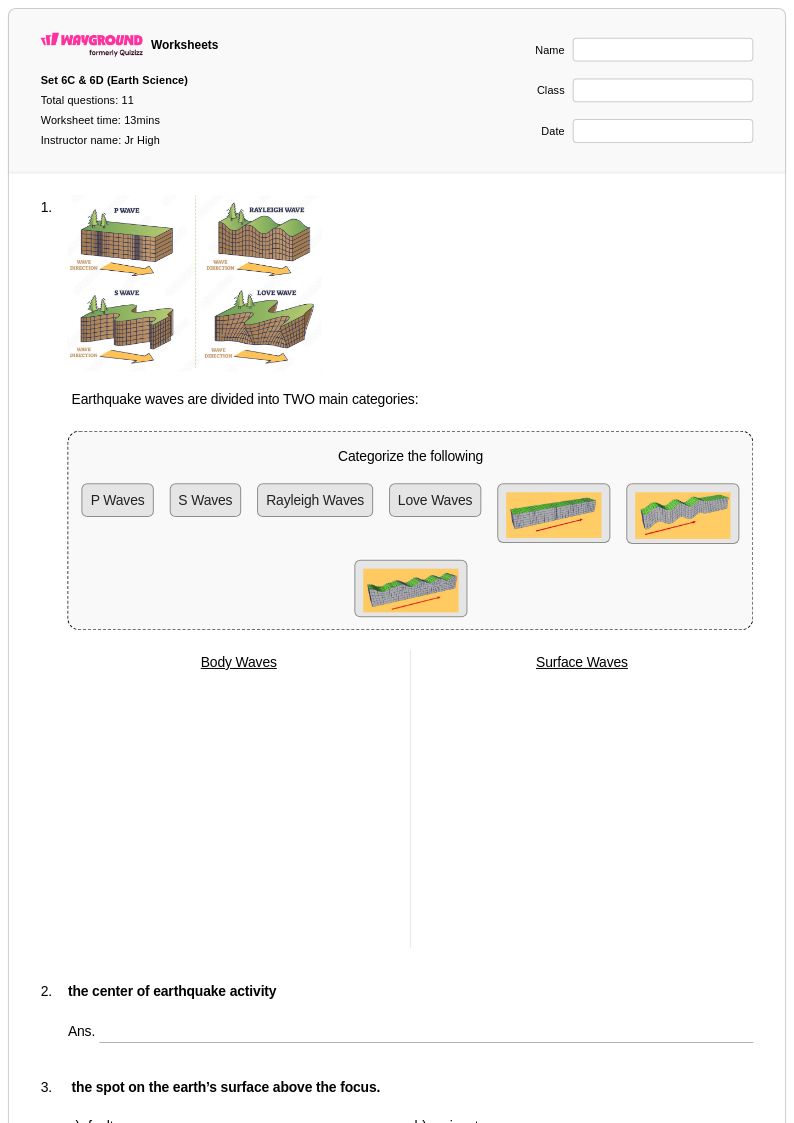
11 Q
6th - 8th
10 Q
6th
10 Q
6th
14 Q
6th
15 Q
6th
16 Q
6th - 8th
10 Q
6th
16 Q
6th - 8th
100 Q
6th - 8th
18 Q
6th - 8th
23 Q
6th
10 Q
6th - 8th
12 Q
6th - Uni
Explore Earth Science Graph Analysis Worksheets by Grades
Explore Other Subject Worksheets for class 6
Explore printable Earth Science Graph Analysis worksheets for Class 6
Earth Science Graph Analysis worksheets for Class 6 students available through Wayground (formerly Quizizz) provide essential practice in interpreting and analyzing scientific data representations commonly found in earth science studies. These comprehensive worksheets strengthen students' abilities to read line graphs showing temperature changes over time, interpret bar charts displaying precipitation patterns, analyze scatter plots of geological data, and extract meaningful information from various data visualizations related to weather patterns, rock formations, and planetary movements. Each worksheet includes detailed answer keys and practice problems that guide students through the systematic process of identifying trends, making predictions based on data, and drawing evidence-based conclusions from graphical information, with materials available as free printables and downloadable pdf formats for classroom flexibility.
Wayground (formerly Quizizz) supports educators with an extensive collection of teacher-created resources specifically designed for Class 6 Earth Science Graph Analysis instruction, featuring millions of worksheets that can be easily located through robust search and filtering capabilities. The platform's standards-aligned materials enable teachers to differentiate instruction by selecting worksheets that match individual student needs, from basic graph reading skills to advanced data interpretation challenges. These resources are available in both printable and digital formats, including pdf downloads, allowing teachers to seamlessly integrate graph analysis practice into lesson planning, targeted remediation sessions, and enrichment activities. The flexible customization tools enable educators to modify existing worksheets or combine multiple resources to create comprehensive skill practice sessions that reinforce students' understanding of how scientists use graphs to communicate earth science phenomena and research findings.