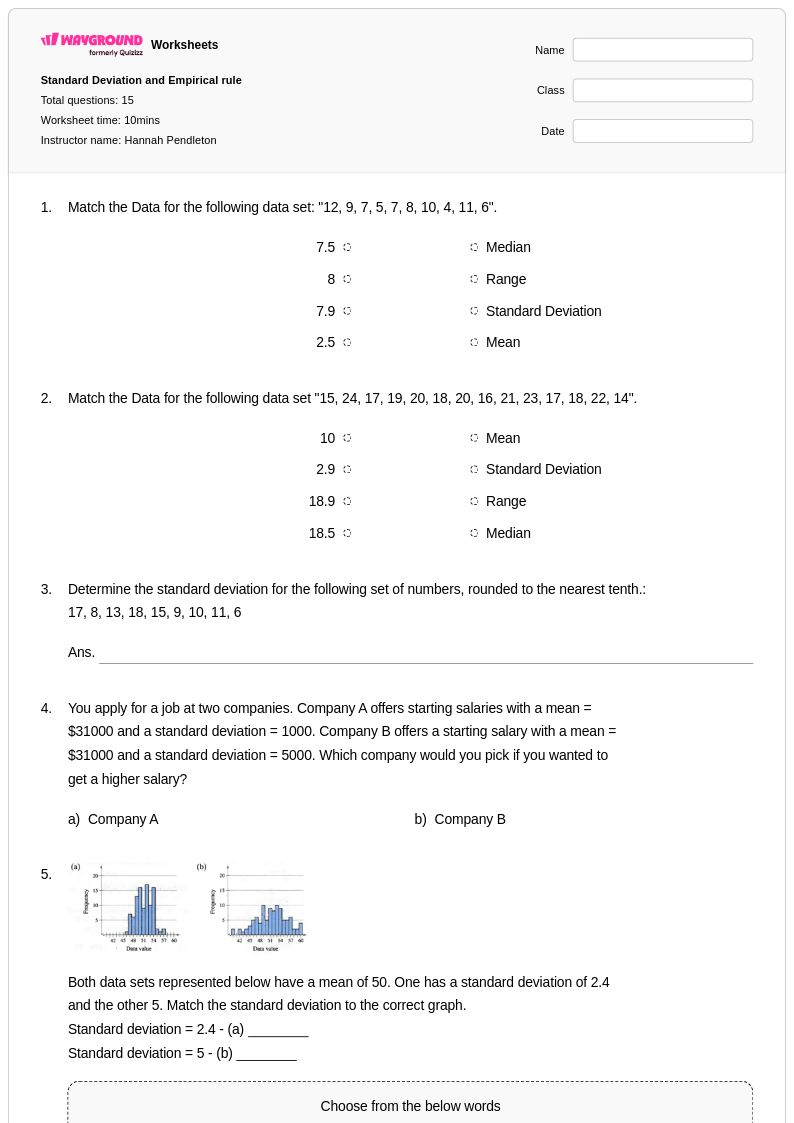
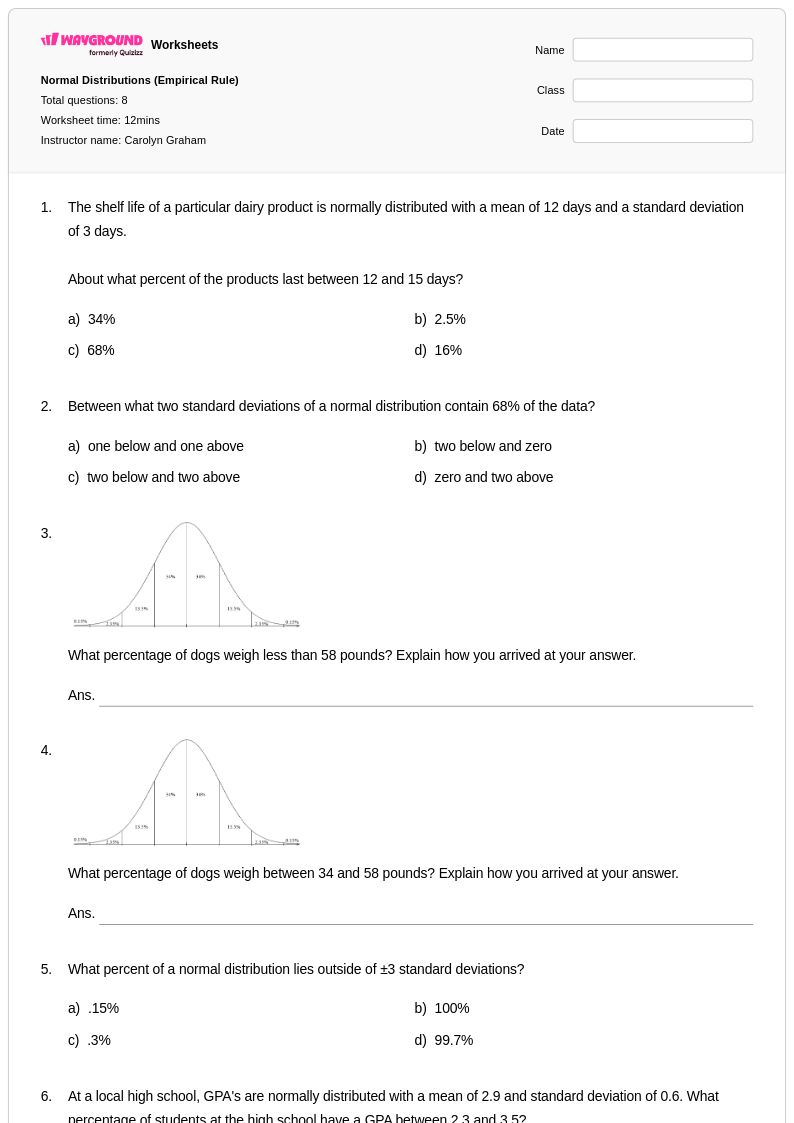
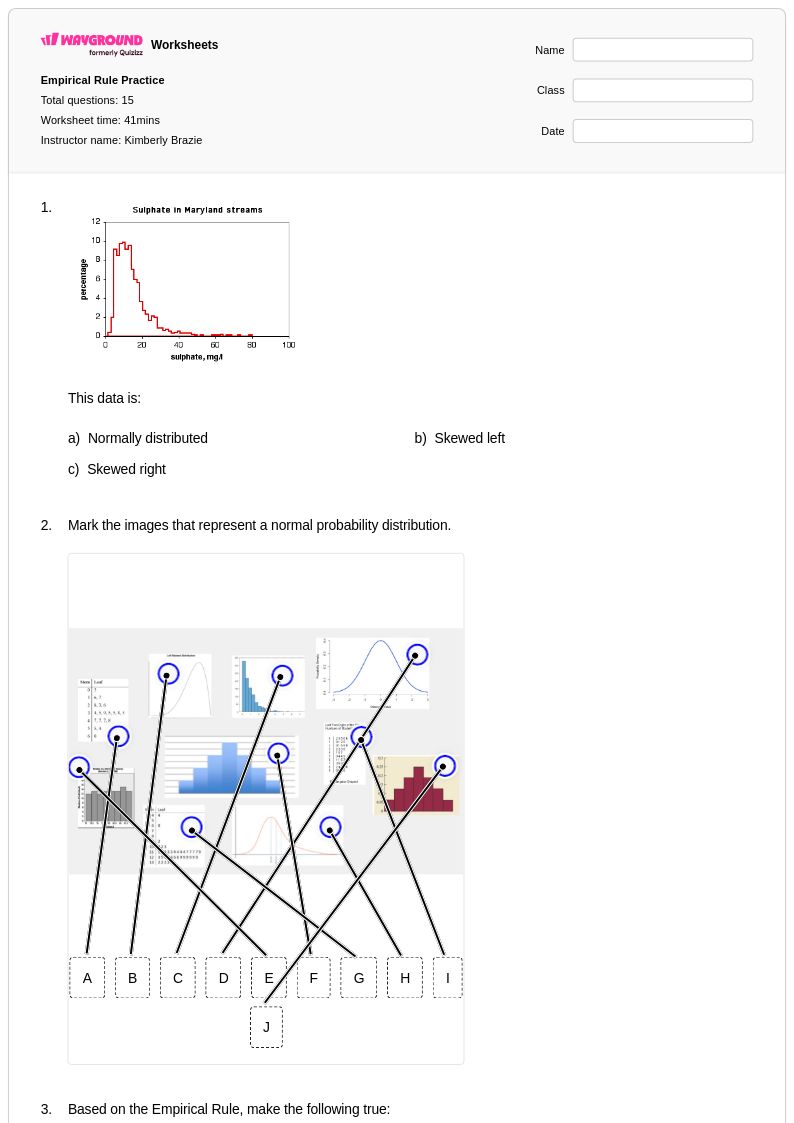
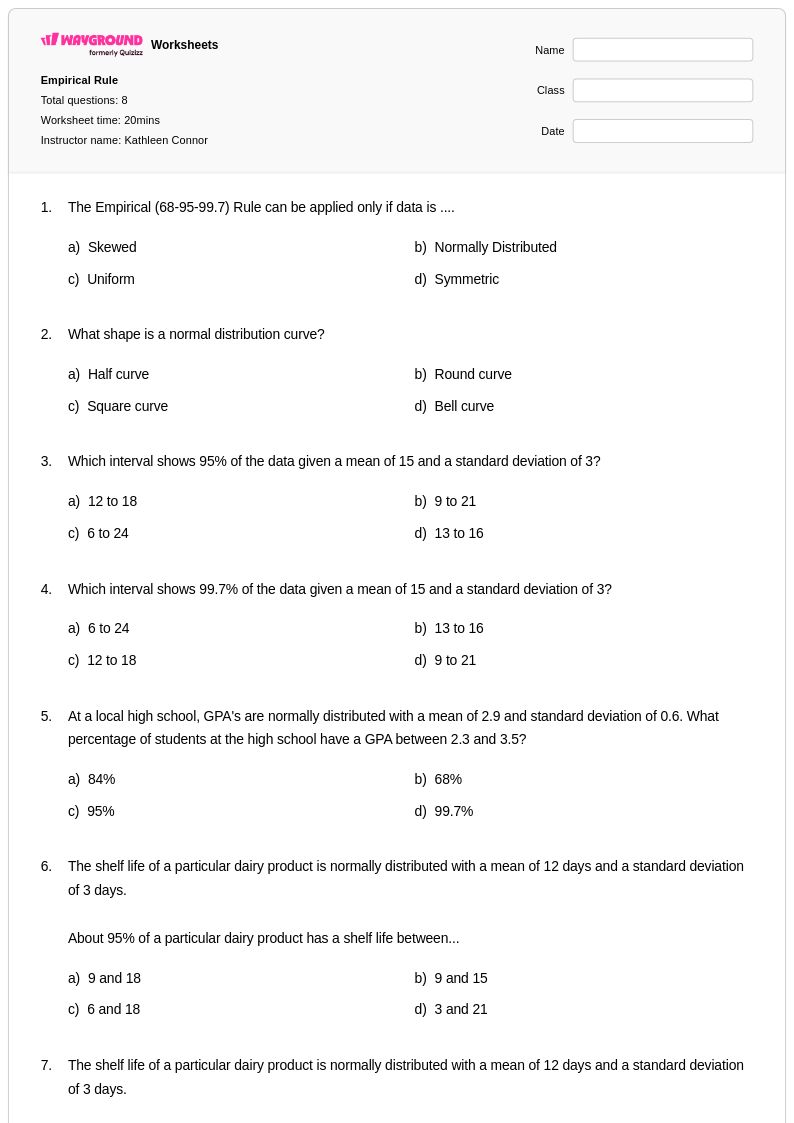
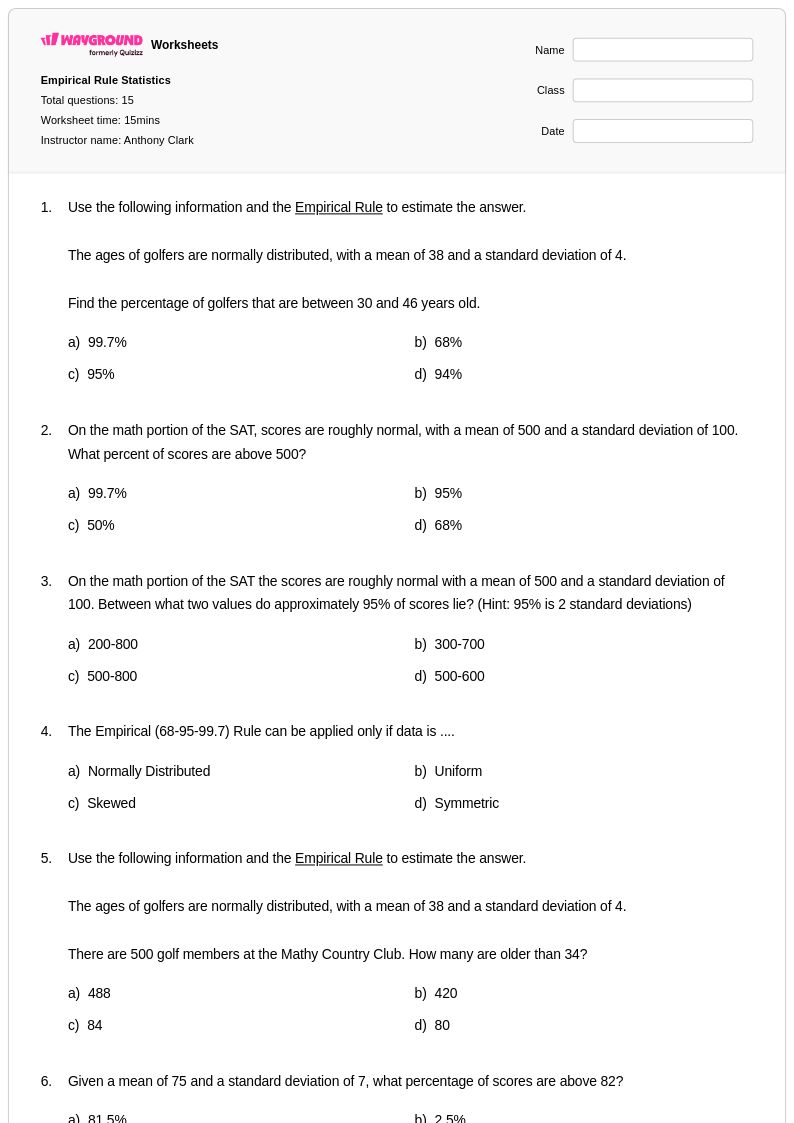
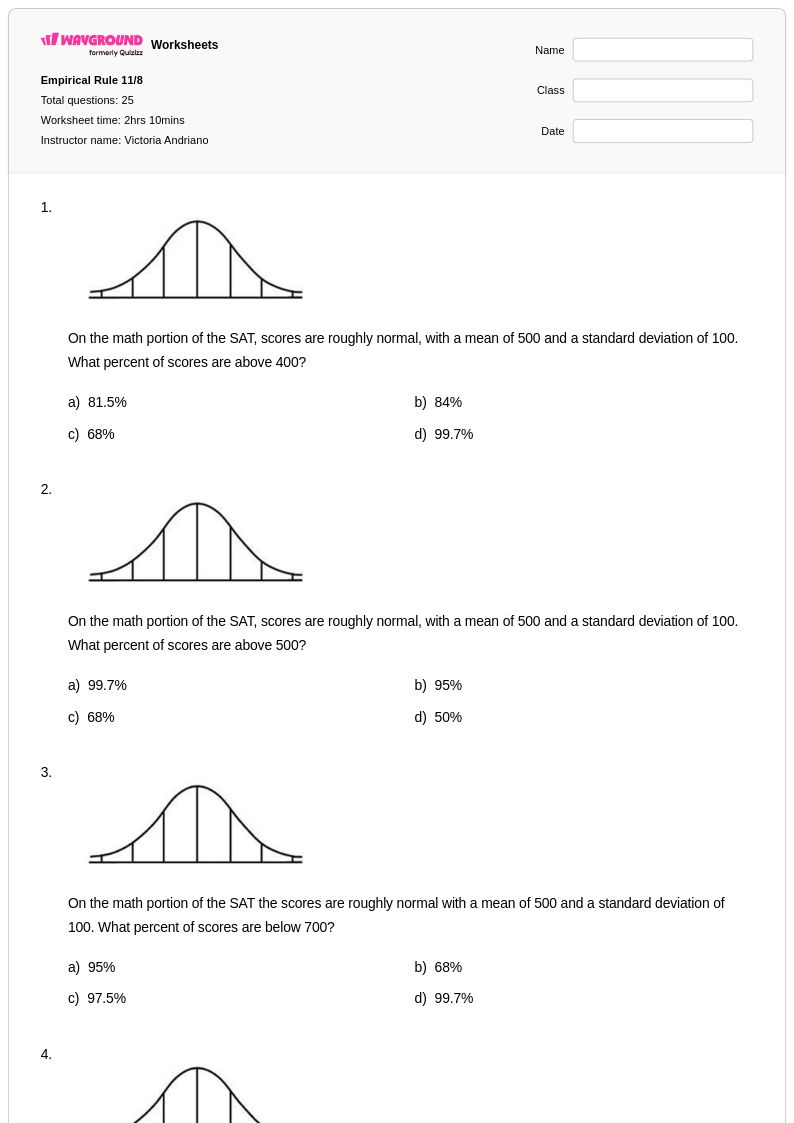
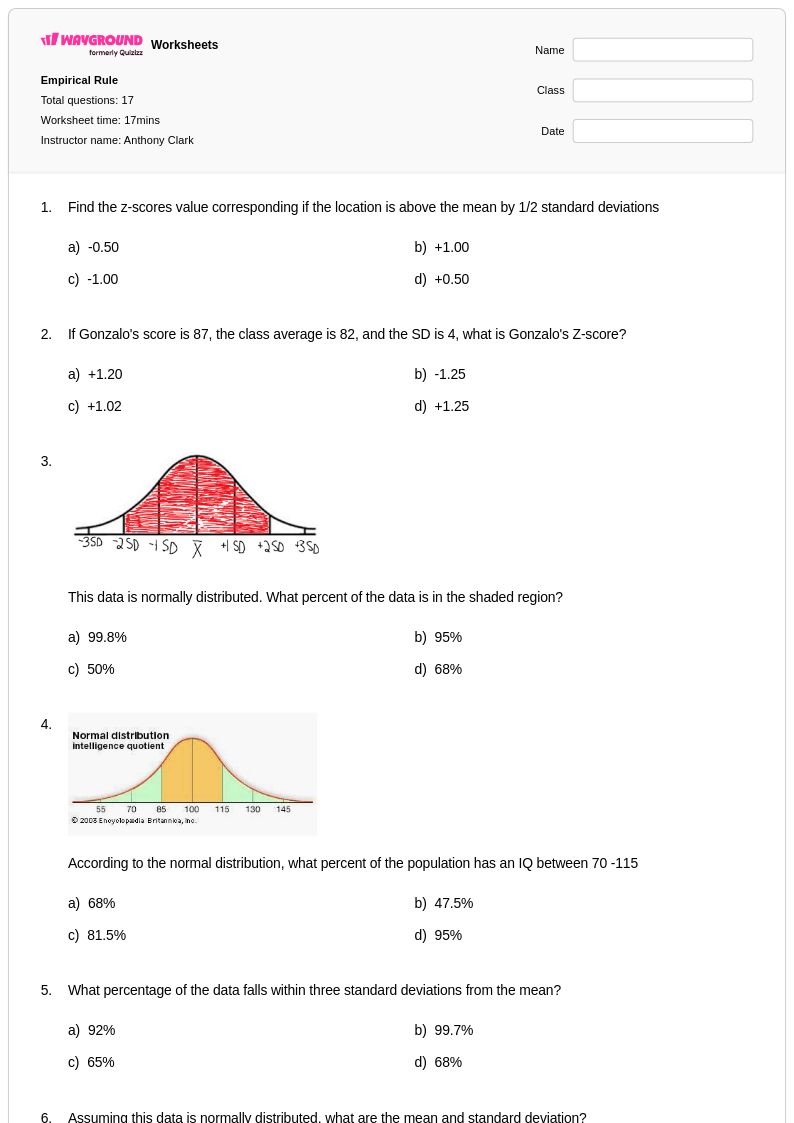
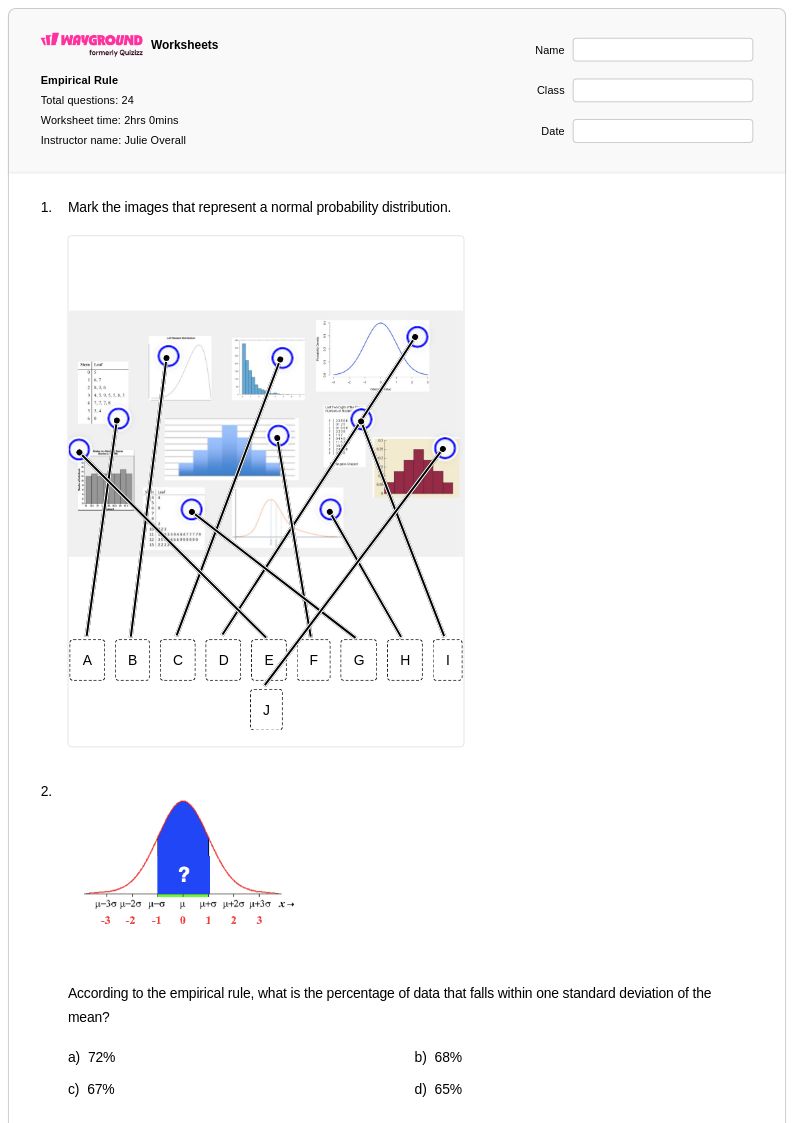
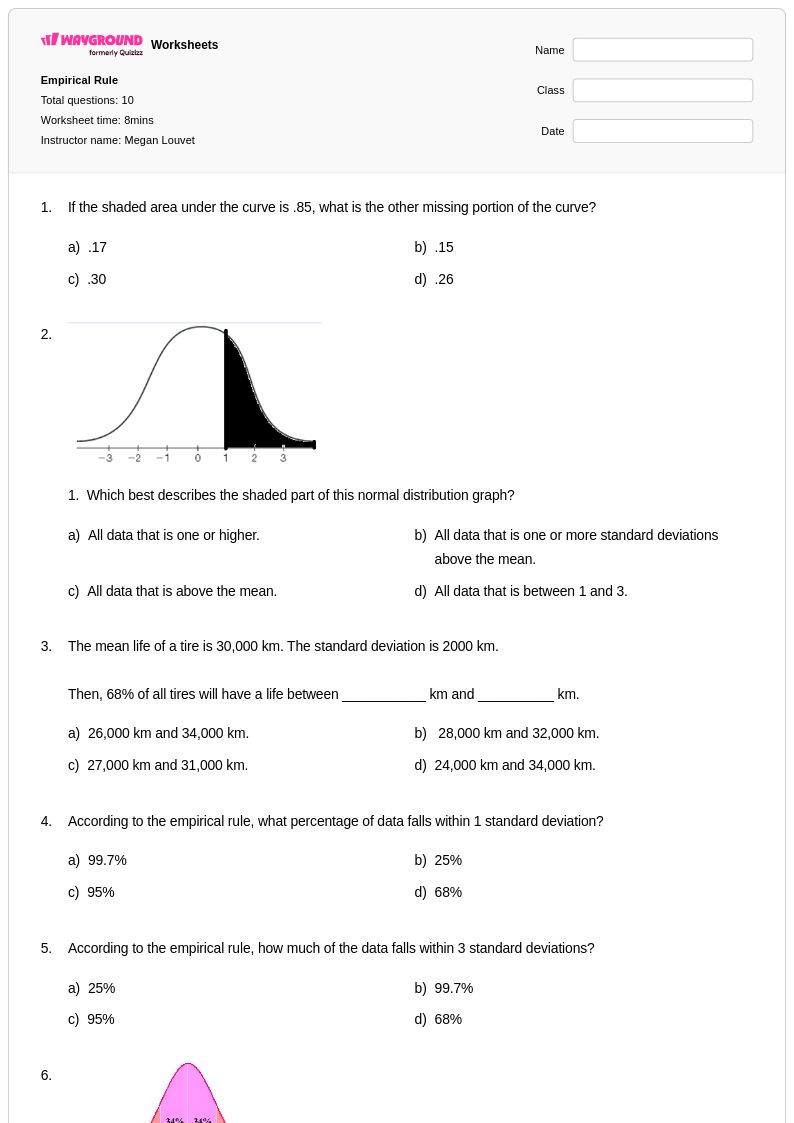
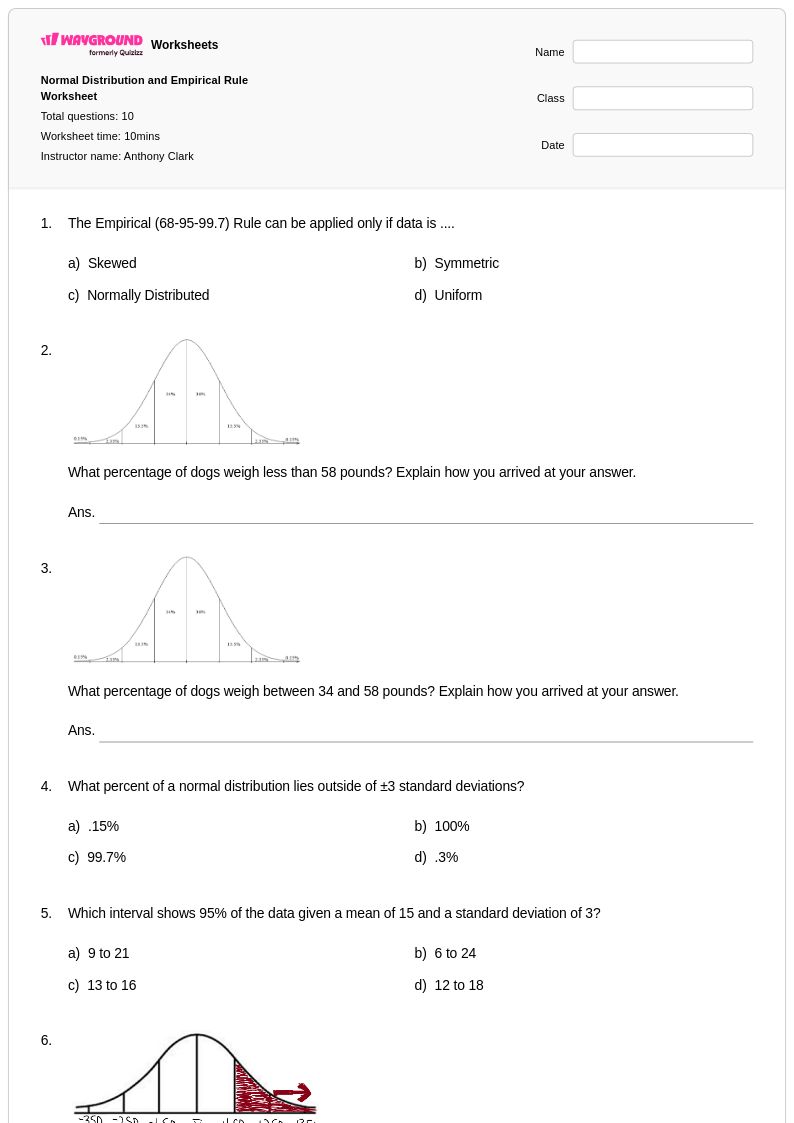
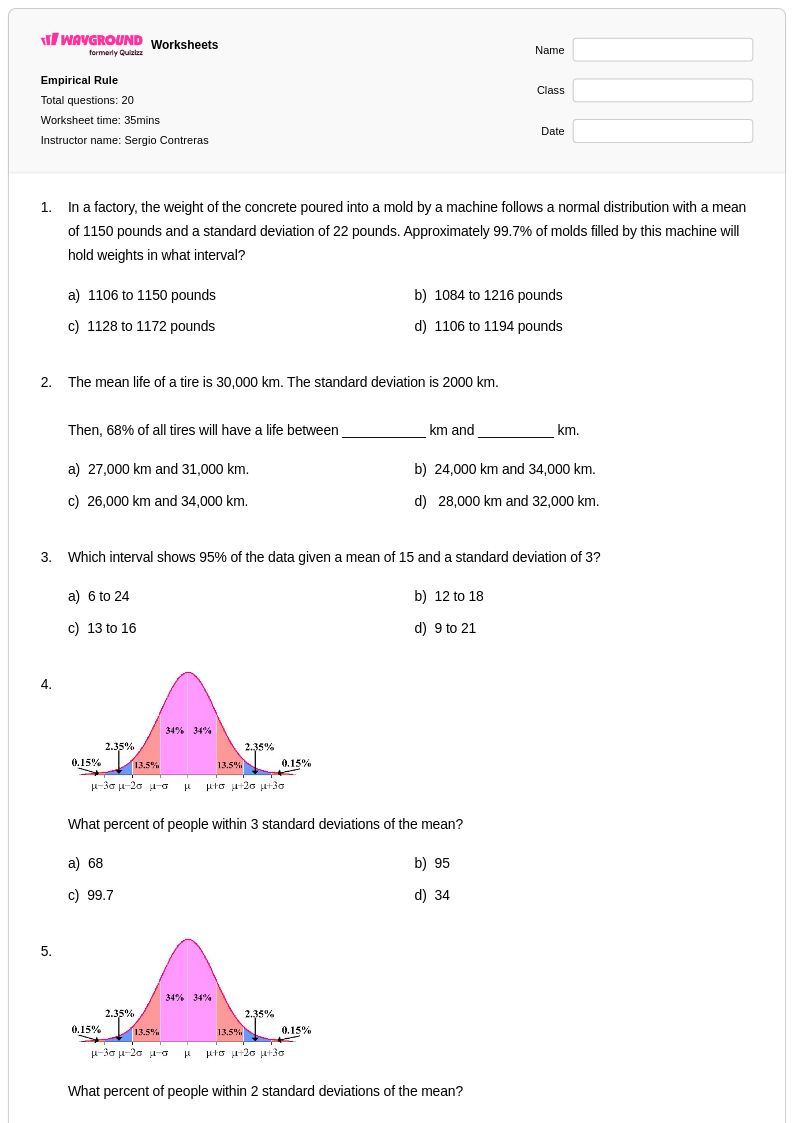
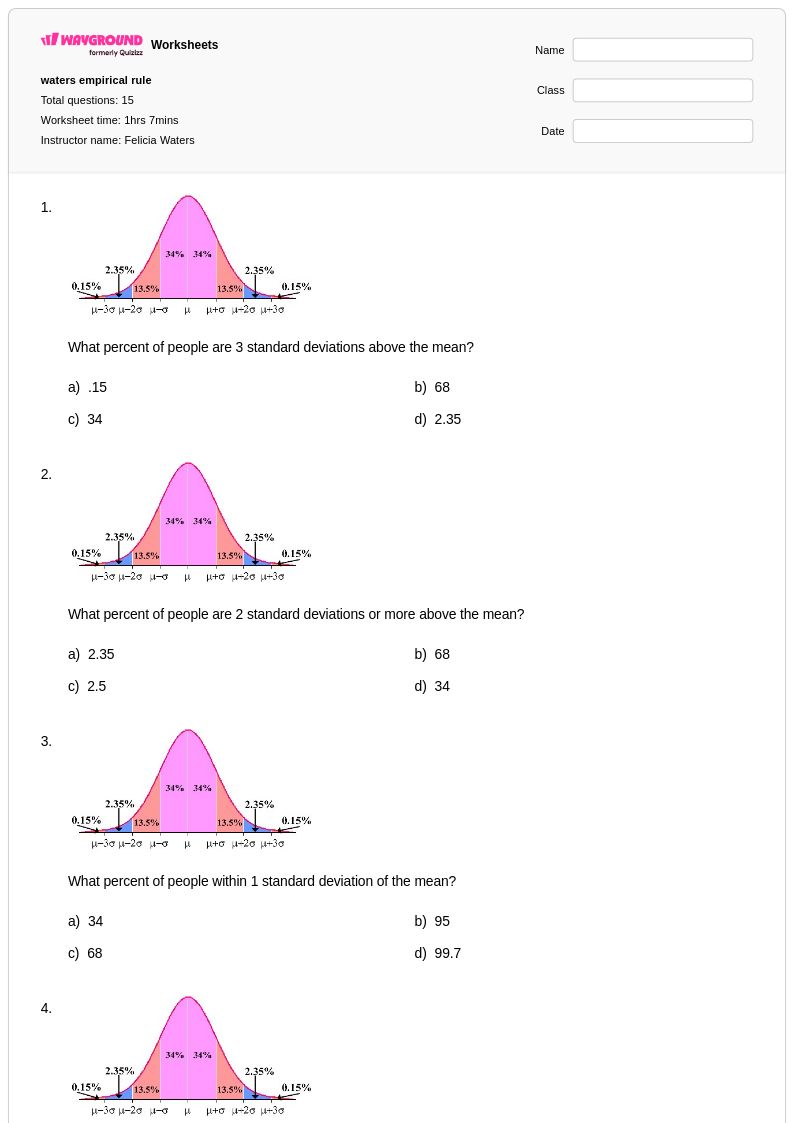
Master the Empirical Rule with Wayground's comprehensive collection of free worksheets and printables, featuring practice problems and answer keys to help students understand normal distribution patterns in statistics.
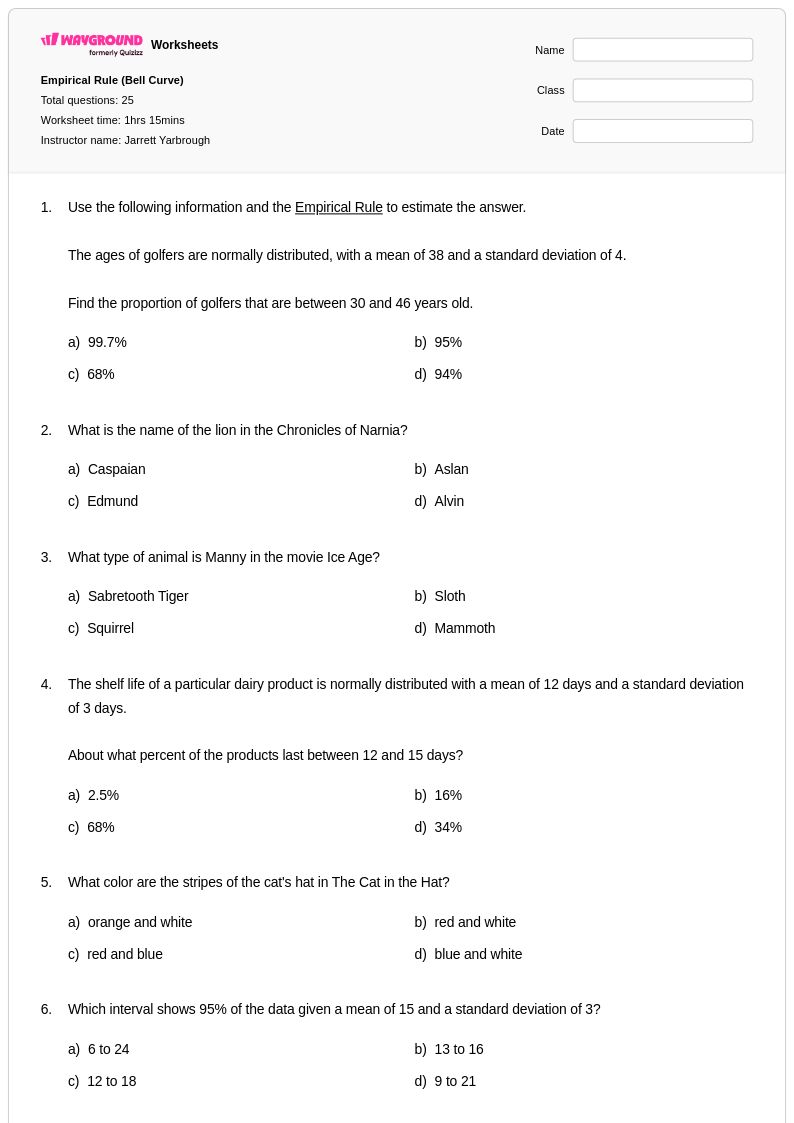
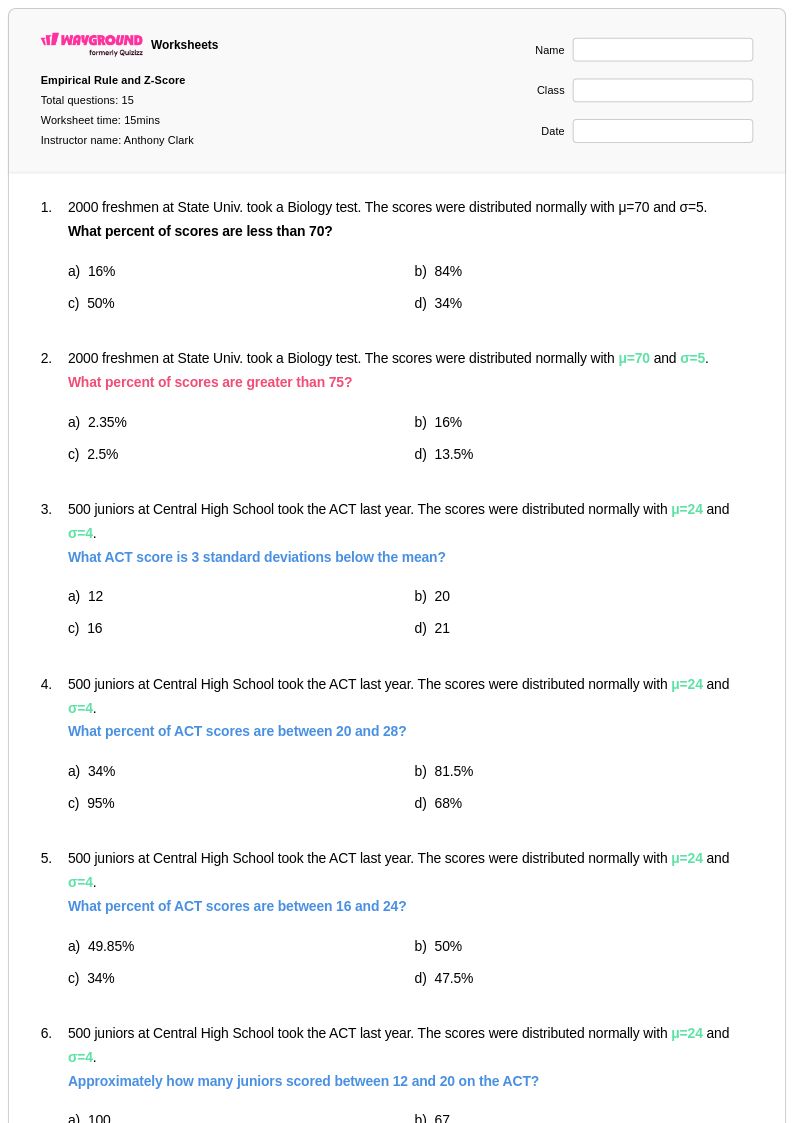
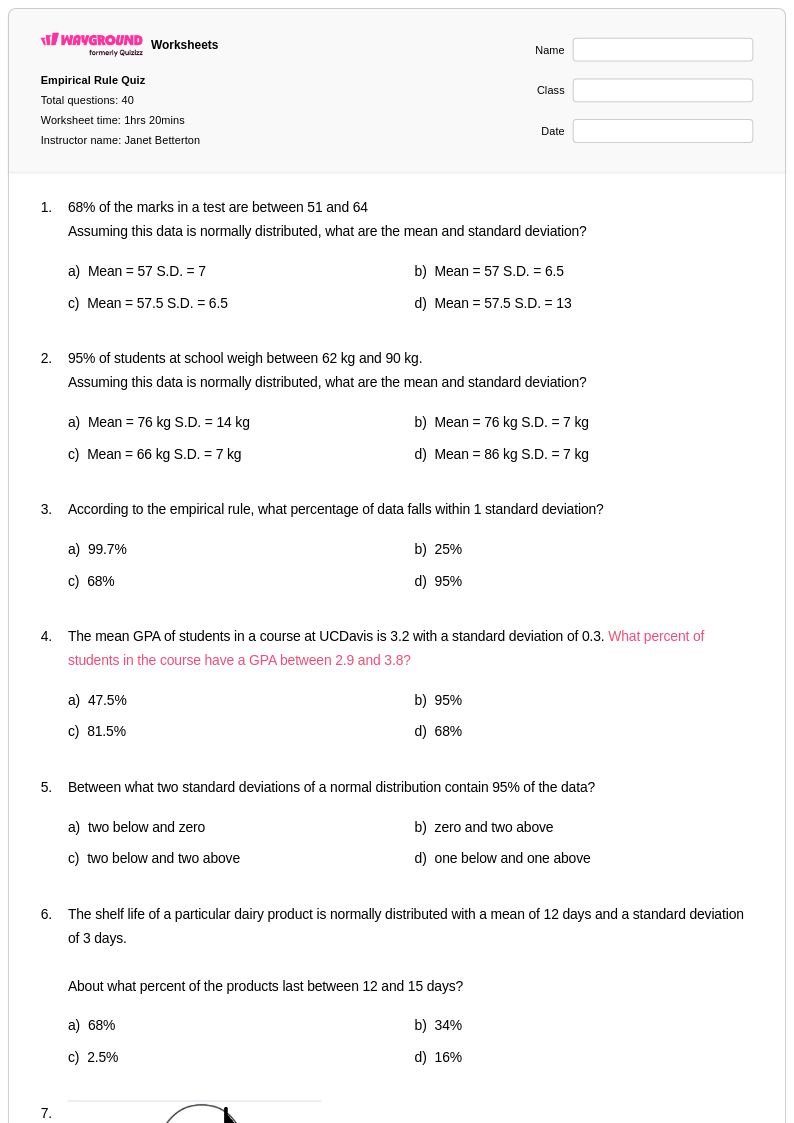
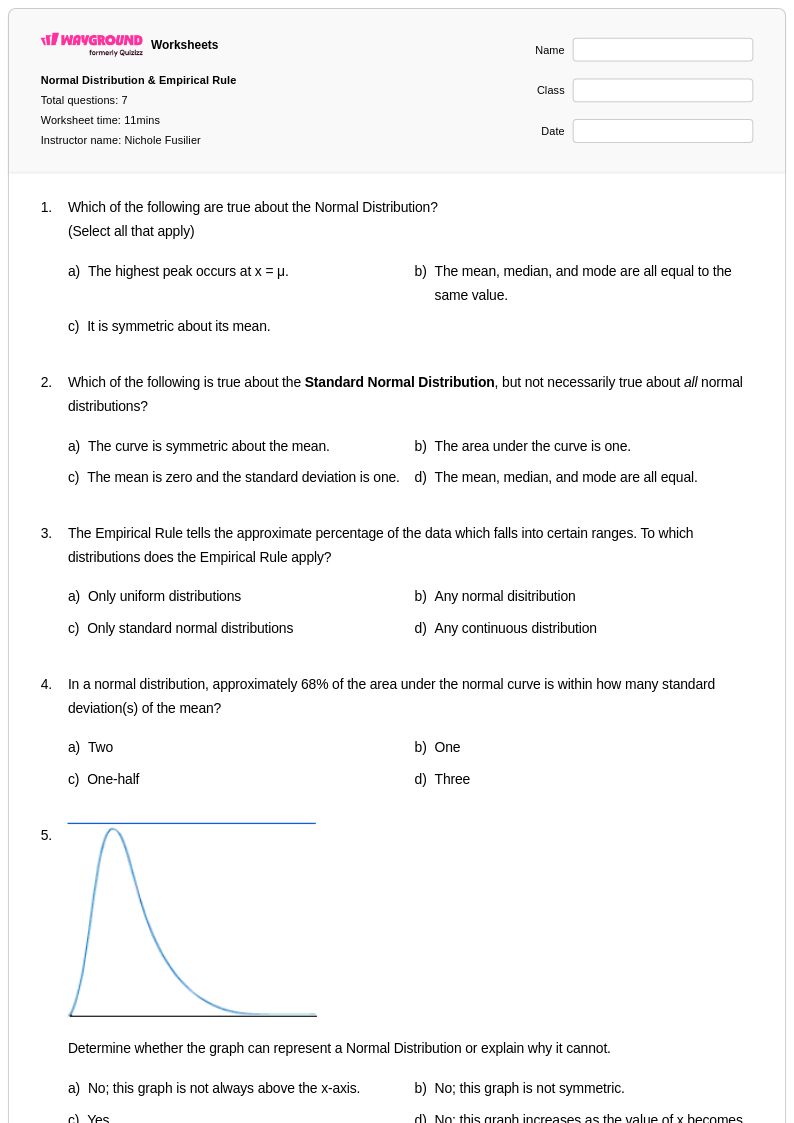
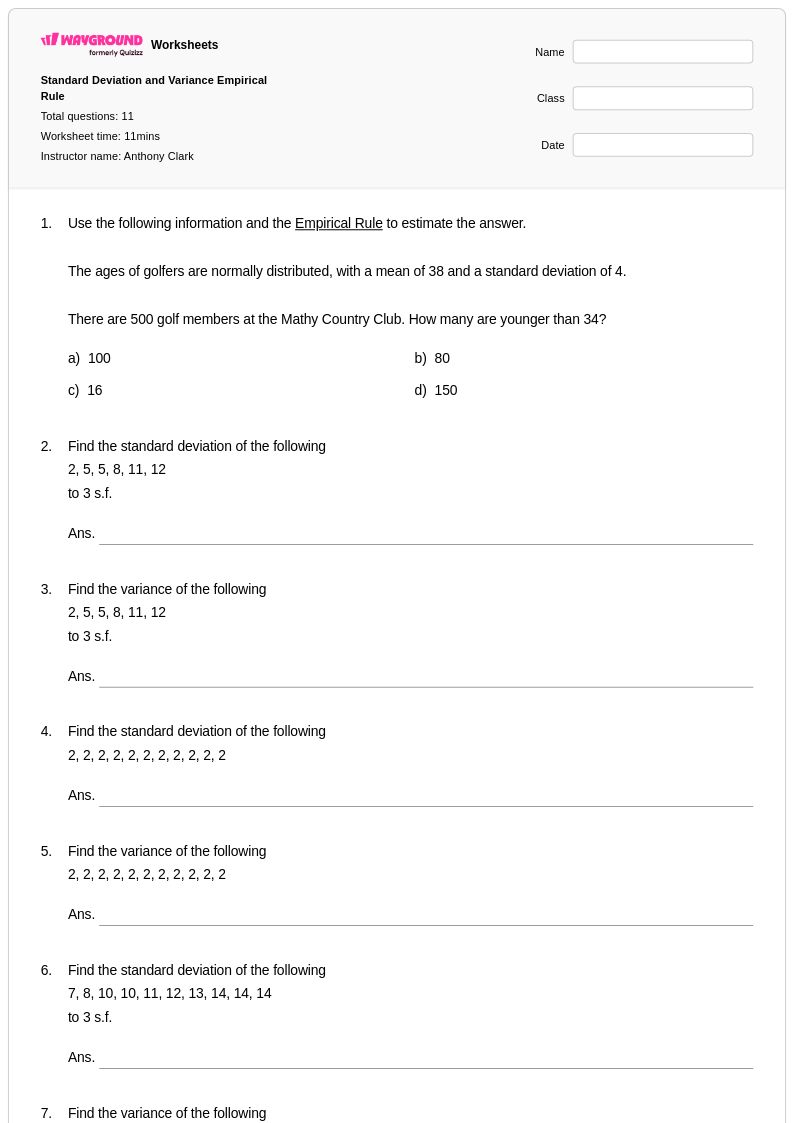
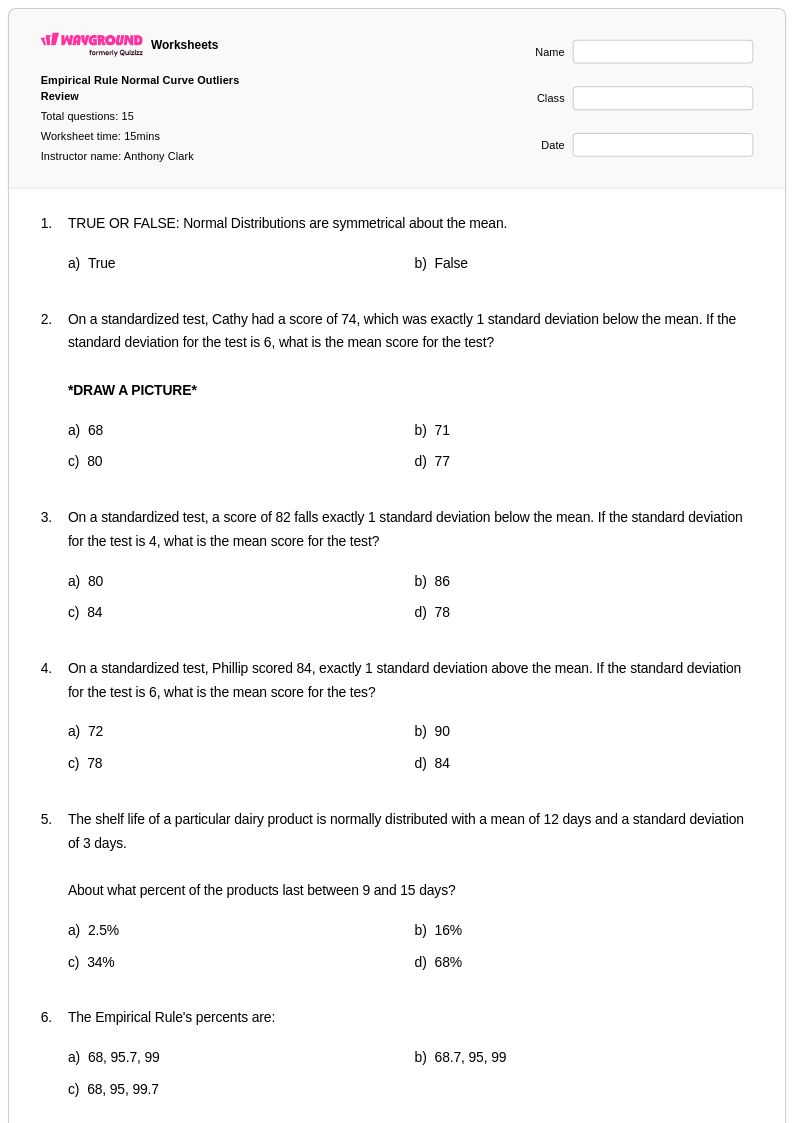
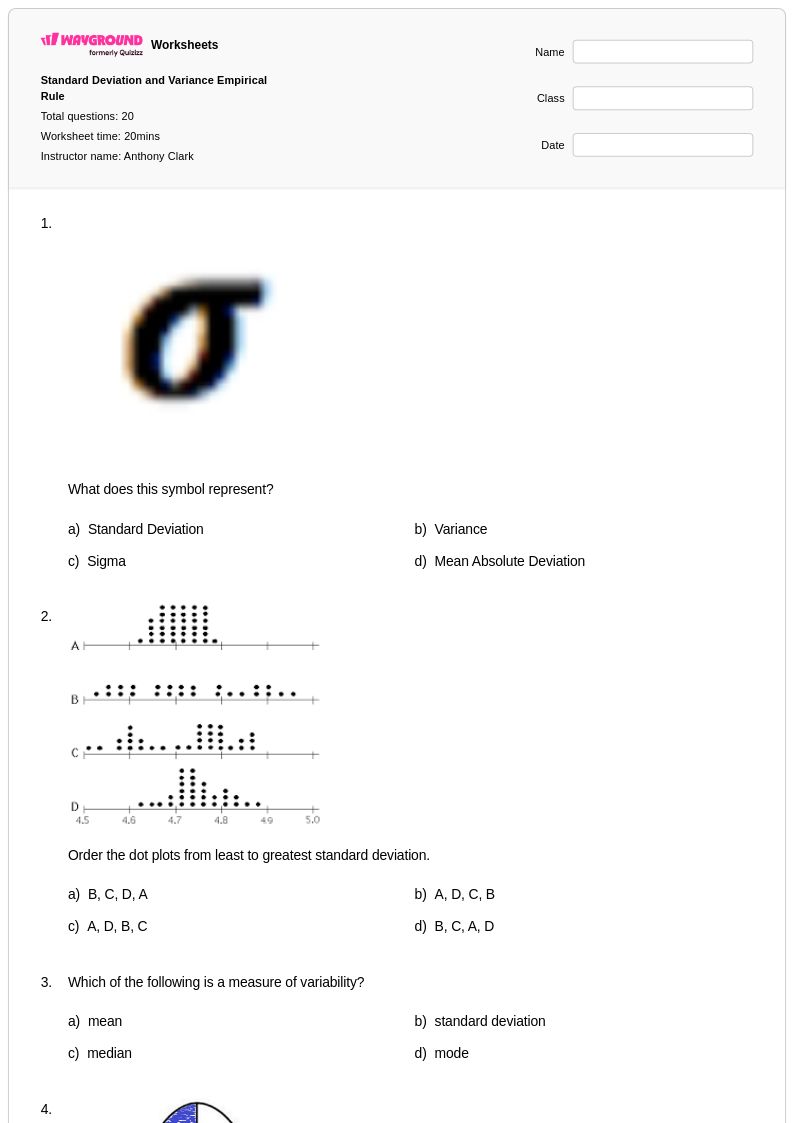
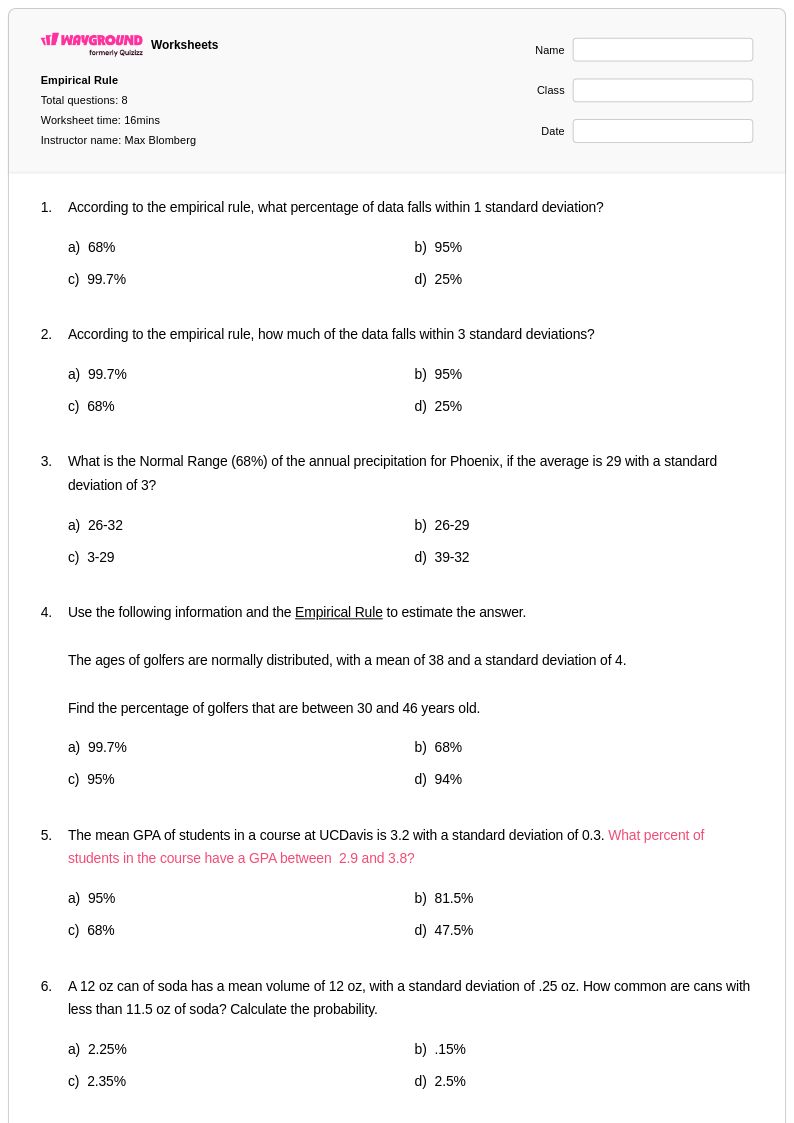
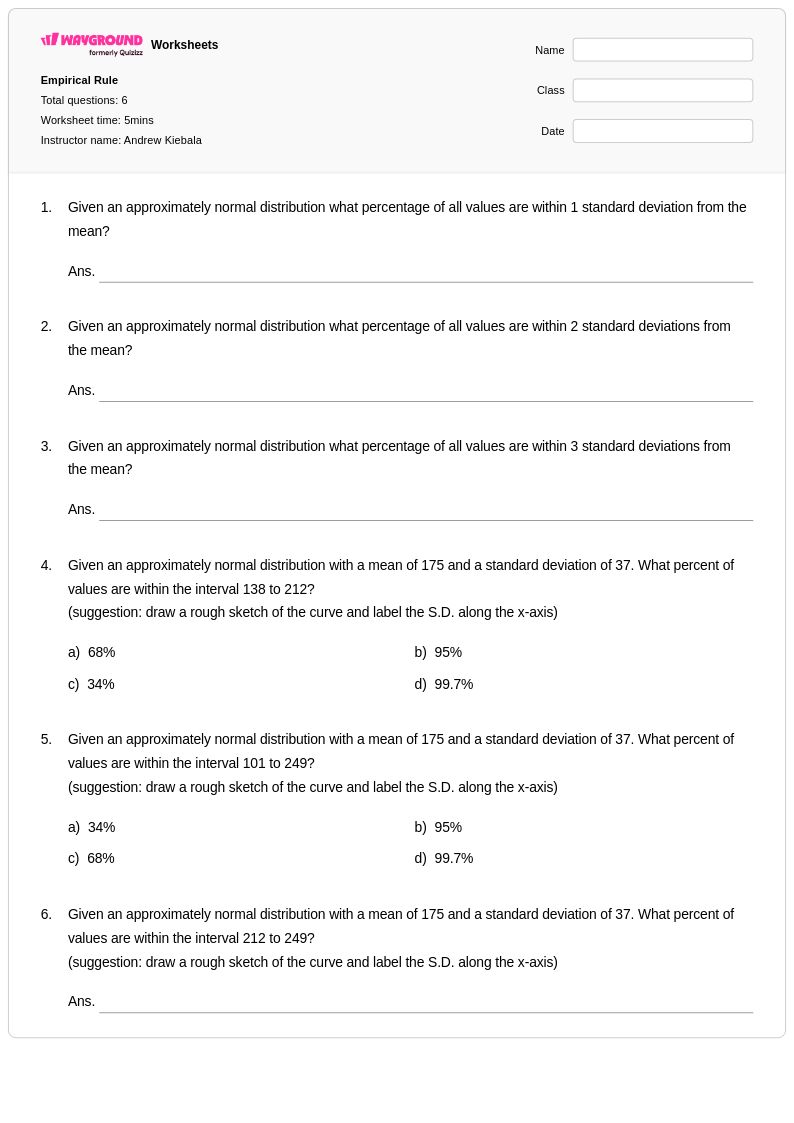
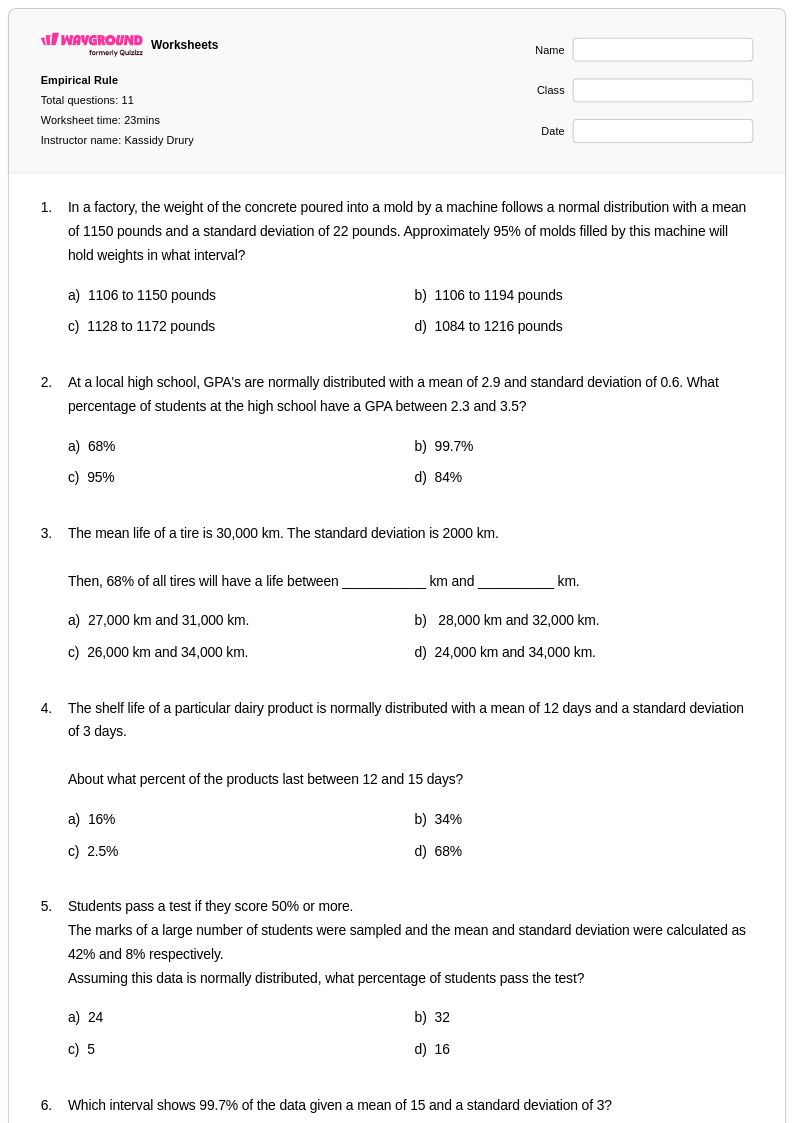
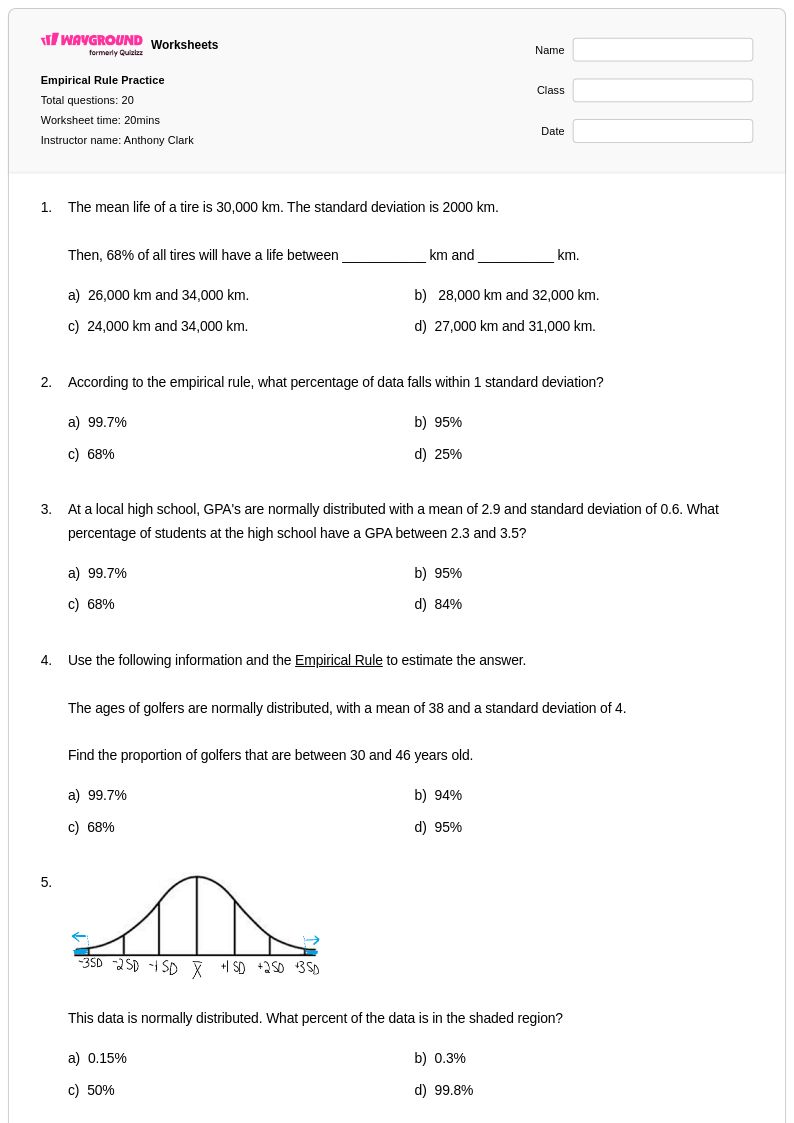
Empirical Rule worksheets available through Wayground (formerly Quizizz) provide comprehensive practice opportunities for students to master this fundamental concept in probability and statistics. These carefully designed resources focus on the 68-95-99.7 rule, helping students understand how data distributes within one, two, and three standard deviations of the mean in normal distributions. The worksheets strengthen critical analytical skills through varied practice problems that require students to calculate percentages of data within specific ranges, interpret bell curve diagrams, and apply the empirical rule to real-world scenarios. Each worksheet collection includes detailed answer keys and is available as free printables in convenient pdf format, enabling students to work through problems systematically while building confidence in statistical reasoning and data interpretation.
Wayground (formerly Quizizz) empowers educators with an extensive library of millions of teacher-created empirical rule resources that streamline lesson planning and enhance statistical instruction. The platform's robust search and filtering capabilities allow teachers to quickly locate worksheets aligned with specific curriculum standards and learning objectives, while built-in differentiation tools enable customization for diverse student needs and ability levels. These empirical rule materials are available in both printable and digital formats, including downloadable pdfs, providing maximum flexibility for classroom implementation, homework assignments, and independent study. Teachers can effectively utilize these resources for targeted skill practice, remediation support for struggling learners, and enrichment opportunities for advanced students, ensuring comprehensive coverage of this essential statistical concept across all learning environments.
FAQs
How do I teach the empirical rule to students?
Start with a concrete dataset students already care about — heights, test scores, or reaction times — and build the bell curve from their own data before introducing the 68-95-99.7 percentages. Once students can see that most values cluster near the mean and fewer appear at the extremes, the rule stops feeling arbitrary. From there, move to labeled diagrams where students shade regions and calculate percentages, then progress to problems where the mean and standard deviation are given and students must determine what falls within each interval.
What kinds of practice problems help students master the empirical rule?
The most effective practice moves through three levels: reading a bell curve diagram and identifying which interval a value falls in, calculating the percentage of a dataset within a given range when the mean and standard deviation are provided, and applying the rule to real-world contexts like standardized test scores or quality control measurements. Wayground's empirical rule worksheets cover all three levels, so teachers can assign problems that match where students currently are rather than starting everyone from scratch.
What mistakes do students commonly make with the empirical rule?
Two errors come up constantly. First, students confuse the percentage within an interval with the percentage in one tail — they'll say 68% of data is above one standard deviation rather than within one standard deviation on both sides. Second, they misread the rule as exact rather than approximate, which causes confusion when real datasets don't match perfectly. Asking students to explain why a dataset with 70% of values within one standard deviation is still consistent with the empirical rule catches both misconceptions at once.
How do I use Wayground's empirical rule worksheets in my class?
You can run these as a digital quiz hosted on Wayground — students submit answers online and you get results immediately — or download the PDF and assign it on paper. Every worksheet includes a complete answer key, so students can self-check during independent practice. If you go the printable route, the Wayground for Teachers app lets you scan or photograph completed worksheets to grade them without manual data entry.
Is the empirical rule part of Common Core math standards?
Common Core addresses the empirical rule within its high school statistics and probability strand, where students are expected to use the mean and standard deviation of a data set to fit it to a normal distribution and estimate population percentages. The empirical rule is the practical tool that makes those estimates possible — students learn to apply the 68-95-99.7 rule before moving on to z-scores and more precise probability calculations using standard normal tables.
How can I differentiate empirical rule practice for mixed-ability classes?
For students who struggle with the abstract notation, Wayground's worksheet-level tools let you increase font size, widen line spacing, or apply a dyslexia-friendly font — small changes that reduce visual load on a diagram-heavy topic. For students who need more processing time on multi-step problems, the digital version supports per-student extended time settings. Students who need neither accommodation see the default version; nothing flags the difference to them.
What grade level is the empirical rule typically taught?
The empirical rule is most commonly introduced in high school statistics courses, typically grades 9–12, though some accelerated middle school programs introduce normal distributions in grades 7 or 8. It appears in both dedicated statistics courses and in the statistics and probability units of Algebra 2 or Pre-Calculus.