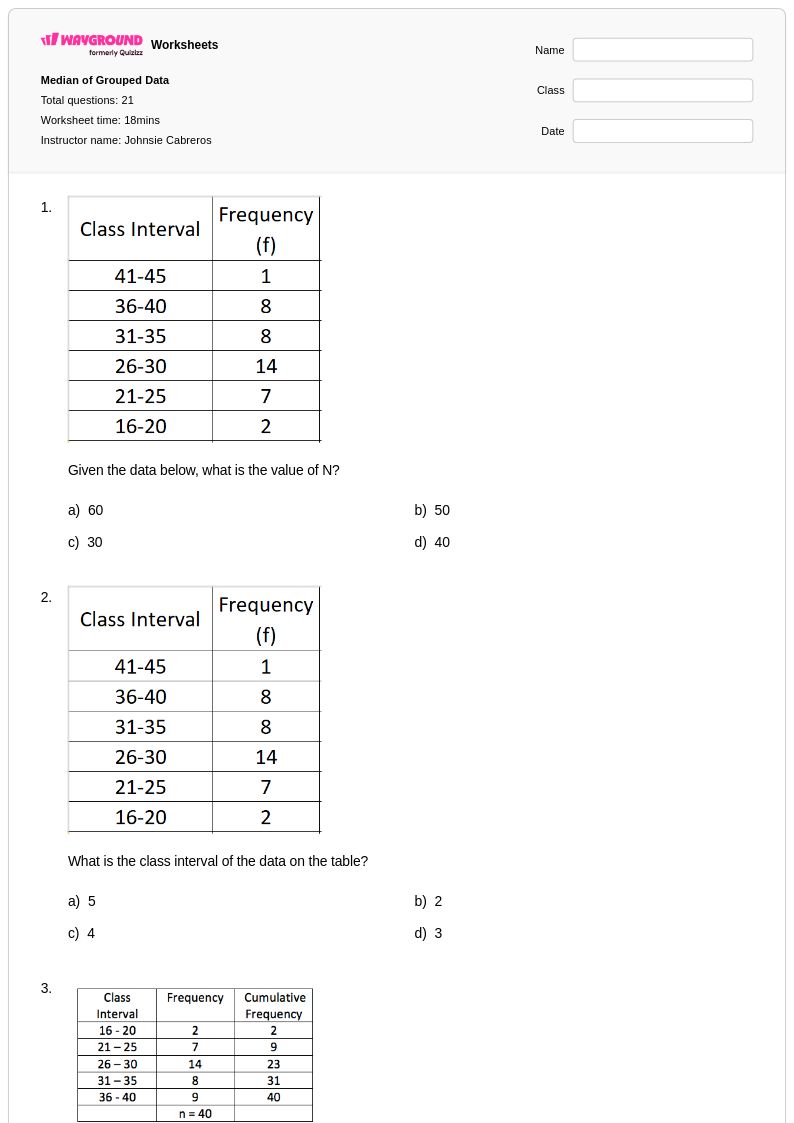
21 Q
10th
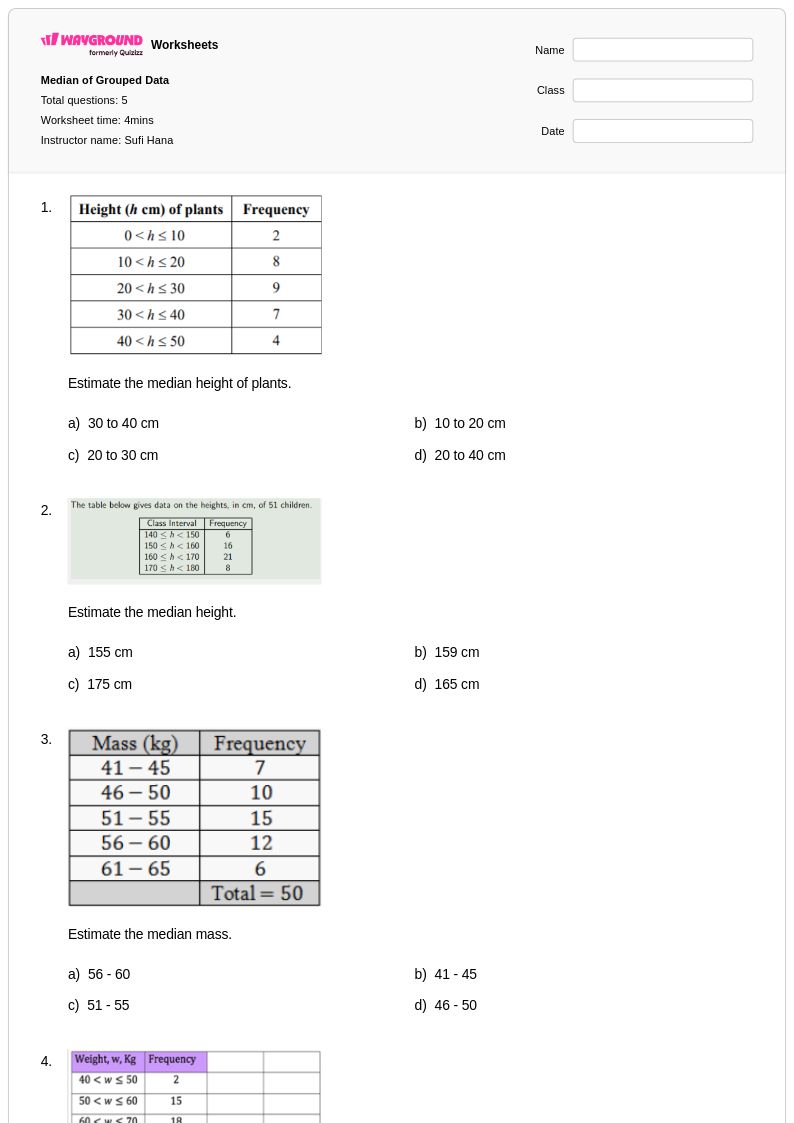
5 Q
7th - 8th
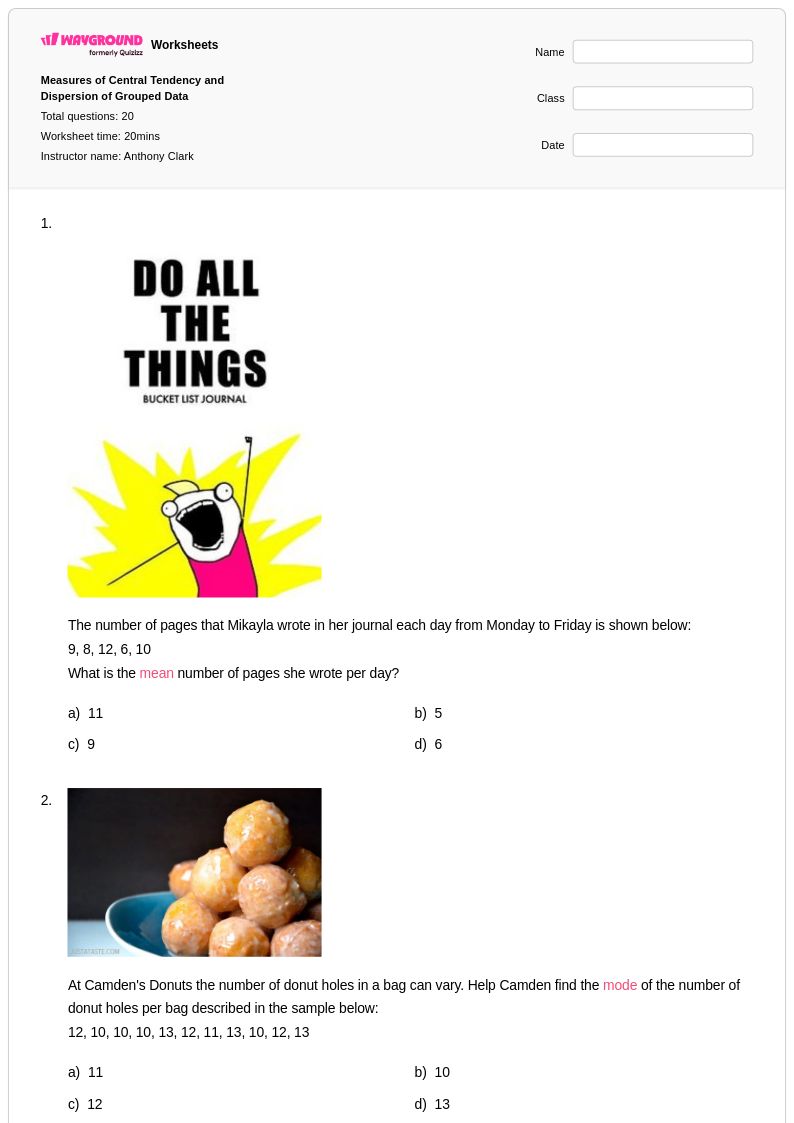
20 Q
8th - Uni
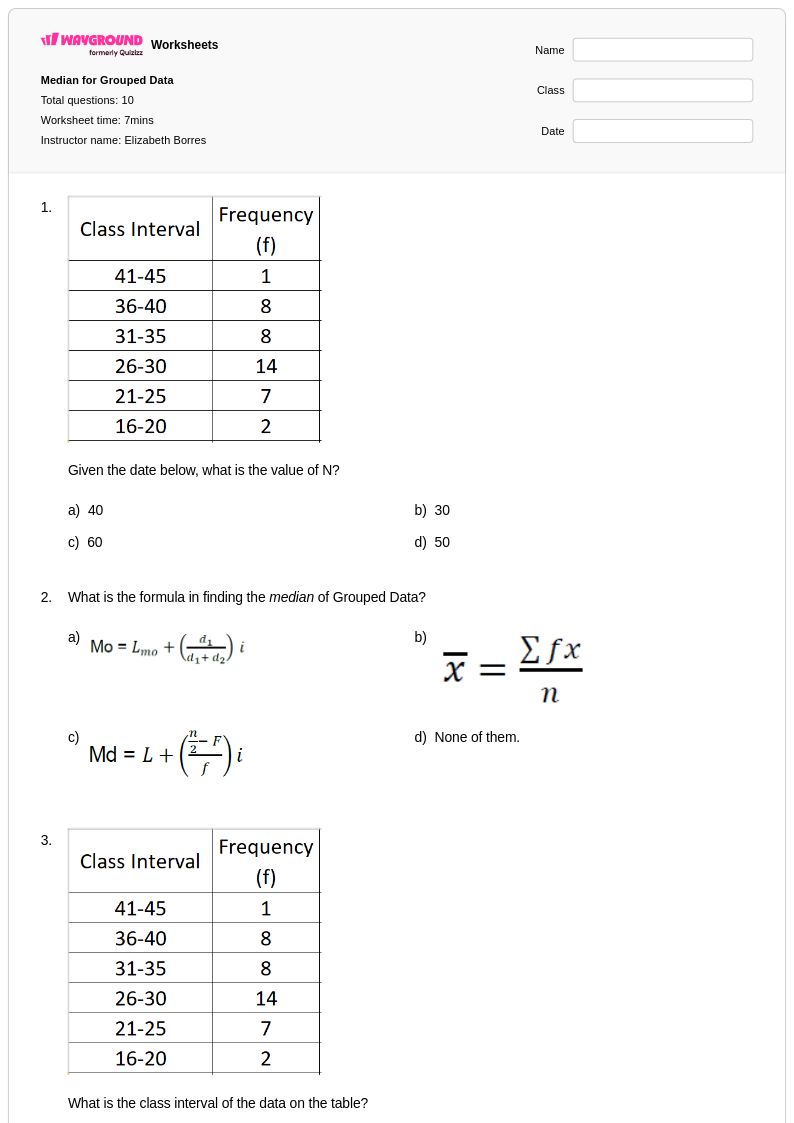
10 Q
11th - 12th
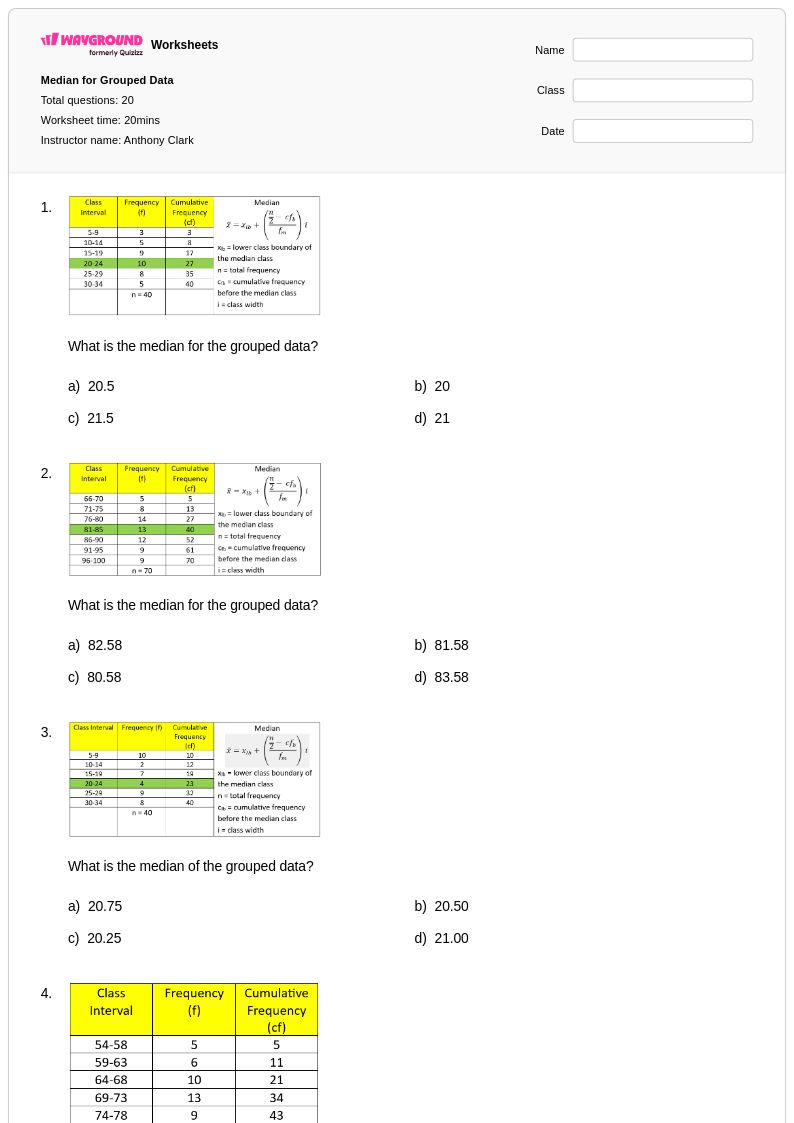
20 Q
8th - Uni
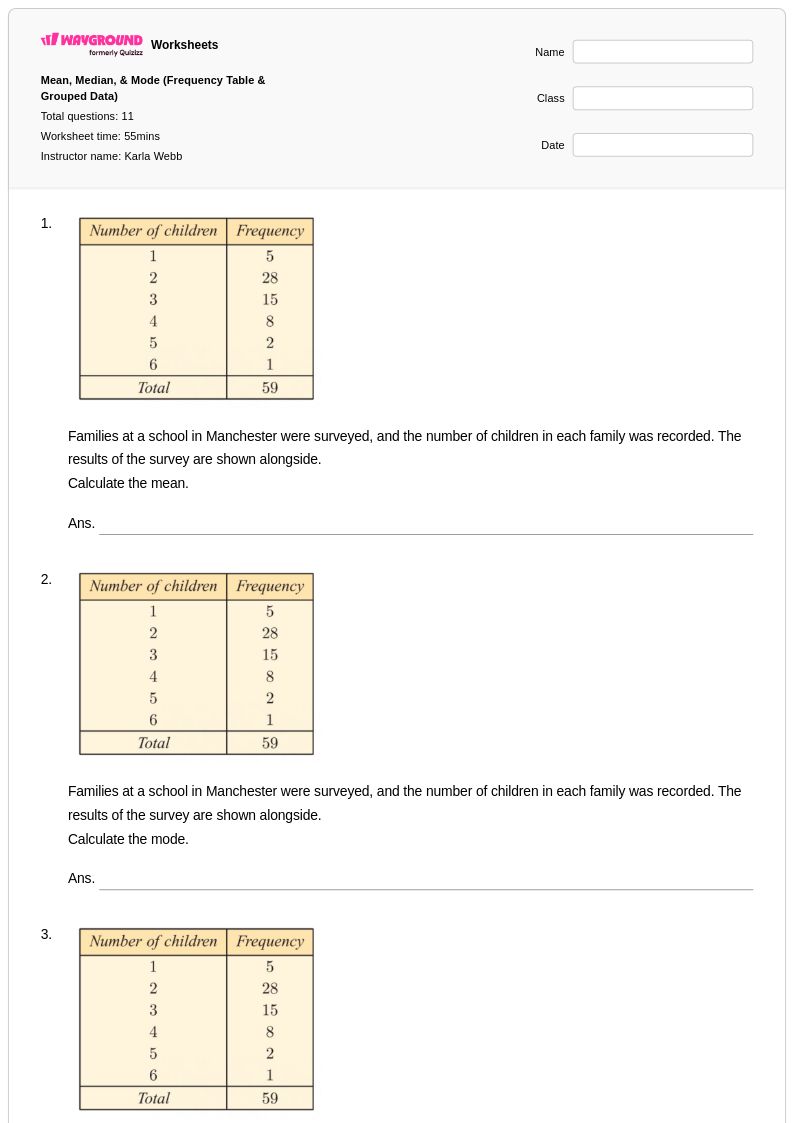
11 Q
12th
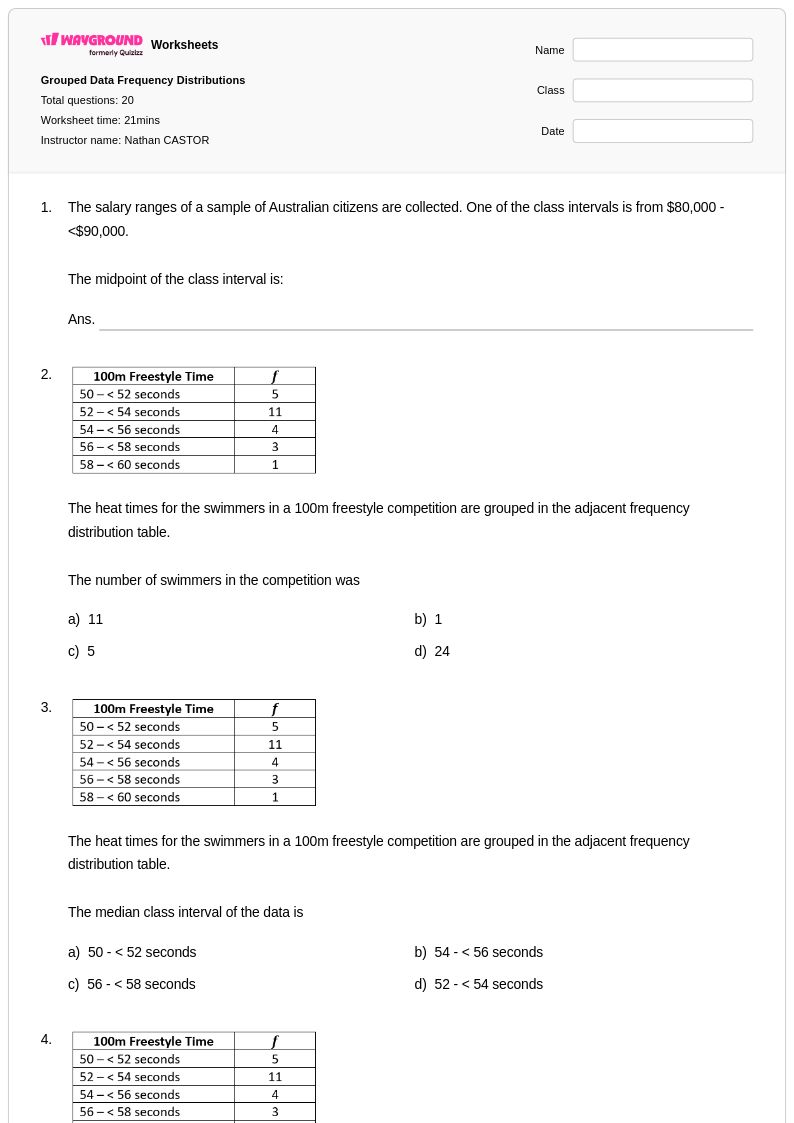
20 Q
9th
10 Q
KG - PD
20 Q
11th - Uni
10 Q
2nd
20 Q
8th - Uni
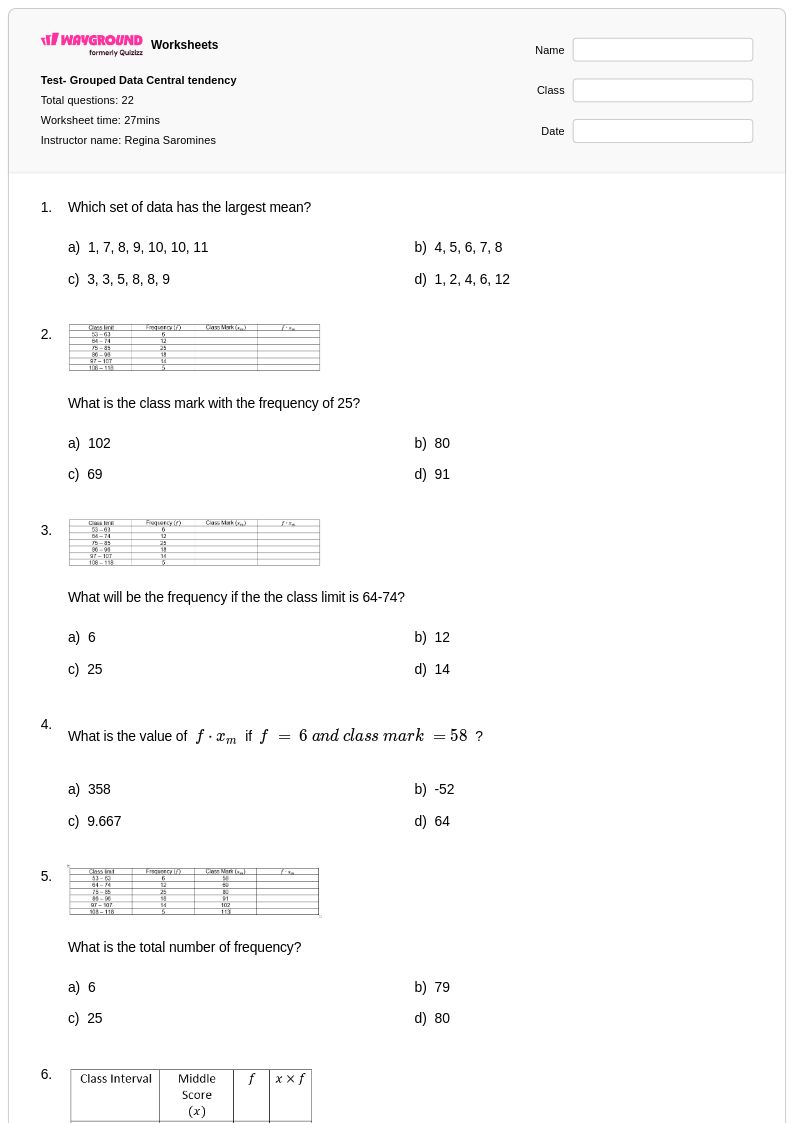
22 Q
9th - 12th
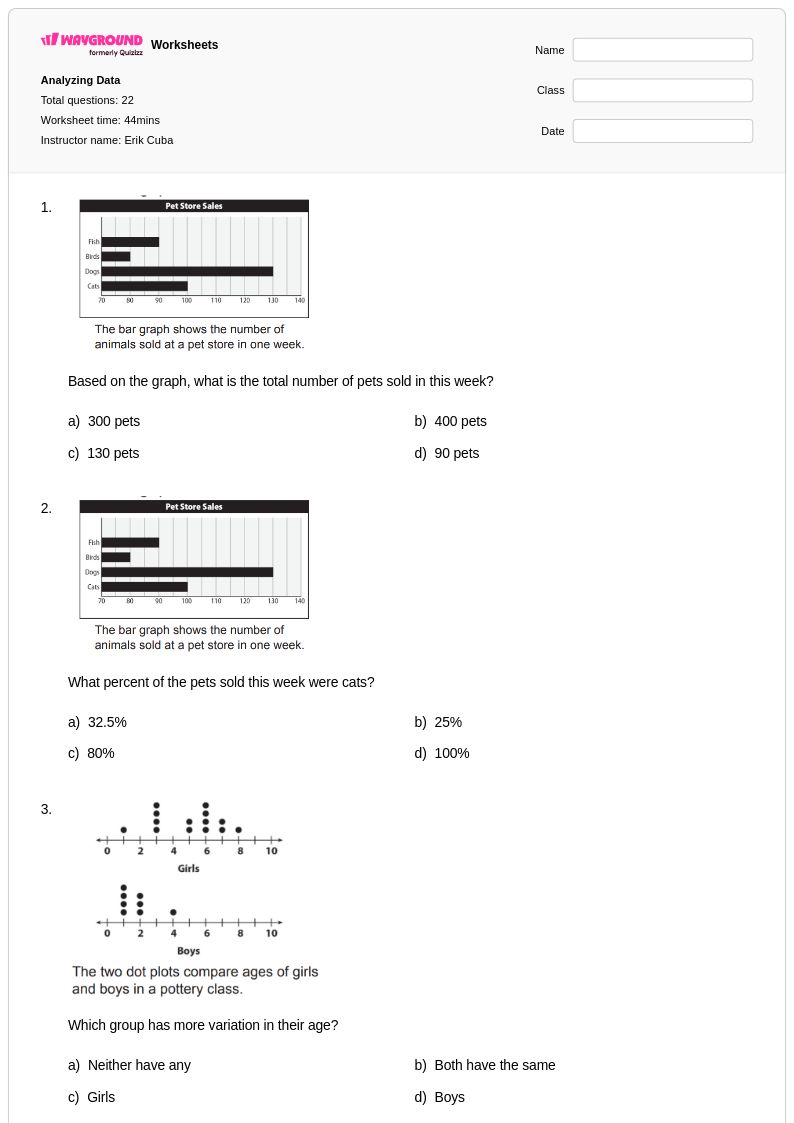
22 Q
7th
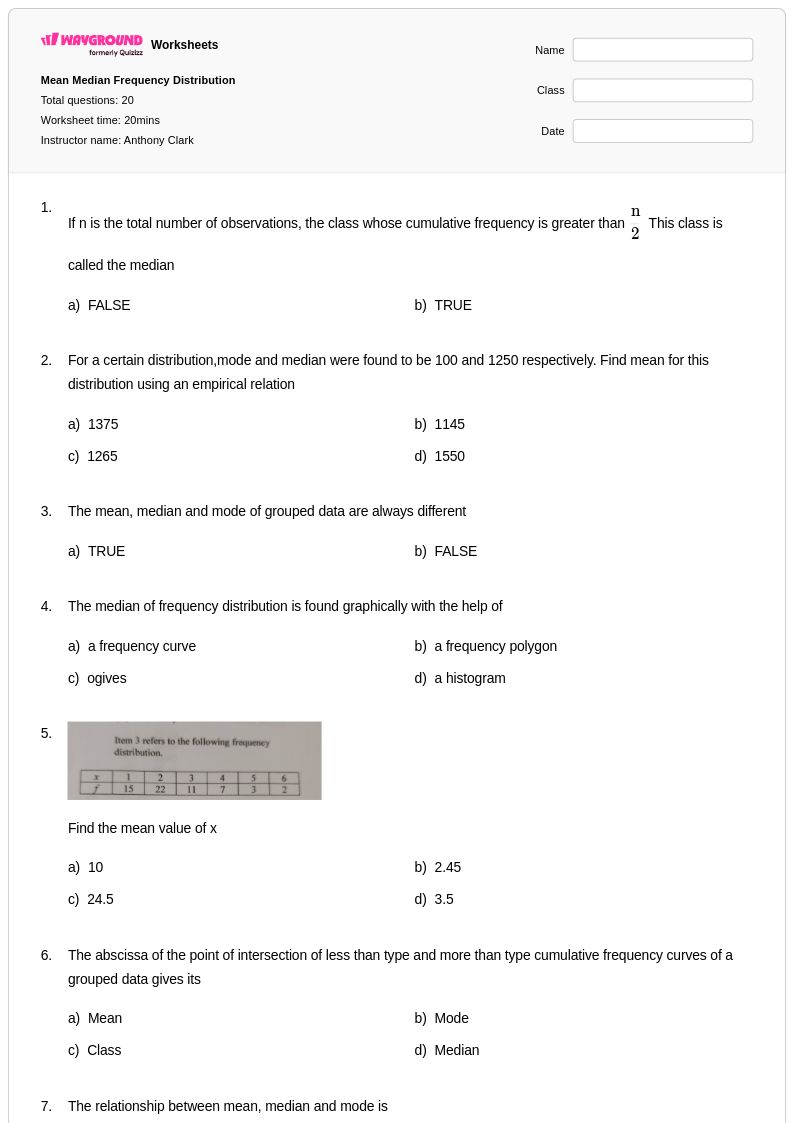
20 Q
11th - Uni
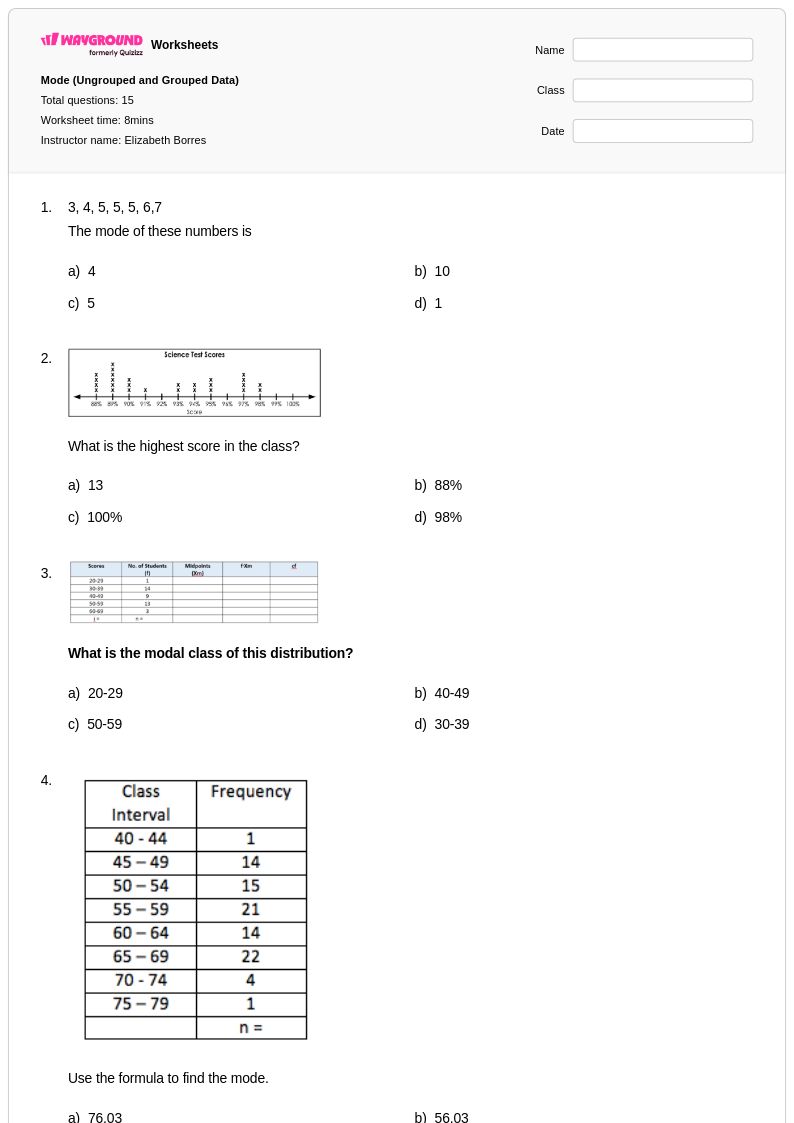
15 Q
11th - 12th
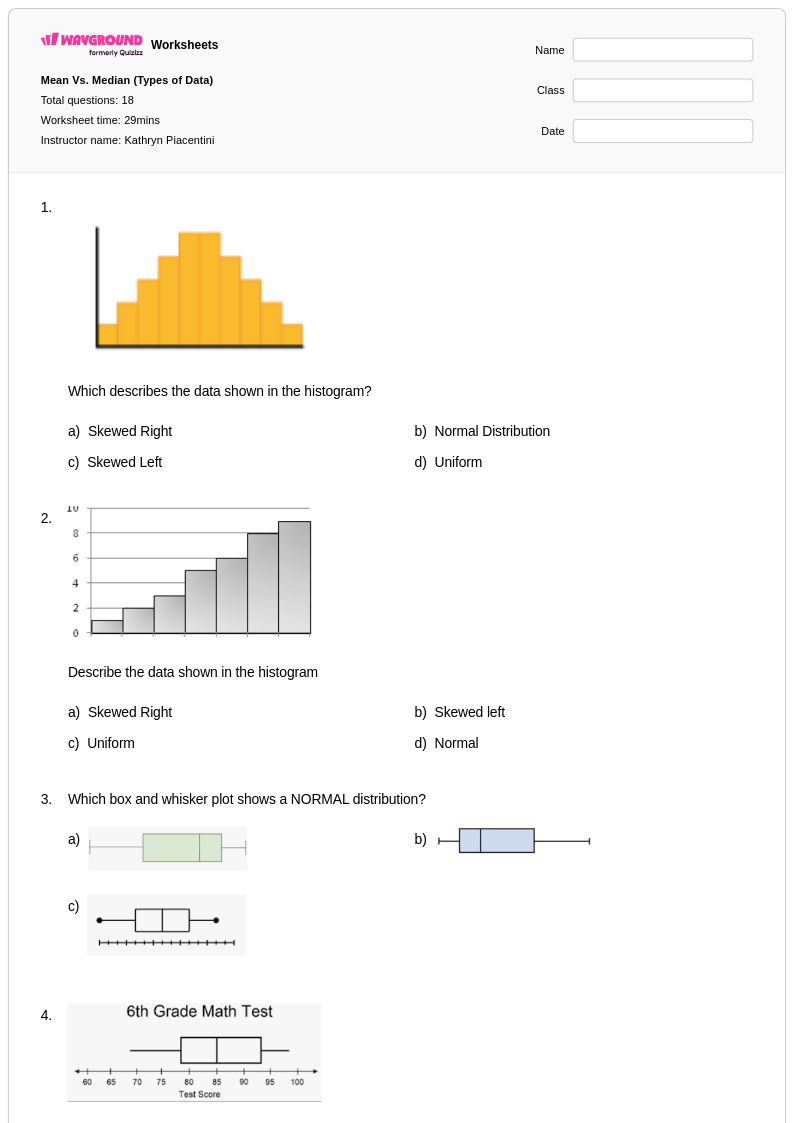
18 Q
9th - 12th
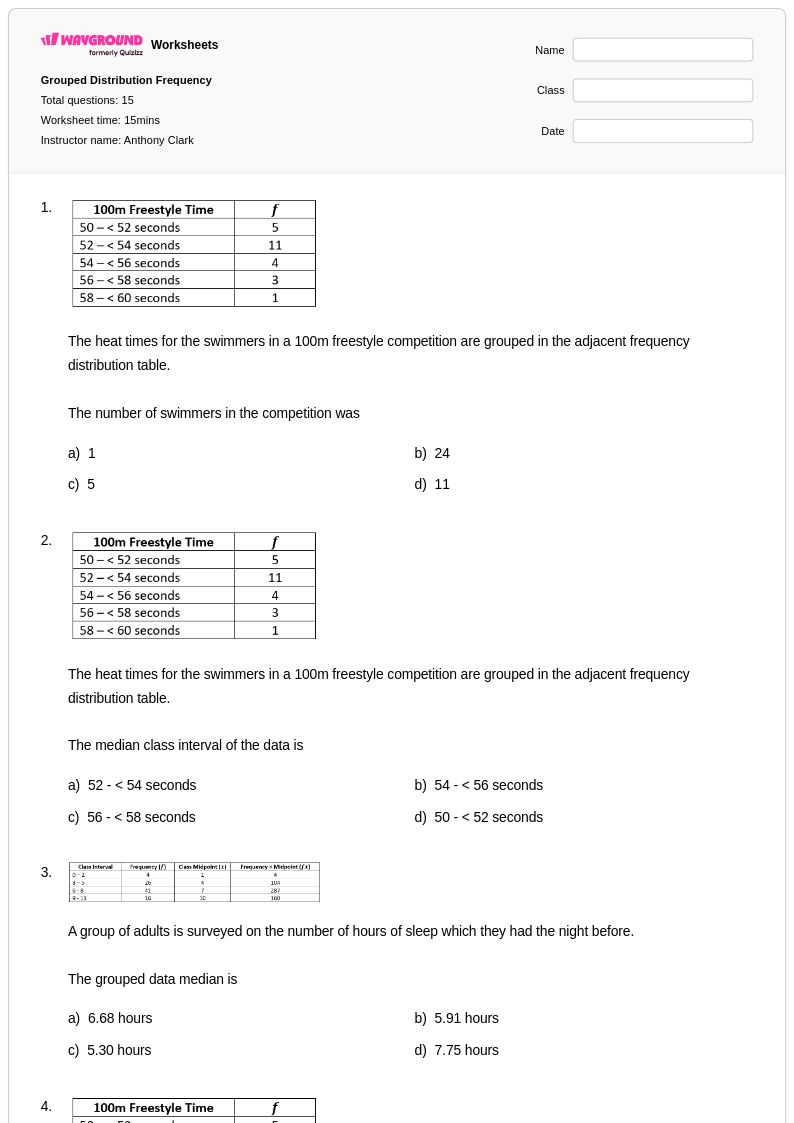
15 Q
9th - Uni
10 Q
2nd
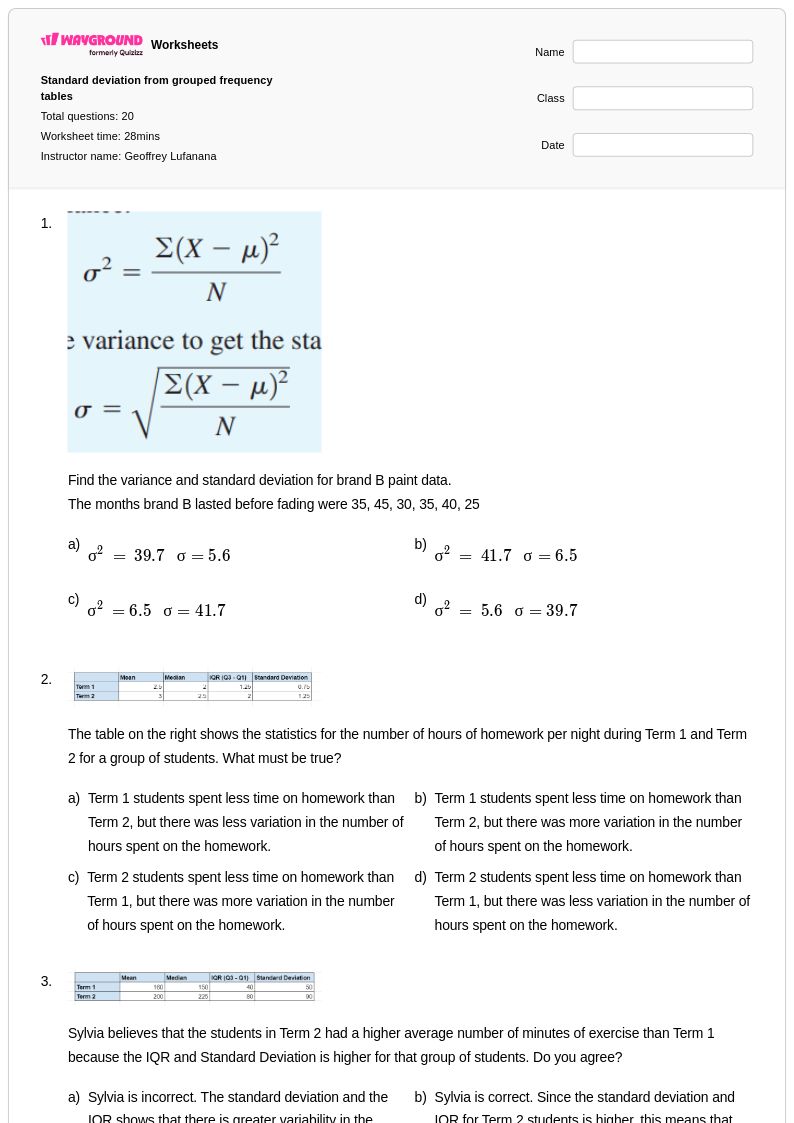
20 Q
10th
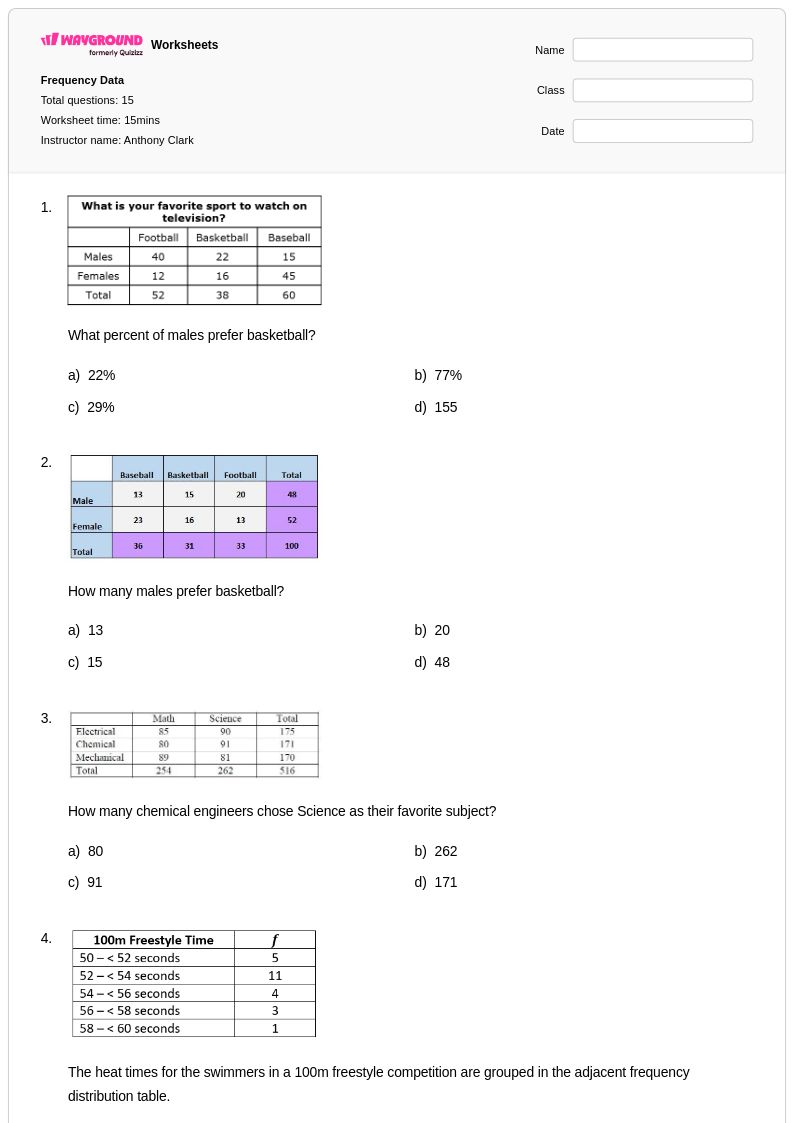
15 Q
10th - Uni
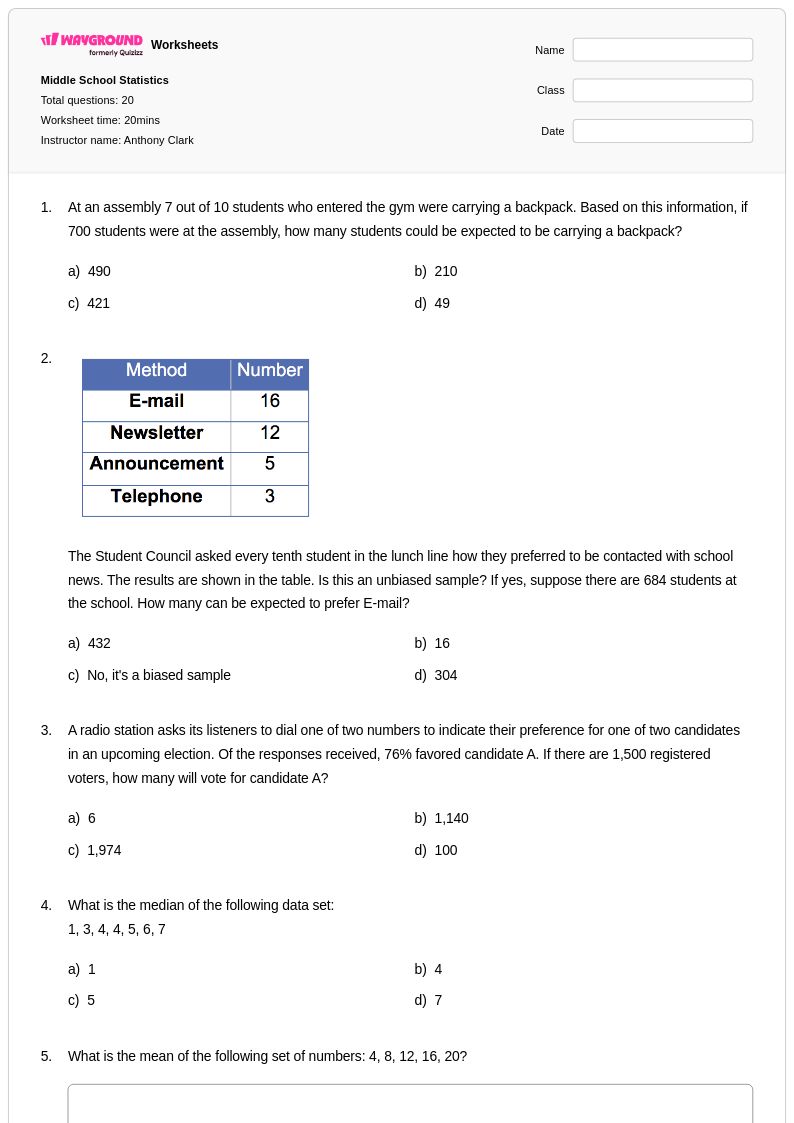
20 Q
7th - Uni
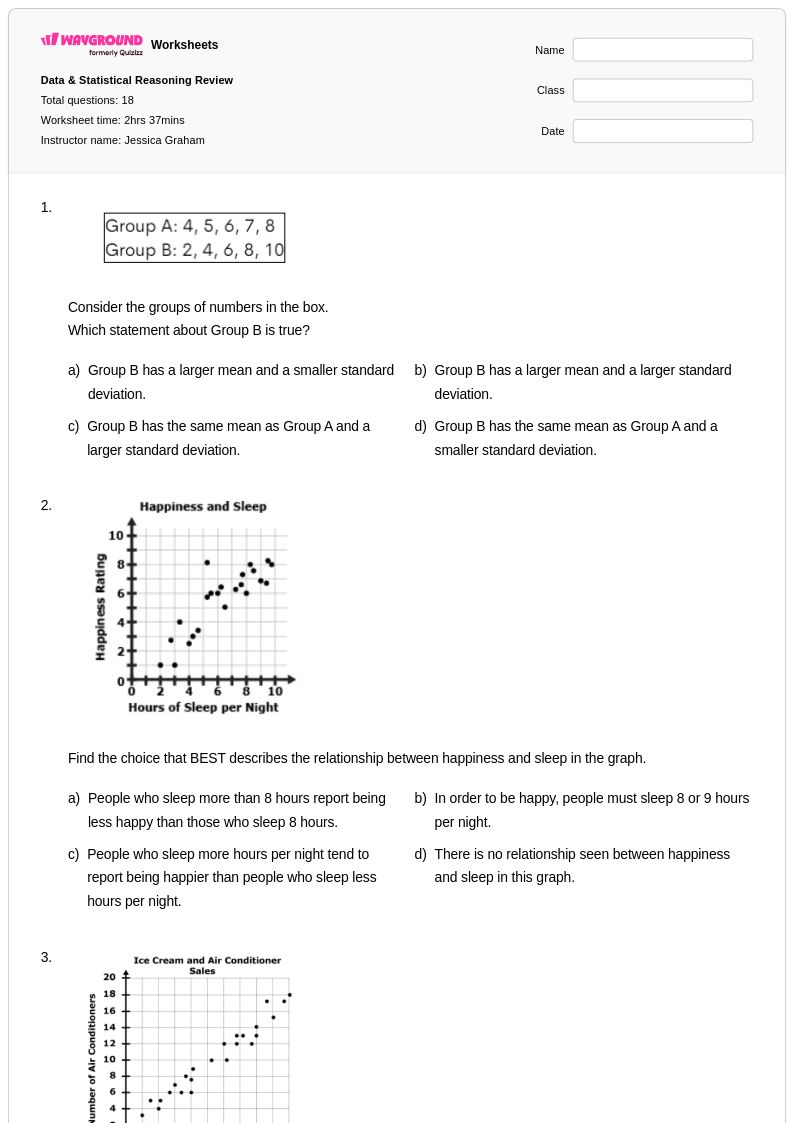
23 Q
9th
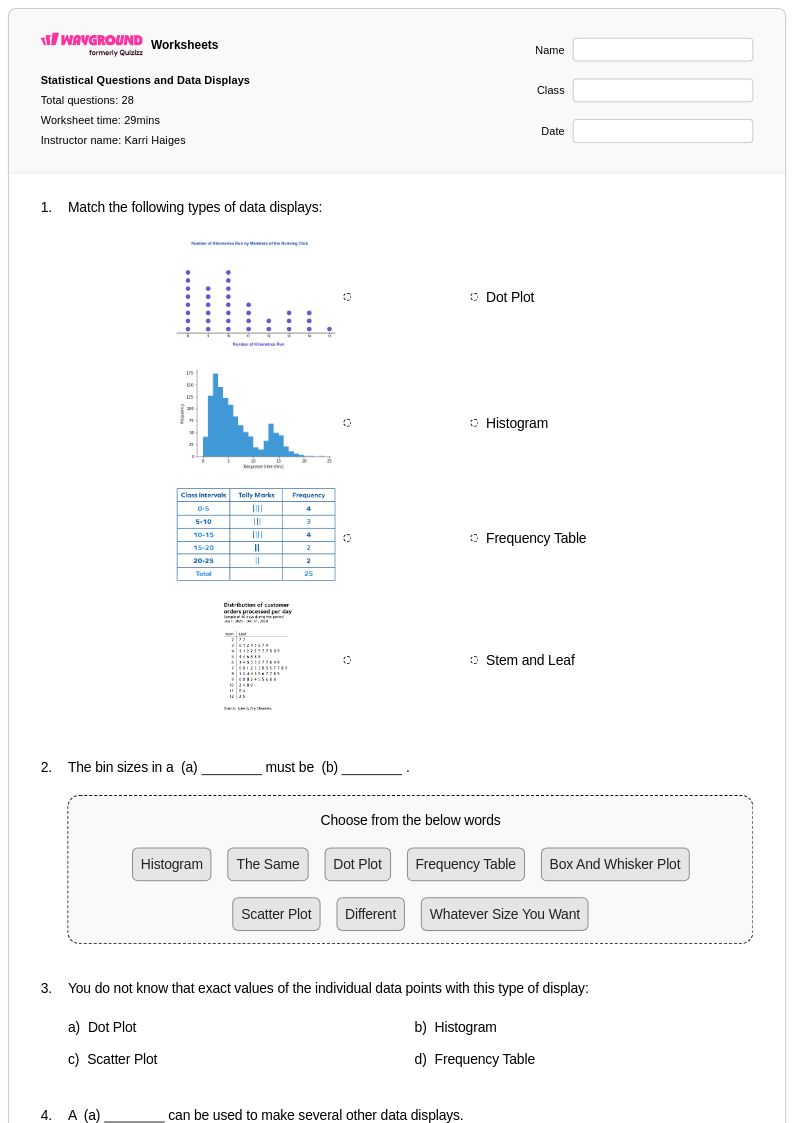
28 Q
6th - 8th
20 Q
6th - Uni
Explore Worksheets by Subjects
Explore printable Median of Grouped Data worksheets
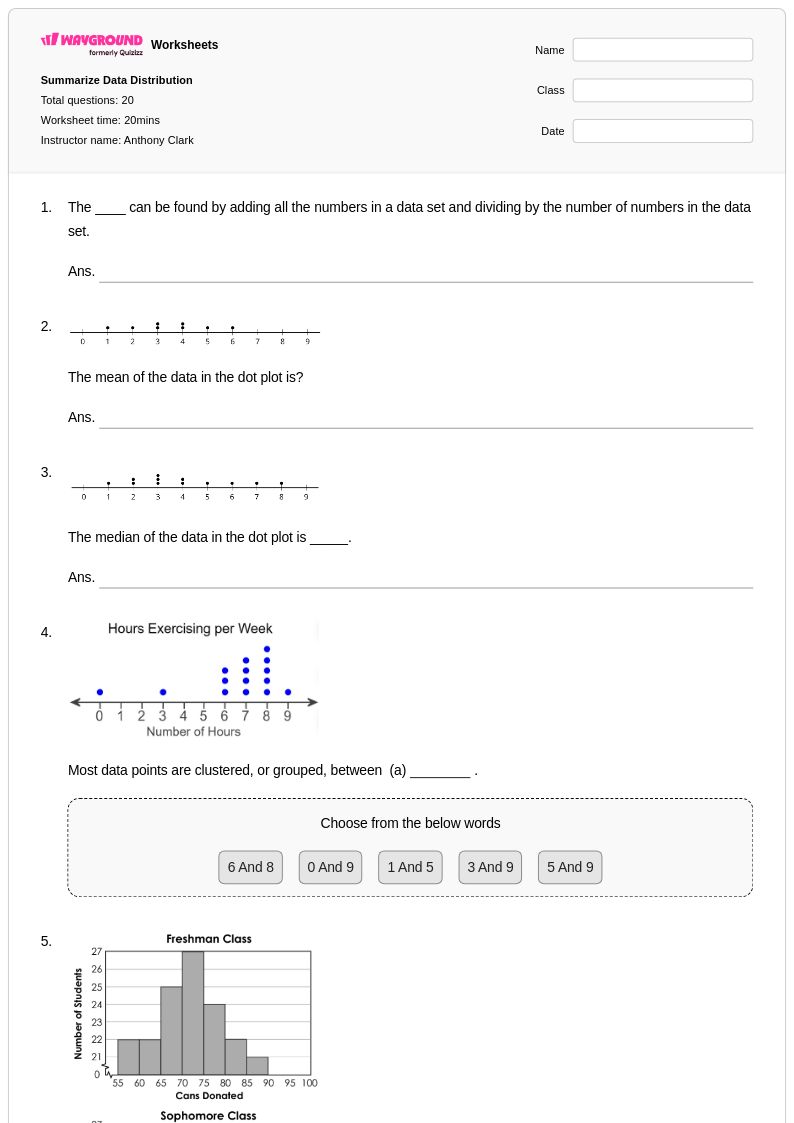
Median of grouped data worksheets available through Wayground (formerly Quizizz) provide students with comprehensive practice in calculating the median from frequency distributions and class intervals. These carefully designed resources strengthen essential statistical analysis skills by guiding learners through the systematic process of finding the median class, applying interpolation formulas, and interpreting results within real-world contexts. Each worksheet collection includes detailed answer keys that demonstrate step-by-step solution methods, making them invaluable free printables for both classroom instruction and independent study. The practice problems progressively build complexity, starting with simple grouped data sets and advancing to more challenging scenarios involving unequal class widths and cumulative frequency calculations, ensuring students develop mastery of this fundamental statistical concept through varied applications in pdf format.
Wayground (formerly Quizizz) empowers educators with millions of teacher-created median of grouped data worksheet resources that feature robust search and filtering capabilities, allowing instructors to quickly locate materials aligned with specific curriculum standards and learning objectives. The platform's differentiation tools enable teachers to customize worksheets based on individual student needs, while flexible formatting options provide seamless transitions between printable pdf versions for traditional classroom use and interactive digital formats for technology-enhanced learning environments. These comprehensive worksheet collections support strategic lesson planning by offering varied difficulty levels for remediation and enrichment purposes, while the extensive answer key systems facilitate efficient grading and targeted skill practice interventions that help students achieve statistical literacy goals.
FAQs
How do I teach students to find the median of grouped data?
What exercises help students practice calculating the median from grouped data?
What are common mistakes when calculating the median of grouped data?
How can I use this median of grouped data worksheet?
How does finding the median of grouped data fit into the math curriculum?
How can I differentiate this topic for struggling students?