
Recommended Topics for you
- Box Plots
- Histograms
- Interpreting Graphs
- Line Graphs
- Line Plots
- Scaled Bar Graphs
- Scaled Pictographs
- Scatter Plots
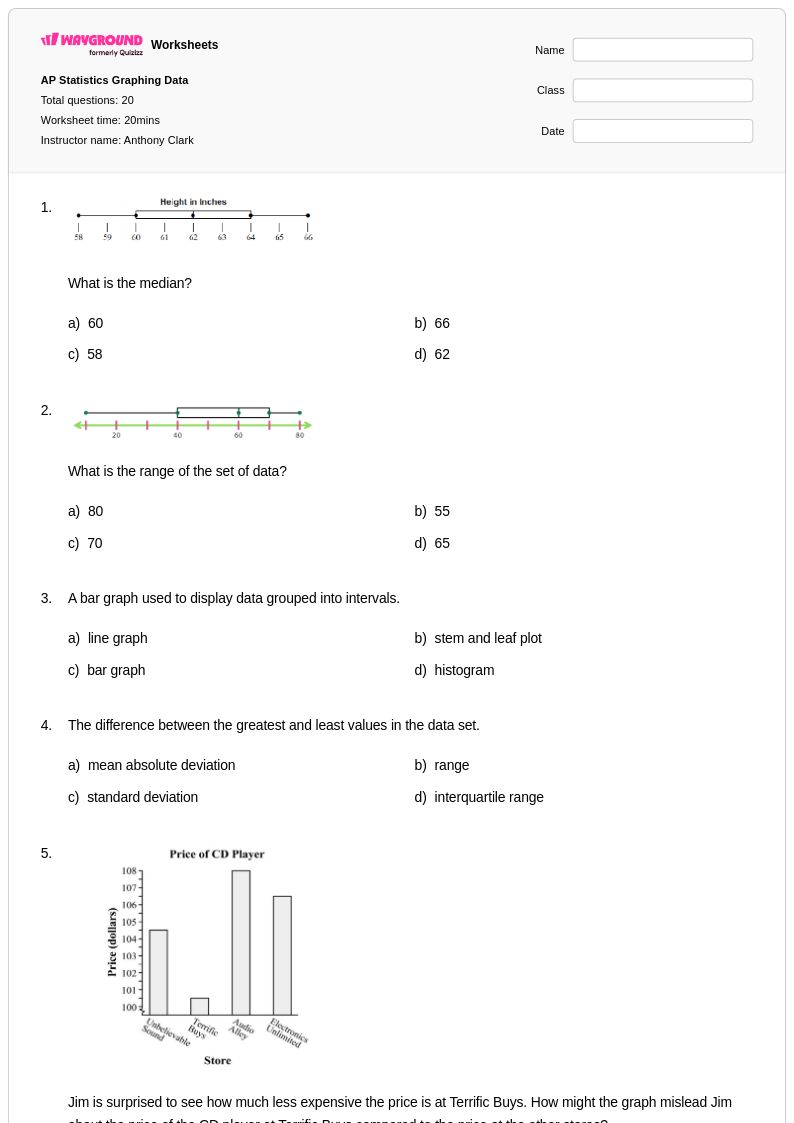
20 Q
6th - Uni
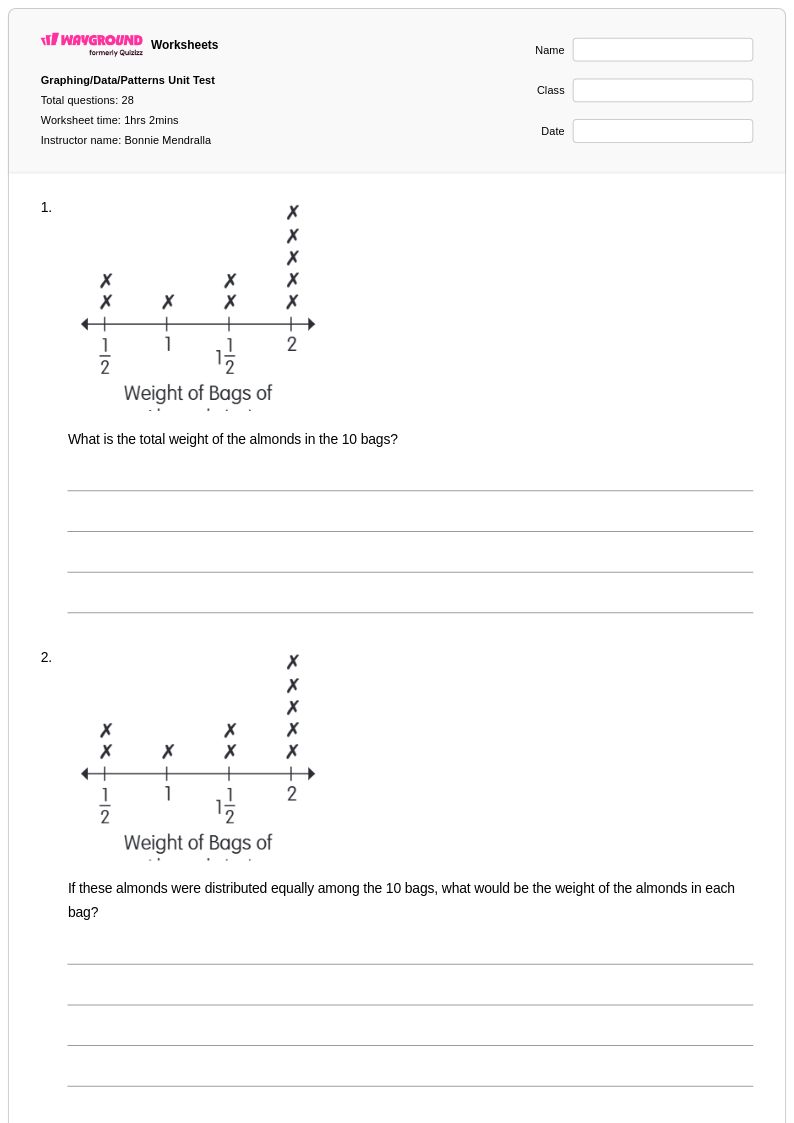
28 Q
5th - Uni
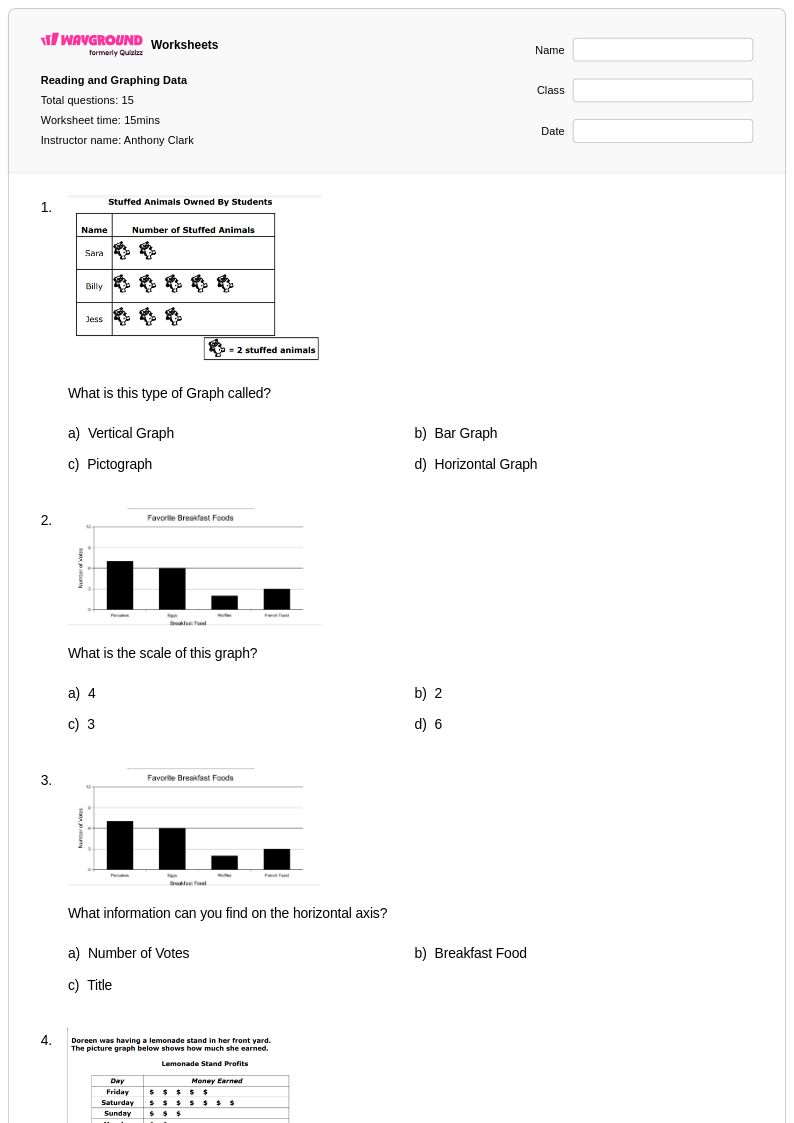
15 Q
3rd - Uni
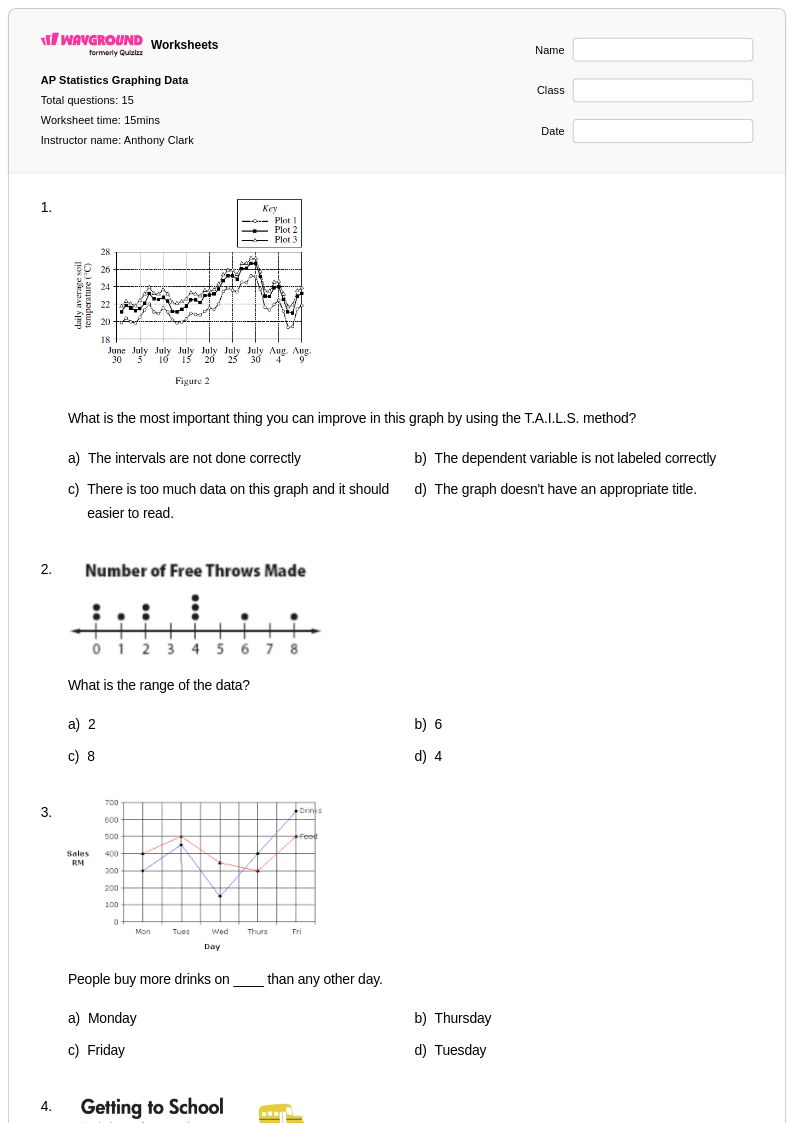
15 Q
6th - Uni
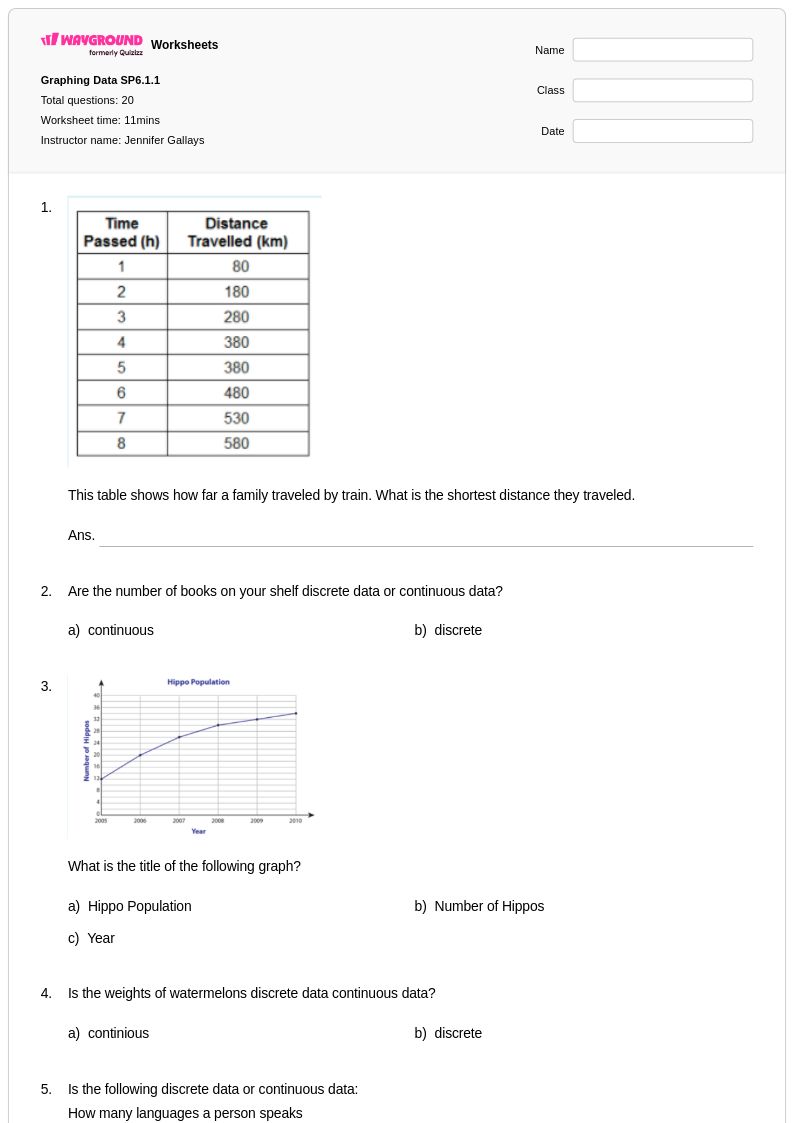
20 Q
6th - 8th
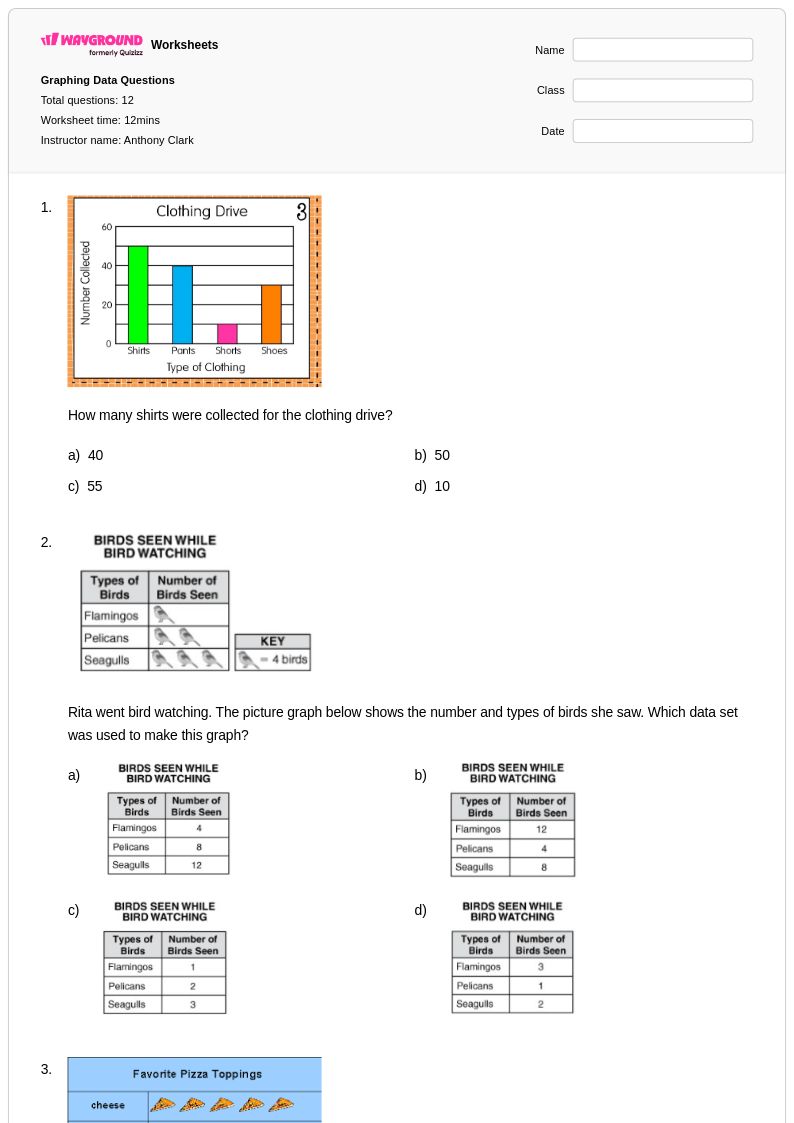
12 Q
5th - Uni
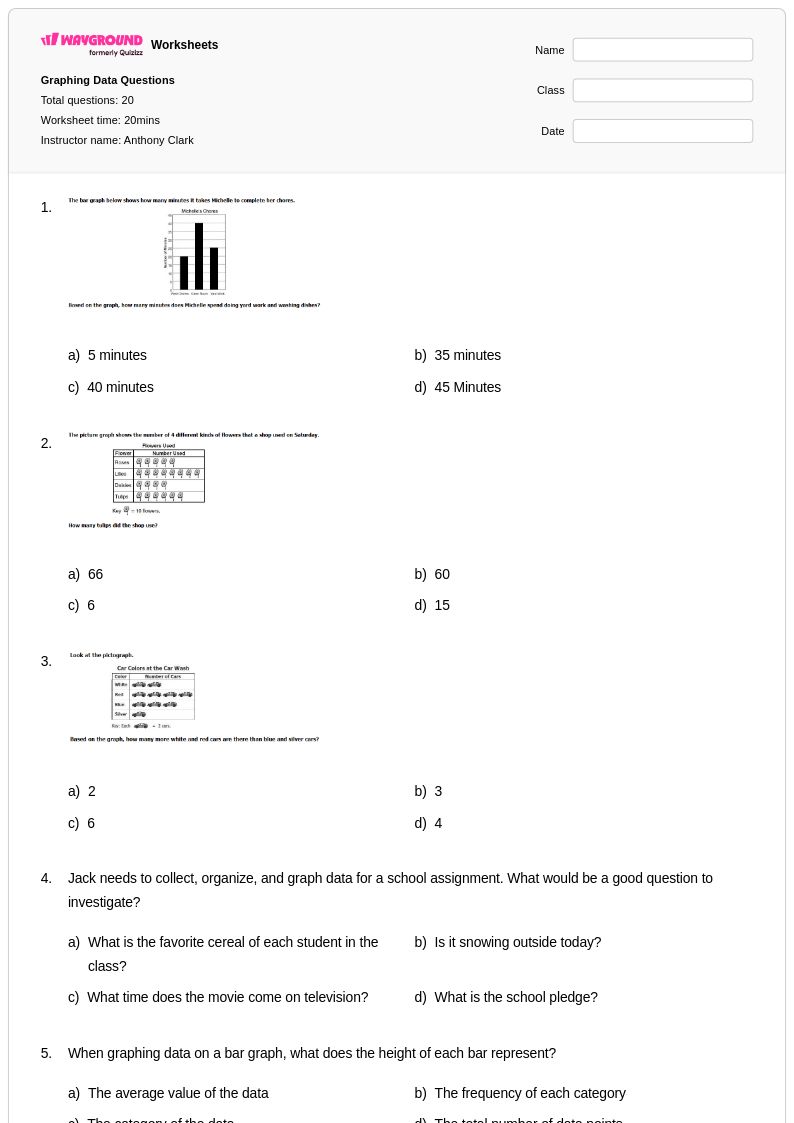
20 Q
5th - Uni
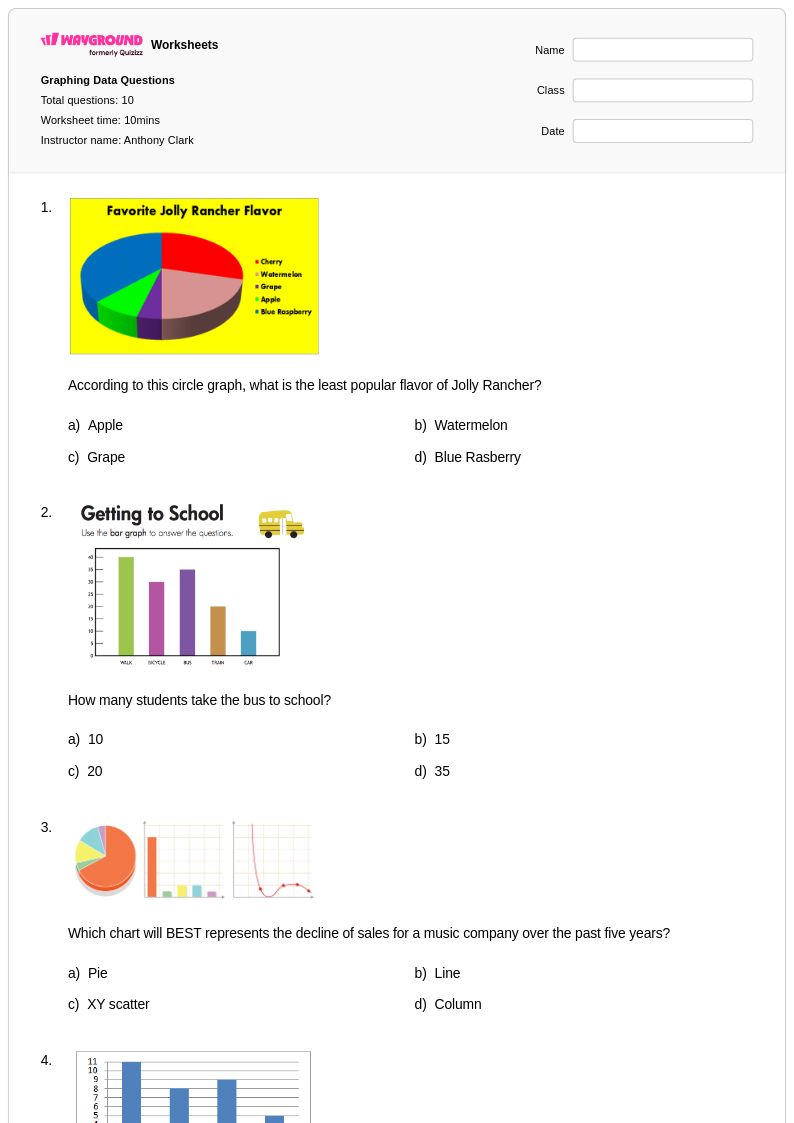
10 Q
5th - Uni
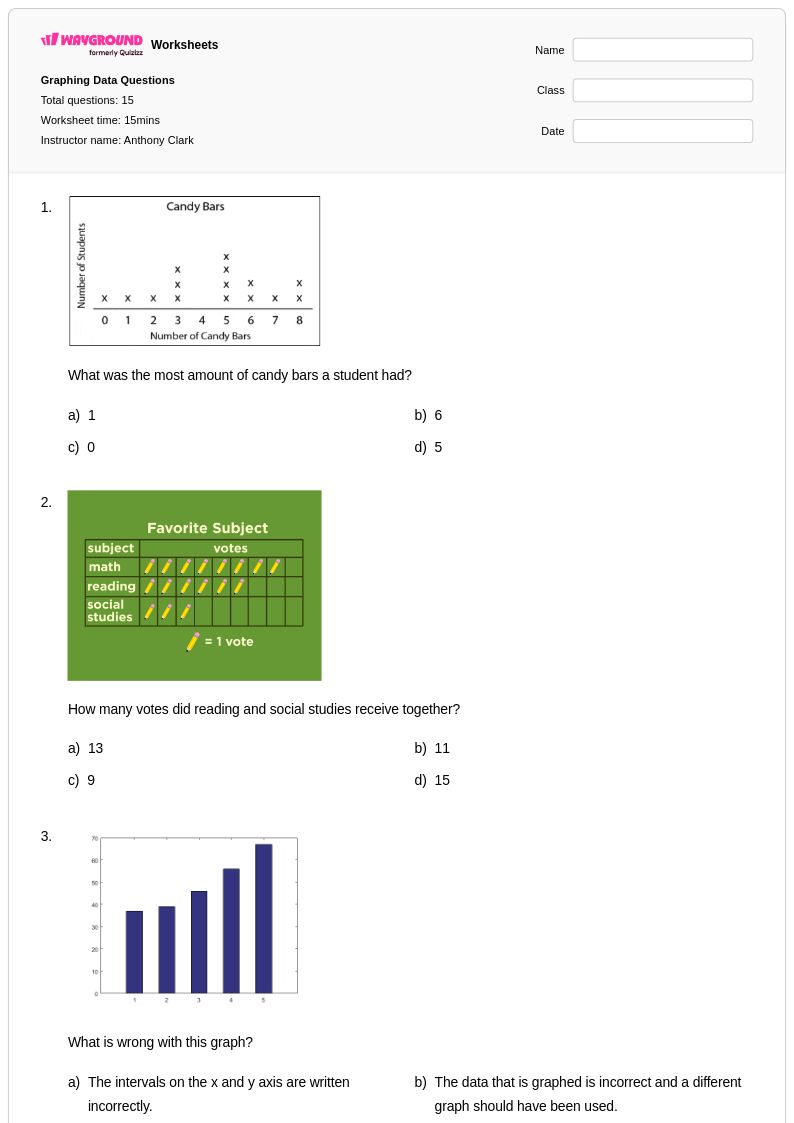
15 Q
5th - Uni
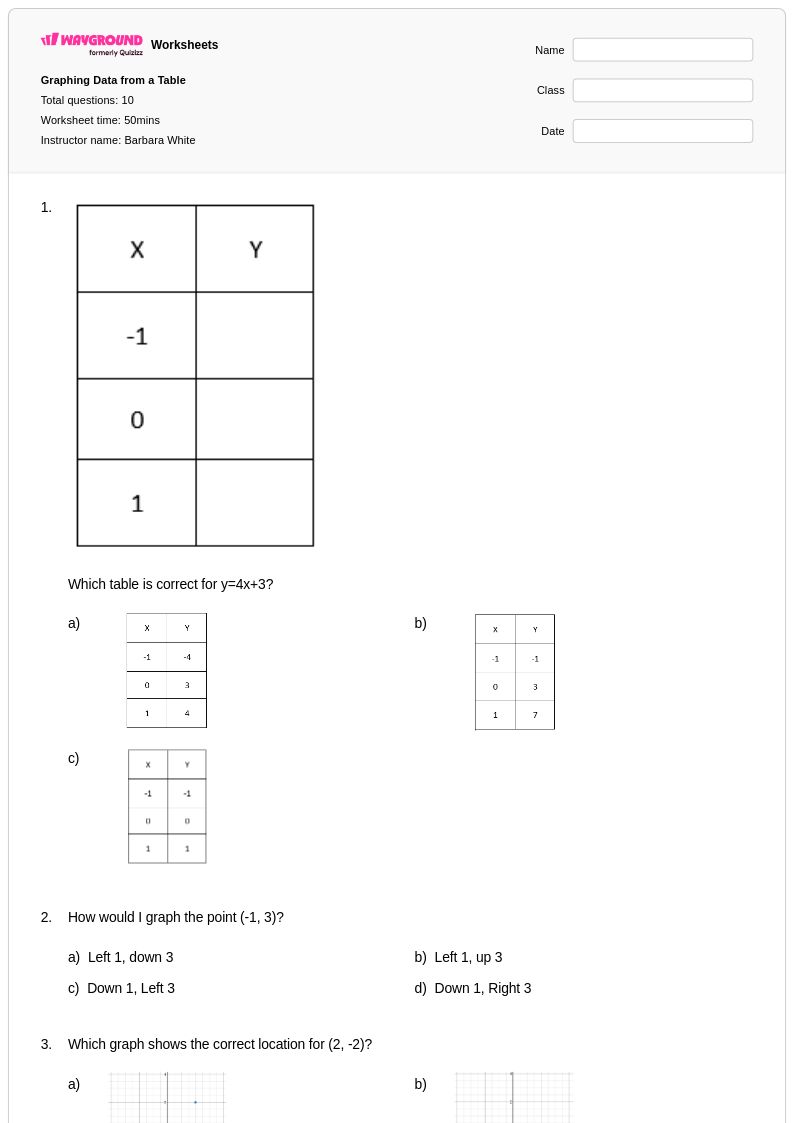
10 Q
8th - 12th
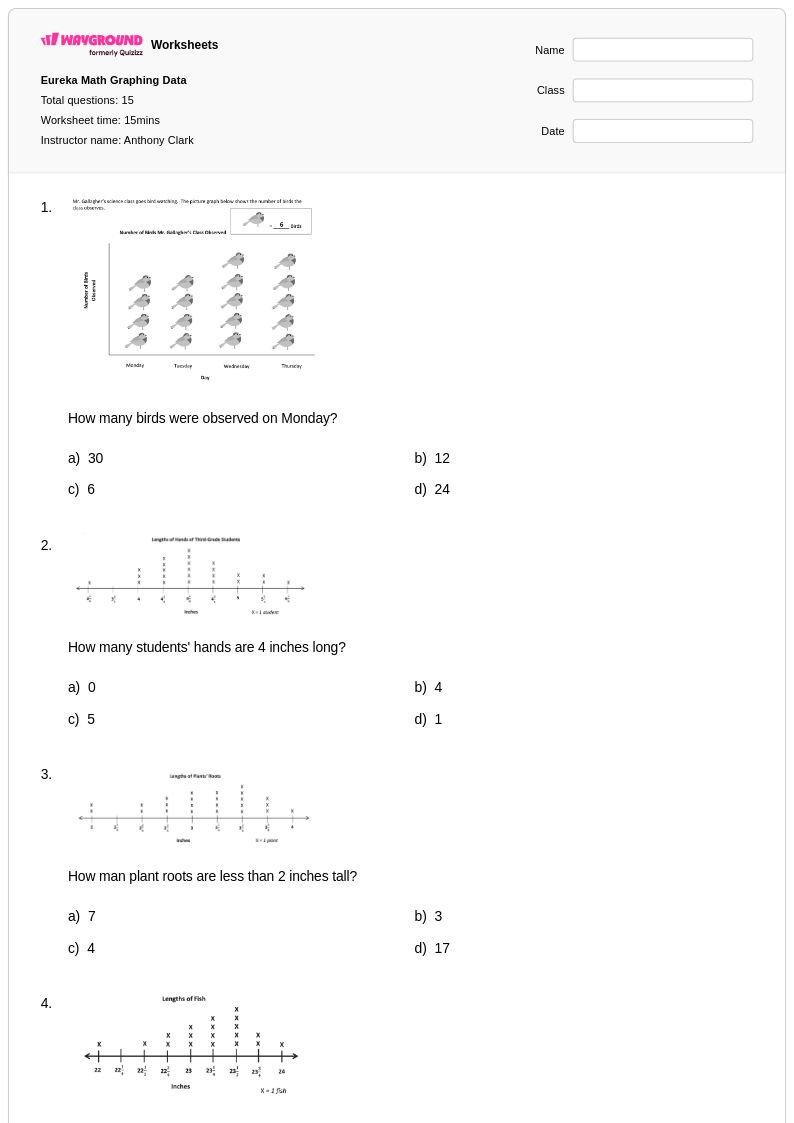
15 Q
3rd - Uni
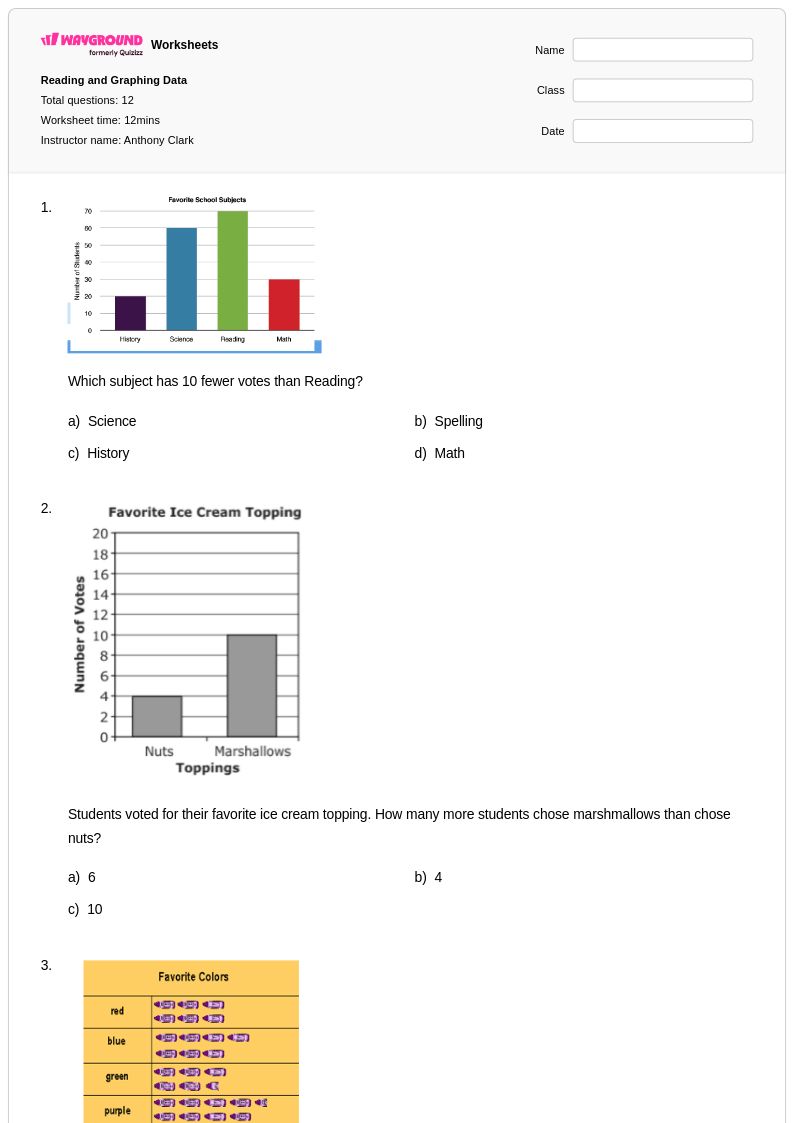
12 Q
3rd - Uni
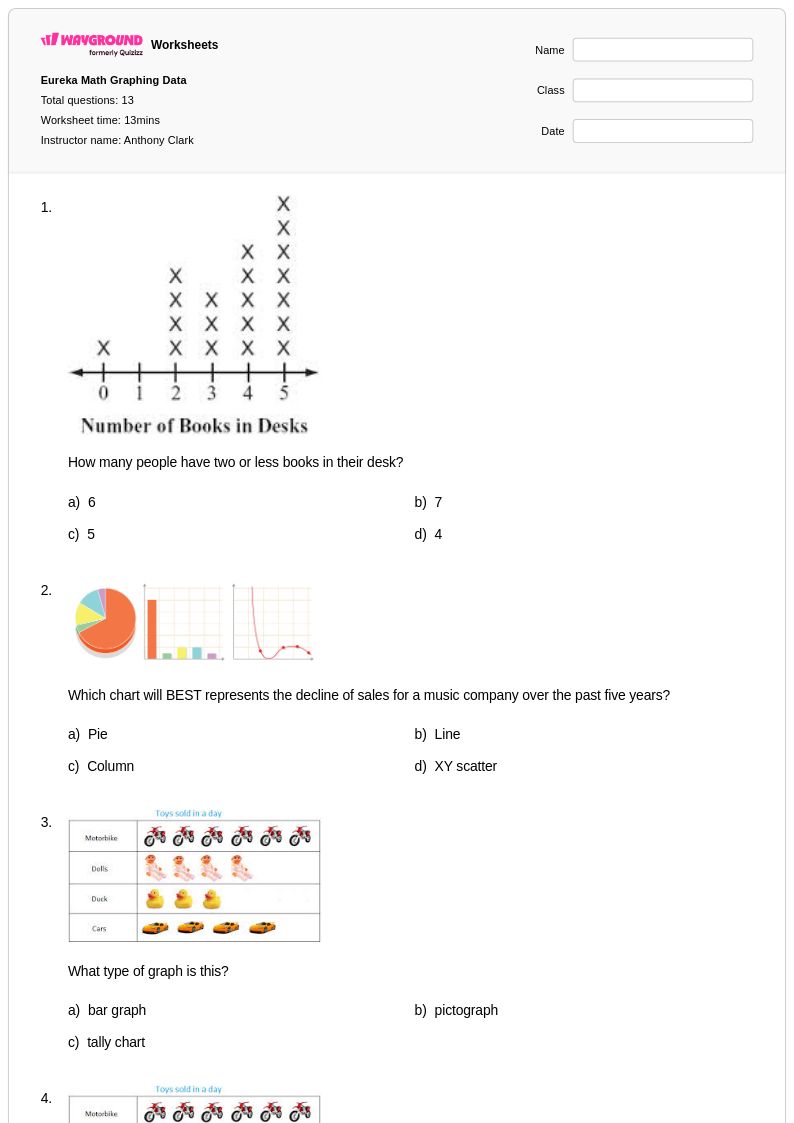
13 Q
3rd - Uni
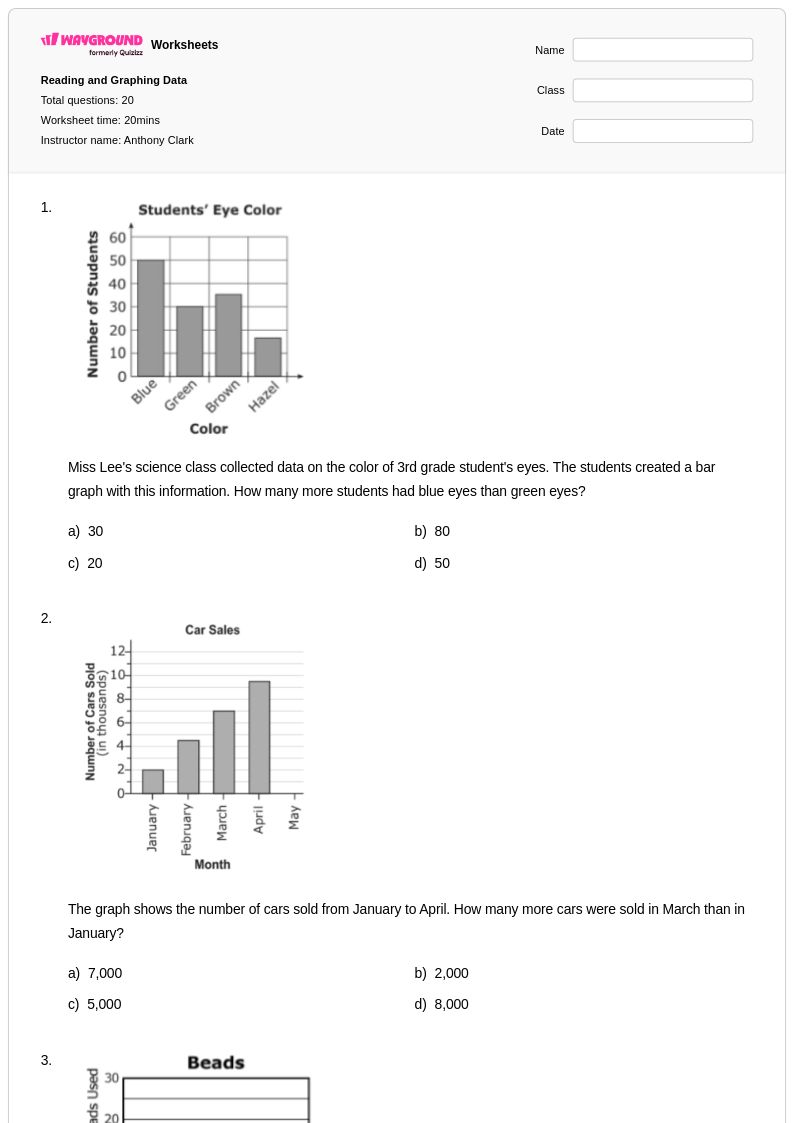
20 Q
3rd - Uni
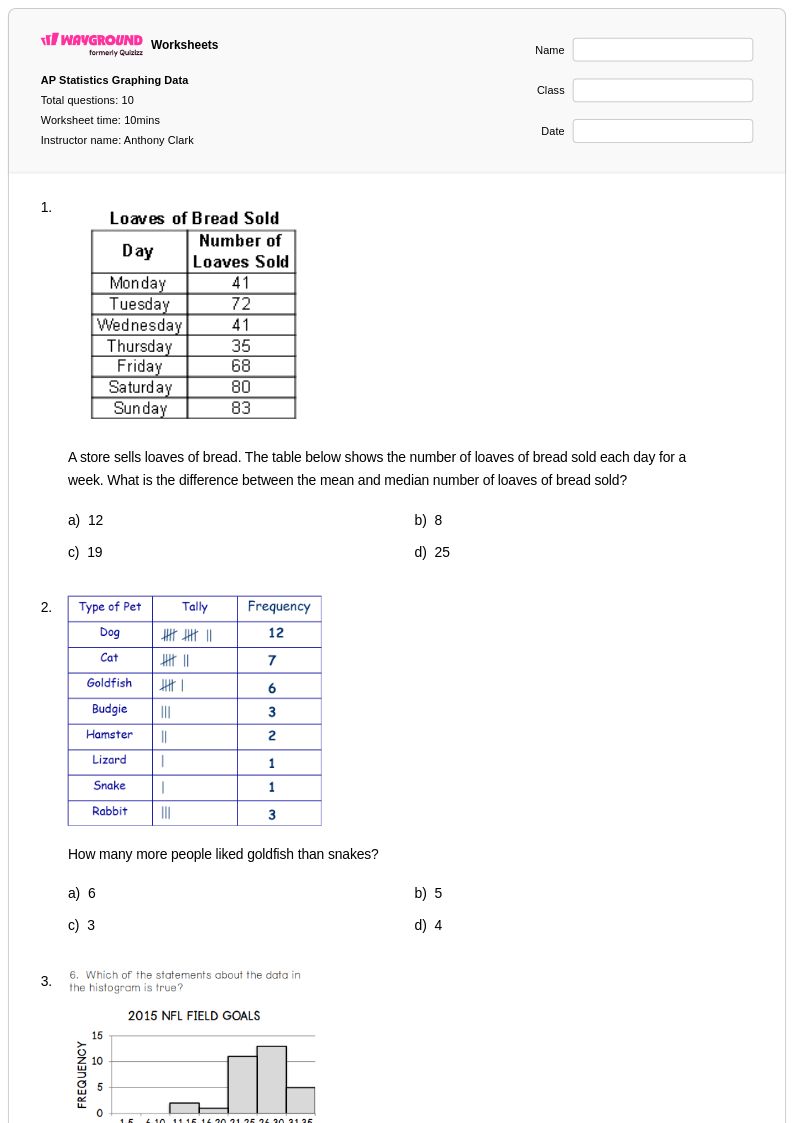
10 Q
6th - Uni
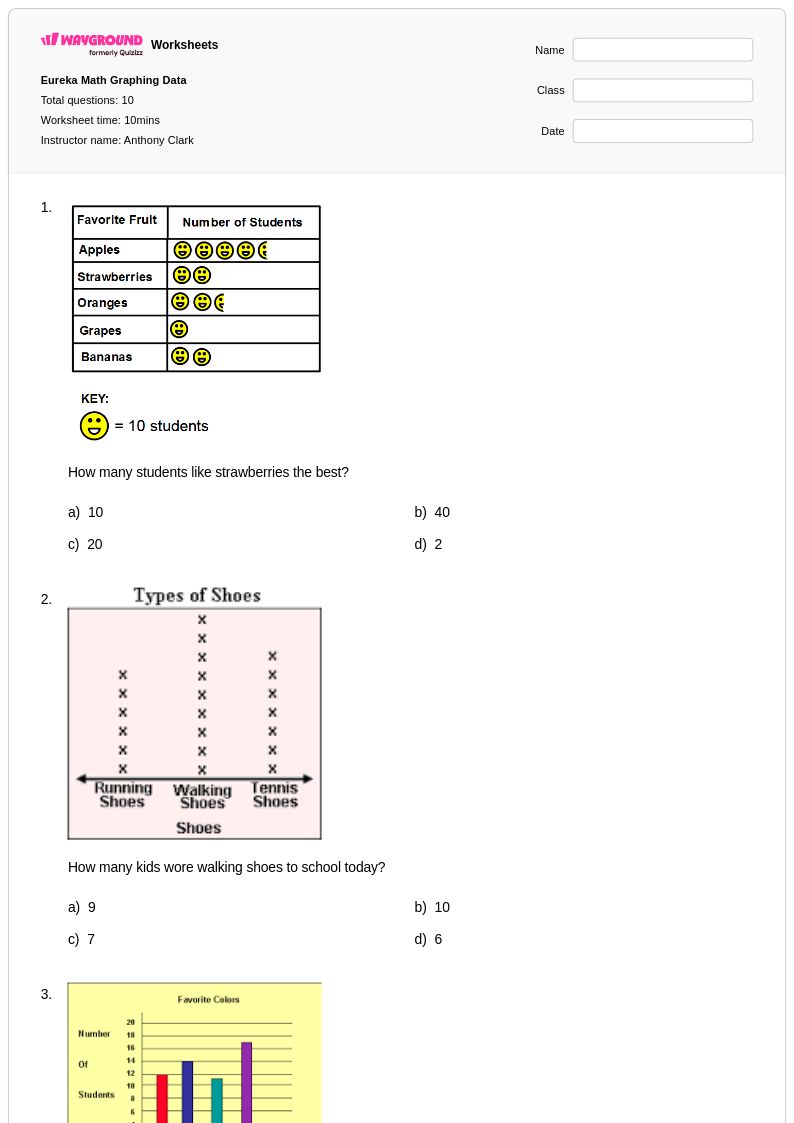
10 Q
3rd - Uni
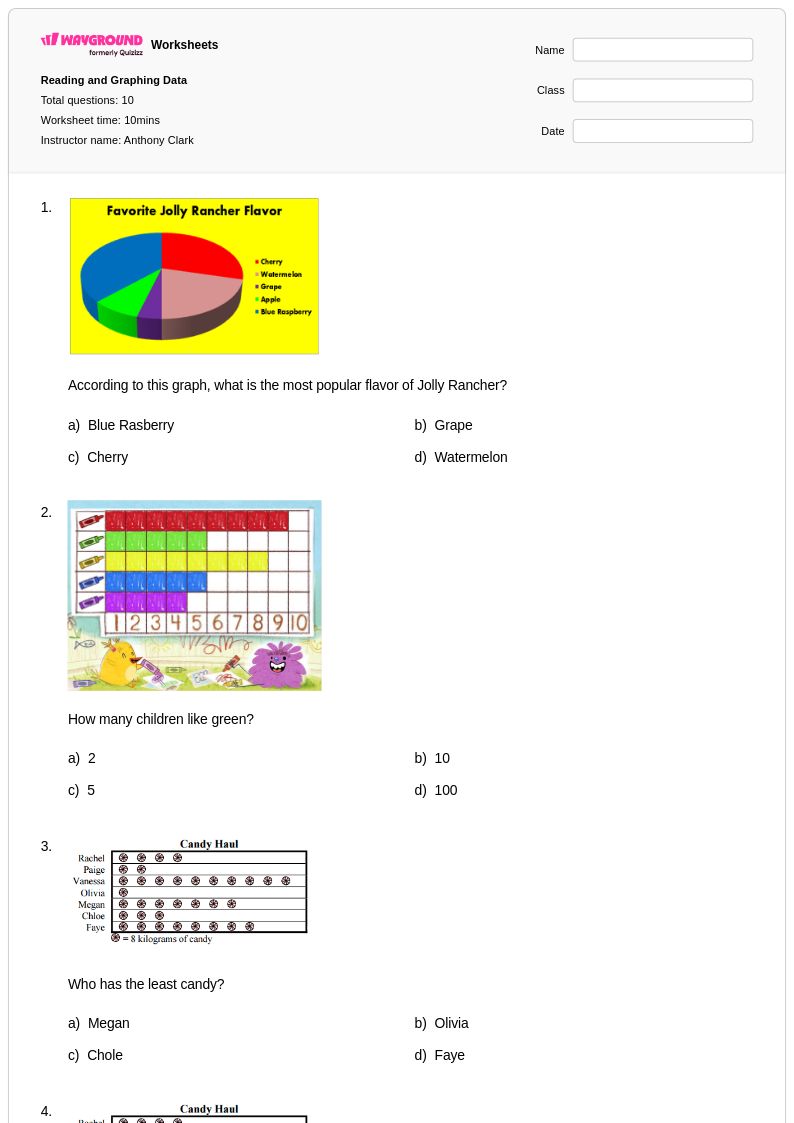
10 Q
3rd - Uni
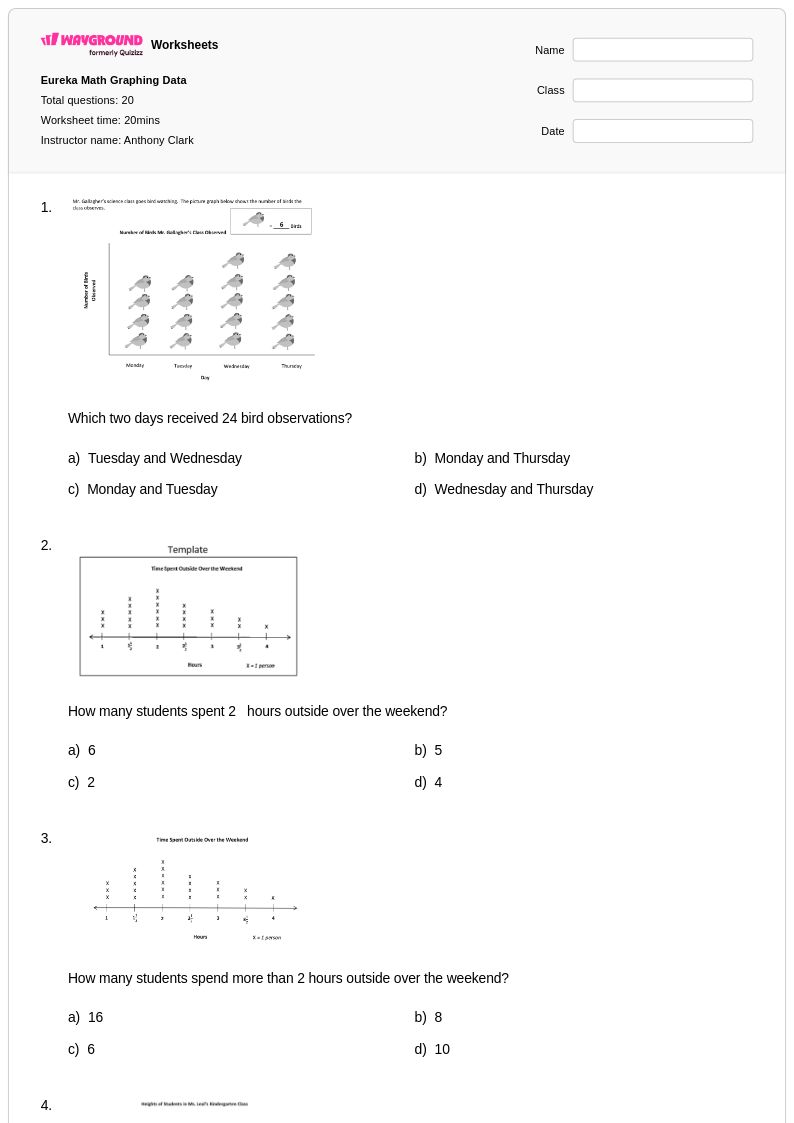
20 Q
3rd - Uni
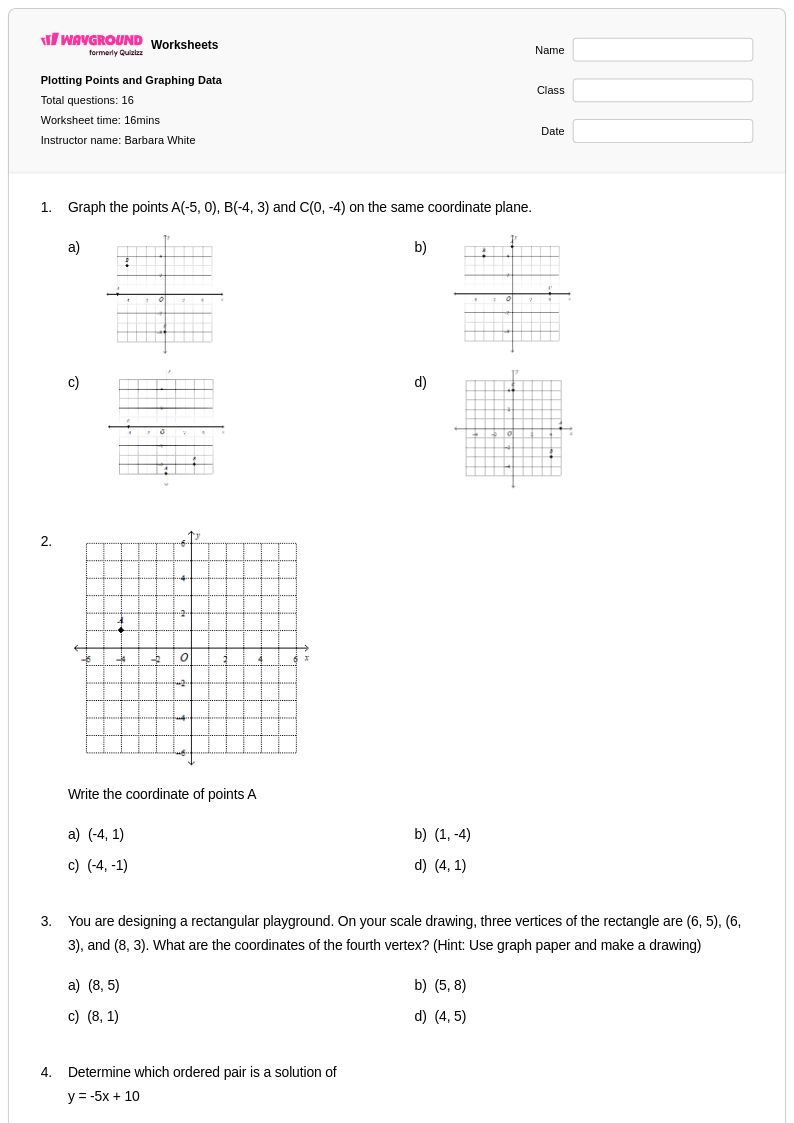
16 Q
6th - 9th
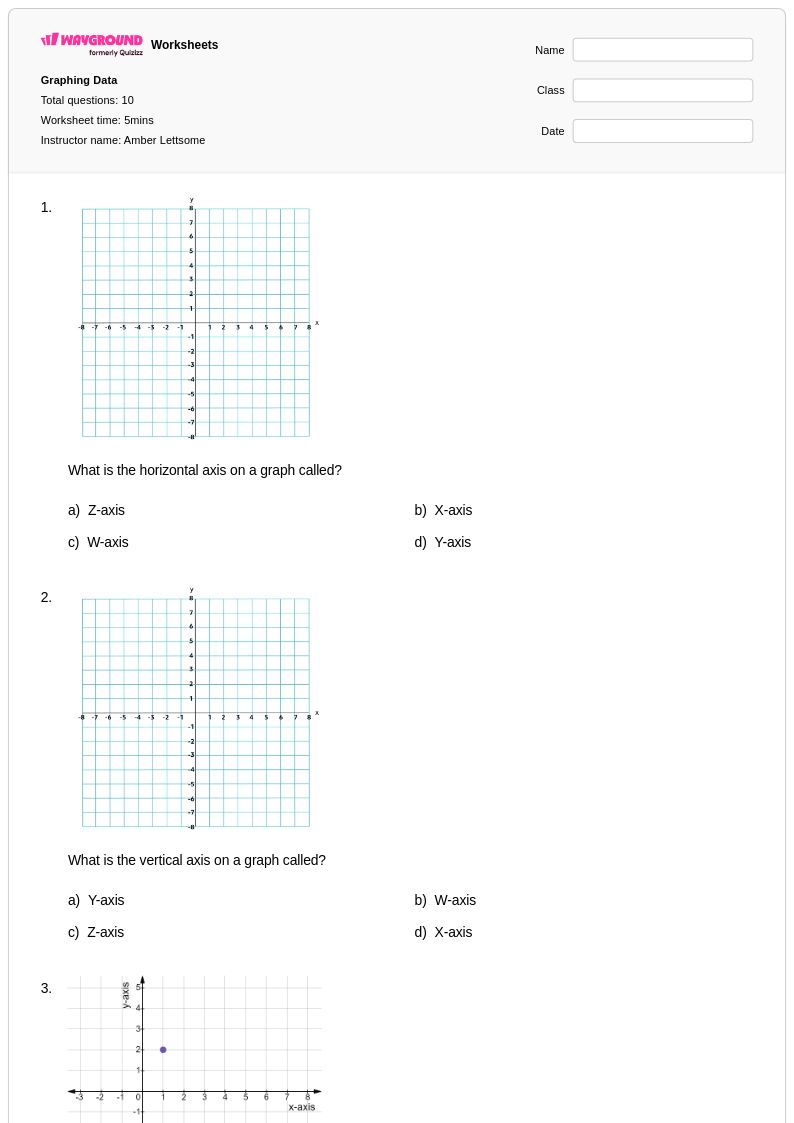
10 Q
6th - 8th
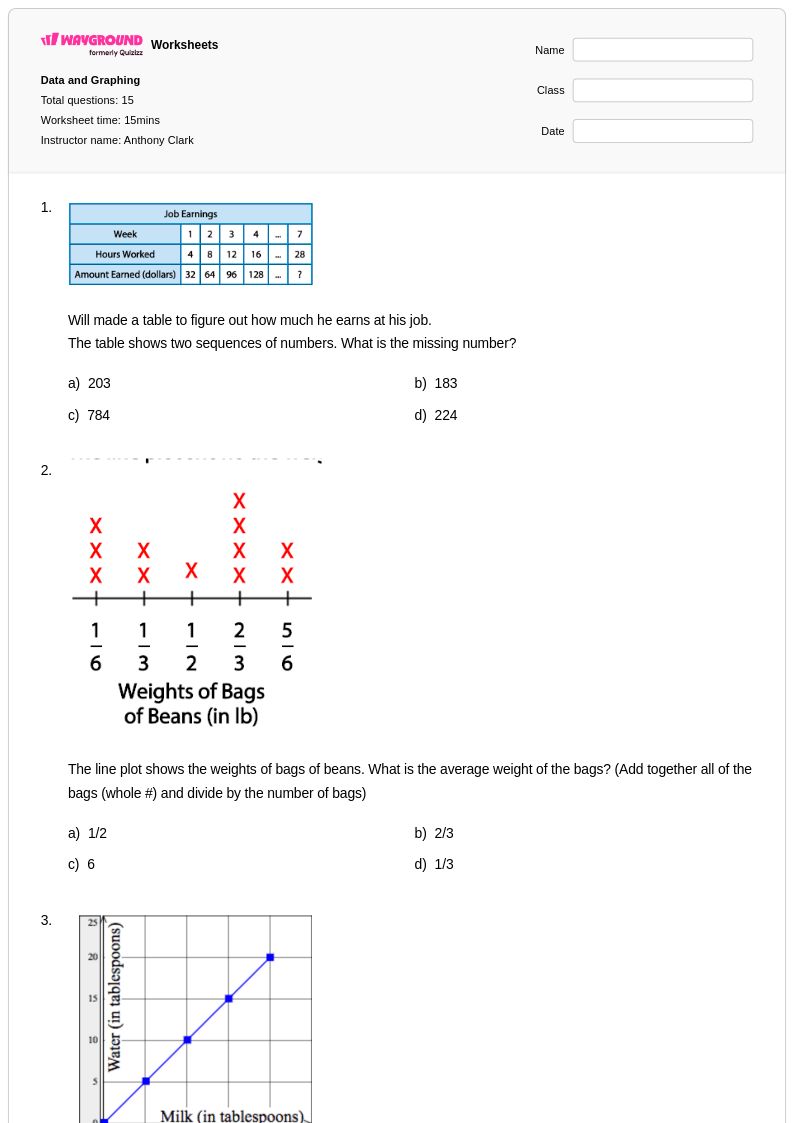
15 Q
5th - Uni
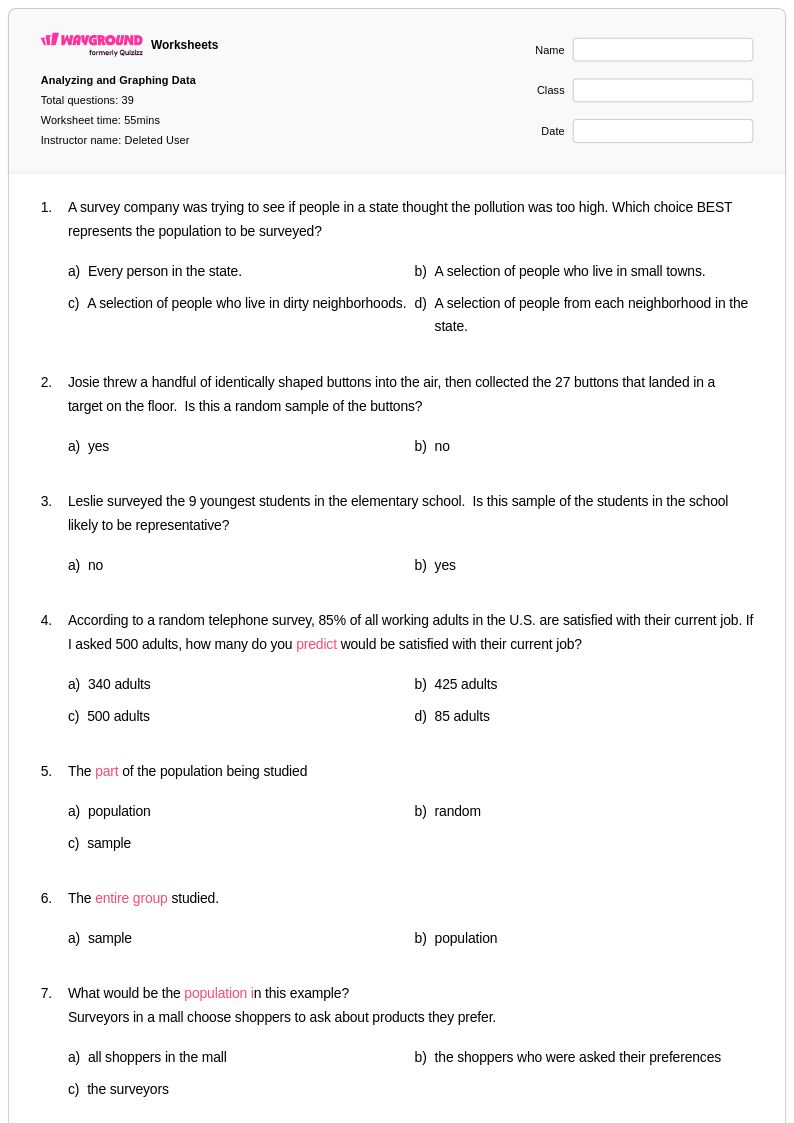
39 Q
6th - 8th
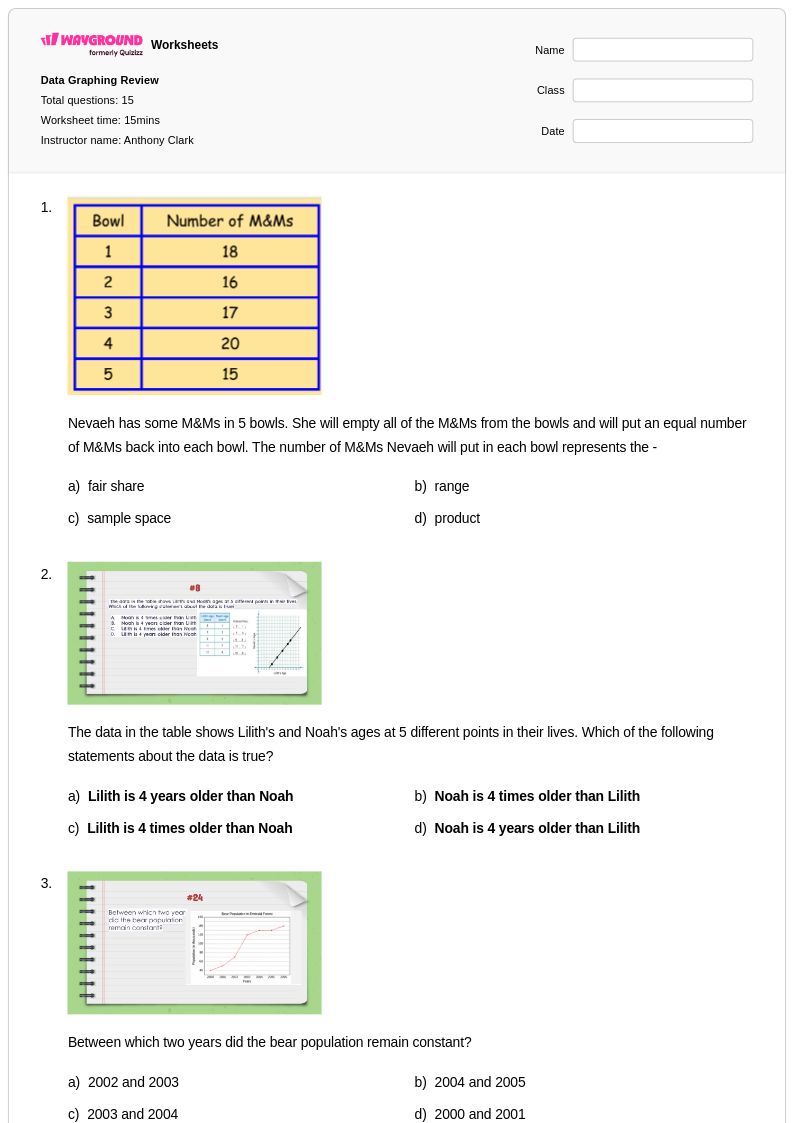
15 Q
5th - Uni
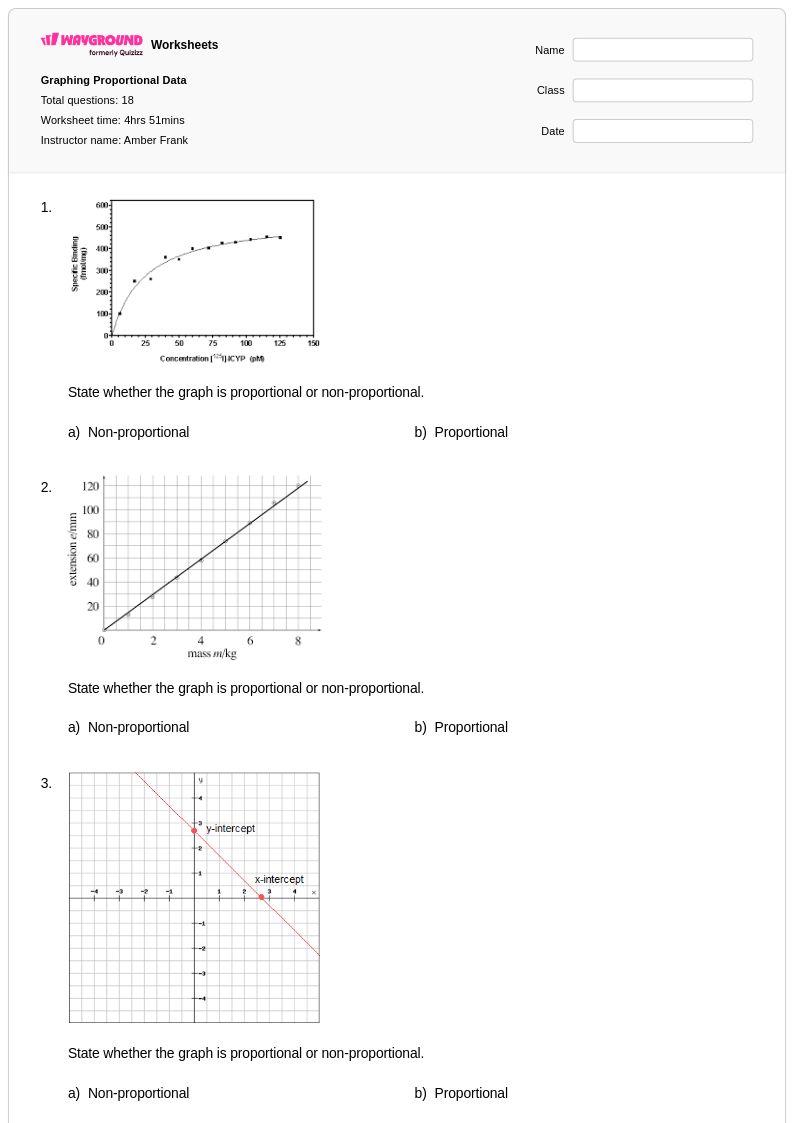
18 Q
6th - 8th
Explore Graphing Data Worksheets by Grades
Explore Graphing Data Worksheets for grade 8 by Topic
Explore Other Subject Worksheets for grade 8
Explore printable Graphing Data worksheets for Grade 8
Graphing data worksheets for Grade 8 students available through Wayground (formerly Quizizz) provide comprehensive practice in organizing, interpreting, and visually representing statistical information. These professionally designed resources strengthen essential mathematical skills including creating scatter plots, line graphs, bar charts, and histograms while helping students analyze trends, identify patterns, and draw meaningful conclusions from datasets. Each worksheet collection includes detailed answer keys and practice problems that guide students through the fundamental processes of data visualization, from selecting appropriate graph types to accurately plotting coordinates and interpreting statistical relationships. Available as free printables in convenient pdf format, these worksheets systematically develop students' ability to transform raw numerical data into clear, informative visual representations that support mathematical reasoning and communication.
Wayground (formerly Quizizz) empowers educators with millions of teacher-created graphing data resources specifically designed for Grade 8 mathematics instruction. The platform's advanced search and filtering capabilities allow teachers to quickly locate worksheets aligned with specific curriculum standards, while built-in differentiation tools enable customization based on individual student needs and learning objectives. These flexible resources are available in both printable and digital formats, including downloadable pdf versions, making them suitable for classroom instruction, homework assignments, and independent practice sessions. Teachers can efficiently plan comprehensive data analysis units, provide targeted remediation for students struggling with graph interpretation, offer enrichment activities for advanced learners, and deliver consistent skill practice that builds confidence in statistical reasoning and mathematical communication across diverse learning environments.
FAQs
What is the best way to teach graphing data in Grade 8?
What exercises help eighth graders practice graphing data?
What mistakes do Grade 8 students make with scatter plots and data graphs?
How can I assign these Grade 8 graphing data worksheets?
Are Grade 8 graphing data worksheets aligned with Common Core?
How can I differentiate scatter plot and graphing practice in Grade 8?
What graphing skills should students have by the end of eighth grade?