Master derivative graphs with Wayground's comprehensive collection of free calculus worksheets, featuring printable PDFs with practice problems and answer keys to help students analyze and interpret graphical representations of derivatives.
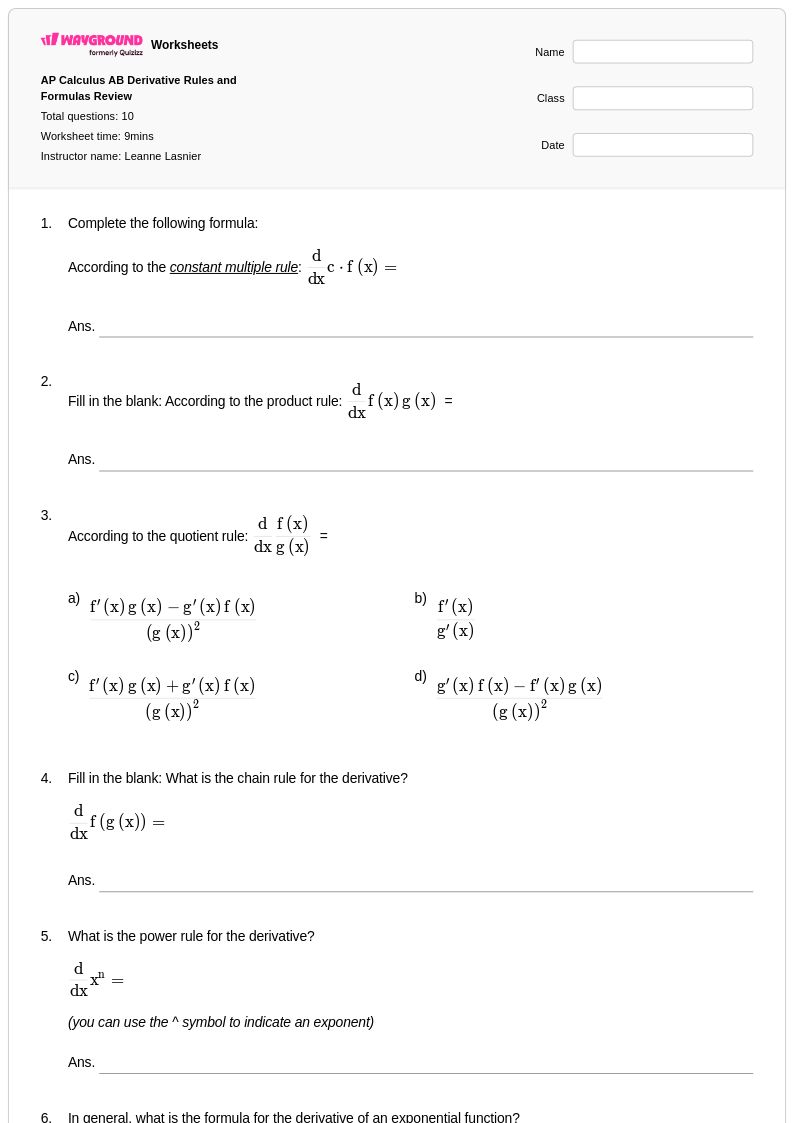
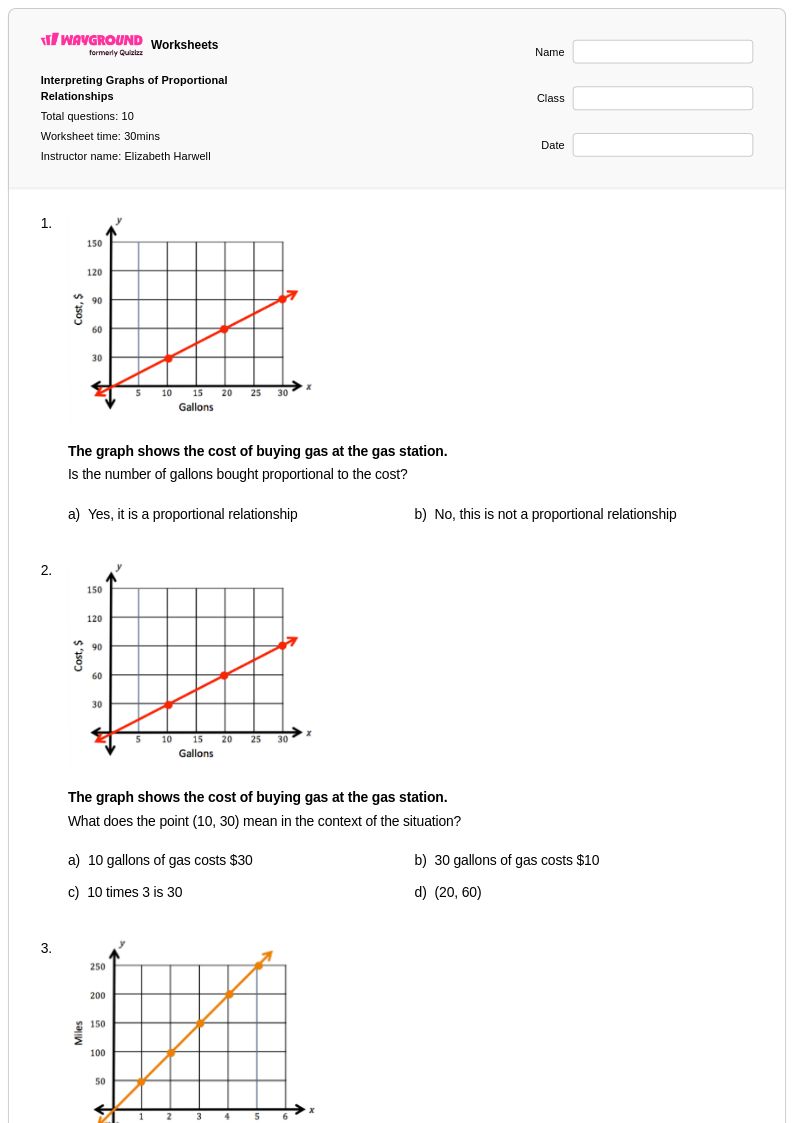
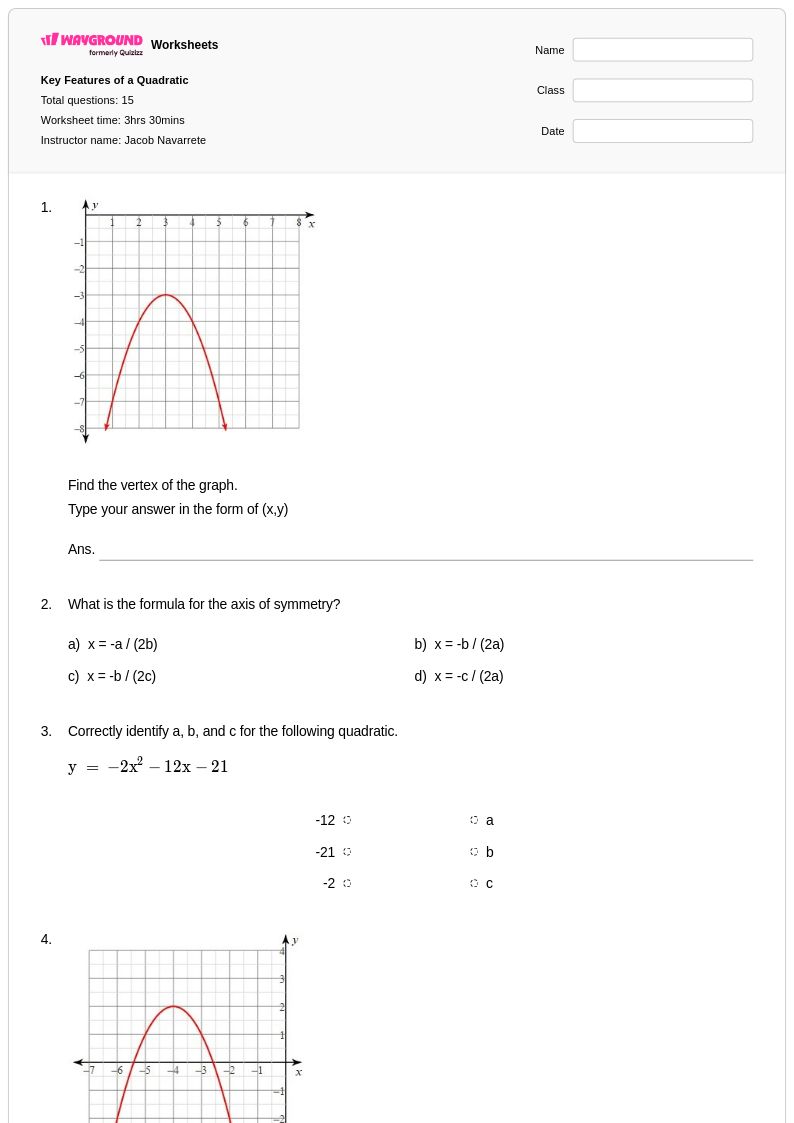
Derivative graphs worksheets available through Wayground (formerly Quizizz) provide comprehensive practice for students learning to analyze and interpret the graphical relationships between functions and their derivatives. These expertly crafted resources strengthen essential calculus skills including sketching derivative graphs from original functions, identifying critical points and intervals of increase or decrease, and understanding the connection between a function's behavior and its derivative's characteristics. The collection features detailed practice problems that guide students through analyzing concavity, inflection points, and the relationship between zero derivatives and local extrema. Each worksheet includes a complete answer key and is available as a free printable pdf, making it easy for educators to incorporate meaningful derivative graph analysis into their calculus curriculum.
Wayground (formerly Quizizz) empowers mathematics teachers with access to millions of teacher-created derivative graph resources that can be easily searched and filtered to match specific learning objectives and standards alignment requirements. The platform's robust differentiation tools allow educators to customize worksheet difficulty levels, problem types, and visual representations to meet diverse student needs, whether for initial skill introduction, targeted remediation, or advanced enrichment activities. Teachers can seamlessly transition between printable pdf formats for traditional classroom use and digital interactive versions that provide immediate feedback, making lesson planning more efficient and responsive to individual student progress. These flexible customization options enable educators to create focused practice sessions that address specific areas of difficulty in derivative graph interpretation while building students' conceptual understanding of calculus fundamentals.
FAQs
How do I teach students to read and sketch derivative graphs?
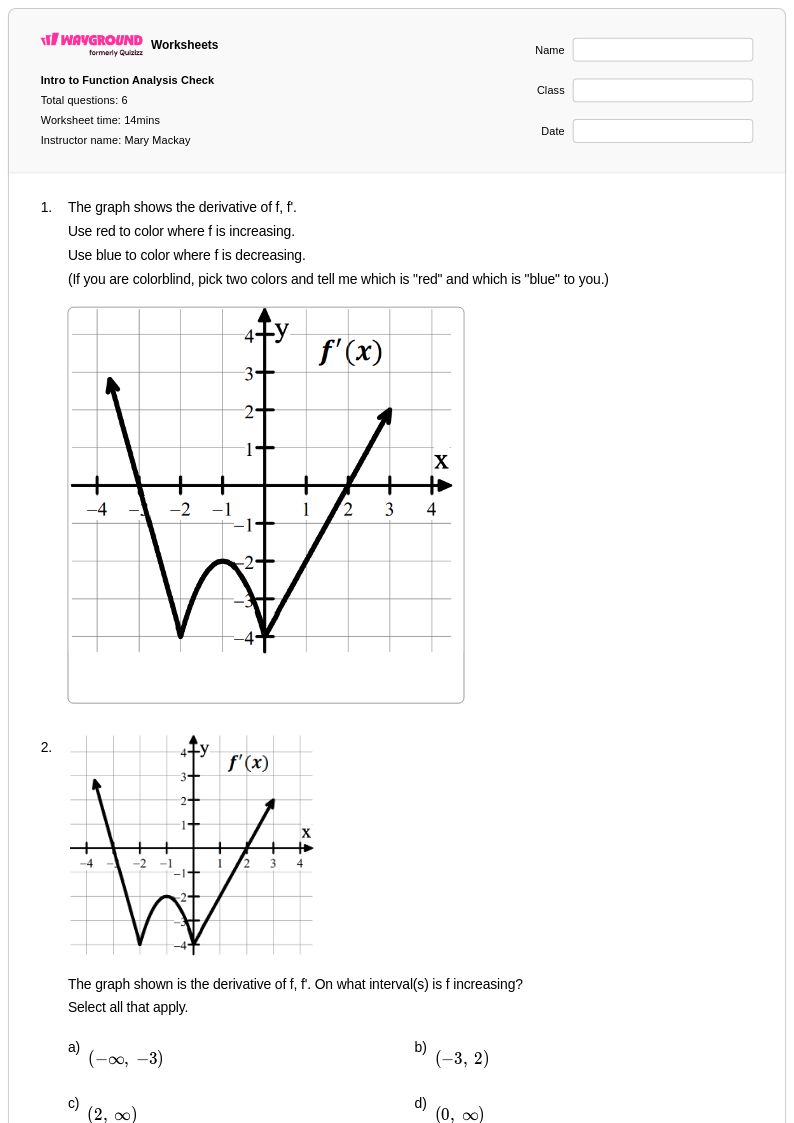
Start with the slope story: have students trace a function curve with their finger and narrate whether the slope is positive, negative, or zero at each point — that narration becomes the derivative graph. Once students can describe slope behavior verbally, translating it to a graph is much more intuitive. From there, focus on the three key translations: where f is increasing, f′ is positive; where f has a local max or min, f′ crosses zero; where f changes concavity, f′ has its own local extremum. Building these connections one at a time, rather than all at once, prevents the confusion that comes from treating derivative graphs as a separate memorization task.
What exercises help students practice interpreting derivative graphs?
The most effective practice moves in both directions: given f, sketch f′, and given f′, reconstruct the behavior of f. Wayground's derivative graphs worksheets cover both directions, along with identifying critical points, intervals of increase and decrease, concavity, and inflection points. Problems that ask students to match a function graph to its derivative graph are especially useful for building conceptual understanding rather than just procedural recall.
What mistakes do students commonly make with derivative graphs?
Three errors come up constantly. First, students confuse the value of f with the value of f′, they'll mark f′ as positive wherever f is above the x-axis, rather than wherever f has a positive slope. Second, they misplace zeros of f′, putting them at the peaks of f′ rather than at the peaks of f. Third, they struggle with the second derivative: they know concavity is involved but can't reliably connect a sign change in f′ to an inflection point in f. Targeted practice that isolates each of these relationships, rather than asking students to analyze everything at once, helps break these patterns.
How do I use Wayground's derivative graphs worksheets in my class?
Each worksheet includes a complete answer key, so it works well for independent practice, homework, or review without extra prep on your end. You can run it as a digital quiz hosted on Wayground, useful when you want students to get immediate feedback, or download the printable PDF and assign it on paper. If you go the paper route, the Wayground for Teachers app lets you scan or capture student submissions for grading, which keeps your workflow in one place either way.
How does derivative graph analysis fit into the calculus curriculum sequence?
In the Common Core-aligned progression, students build toward calculus by first developing a strong understanding of function behavior, domain, range, increasing/decreasing intervals, in earlier courses. Derivative graph analysis sits at the point where that function intuition meets the formal definition of the derivative: students must connect the rate of change they've reasoned about informally to a precise graphical representation. From here, the natural next step is the first and second derivative tests, which formalize what students have been reading visually into a procedure for classifying critical points and describing concavity.
How can I differentiate derivative graph practice for students at different levels?
For students who are still building confidence, Wayground's reduced answer choices accommodation lowers the cognitive load on matching and multiple-choice problems, letting them focus on the graphical reasoning rather than the process of elimination. The dyslexia-friendly font and adjustable font size options help students who struggle with dense text in multi-part problems. For mixed-ability classes, you can generate alternate versions of the same worksheet with wider font spacing for students who need more visual breathing room — all without creating a separate assignment.
What is the relationship between a function's graph and its derivative's graph?
The derivative graph plots the slope of the original function at every x-value. Where the original function is increasing, the derivative is positive; where it's decreasing, the derivative is negative; and where the original has a local maximum or minimum, the derivative equals zero. Concavity adds another layer: where the derivative is itself increasing, the original function is concave up, and a local minimum in the derivative corresponds to an inflection point in the original.