Free Printable Graphing Real World Applications Worksheets for Class 9
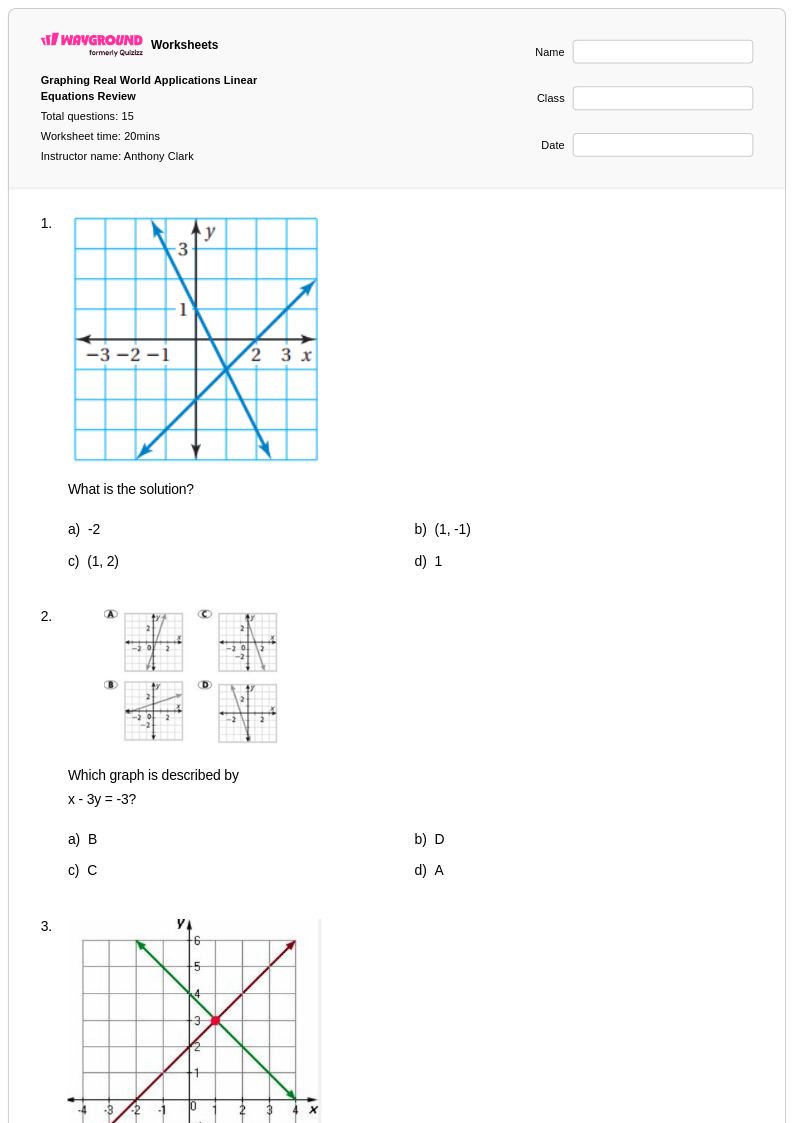
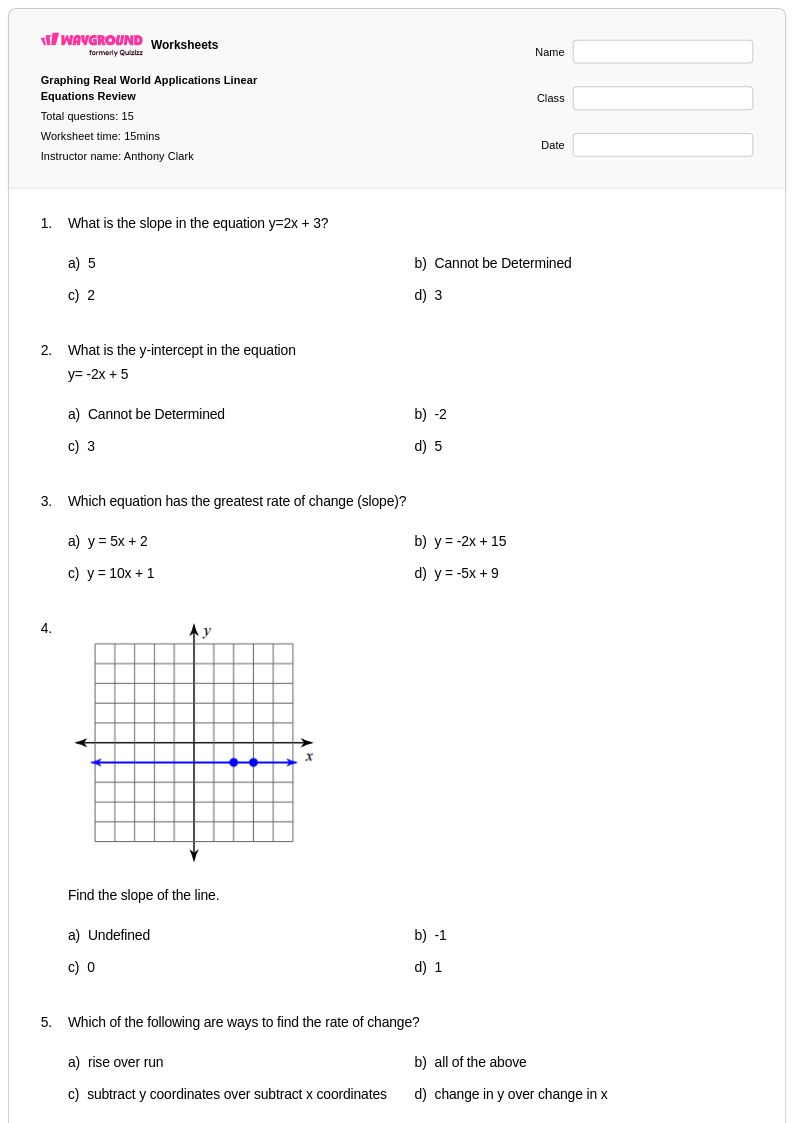
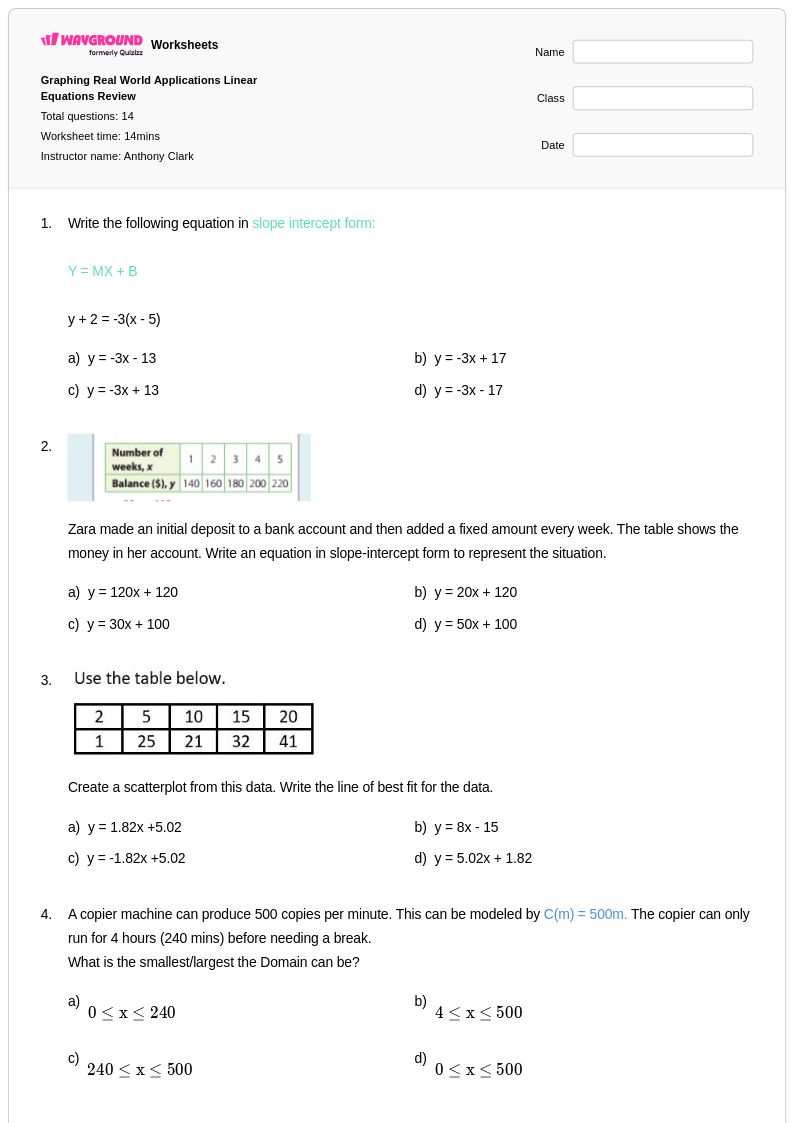
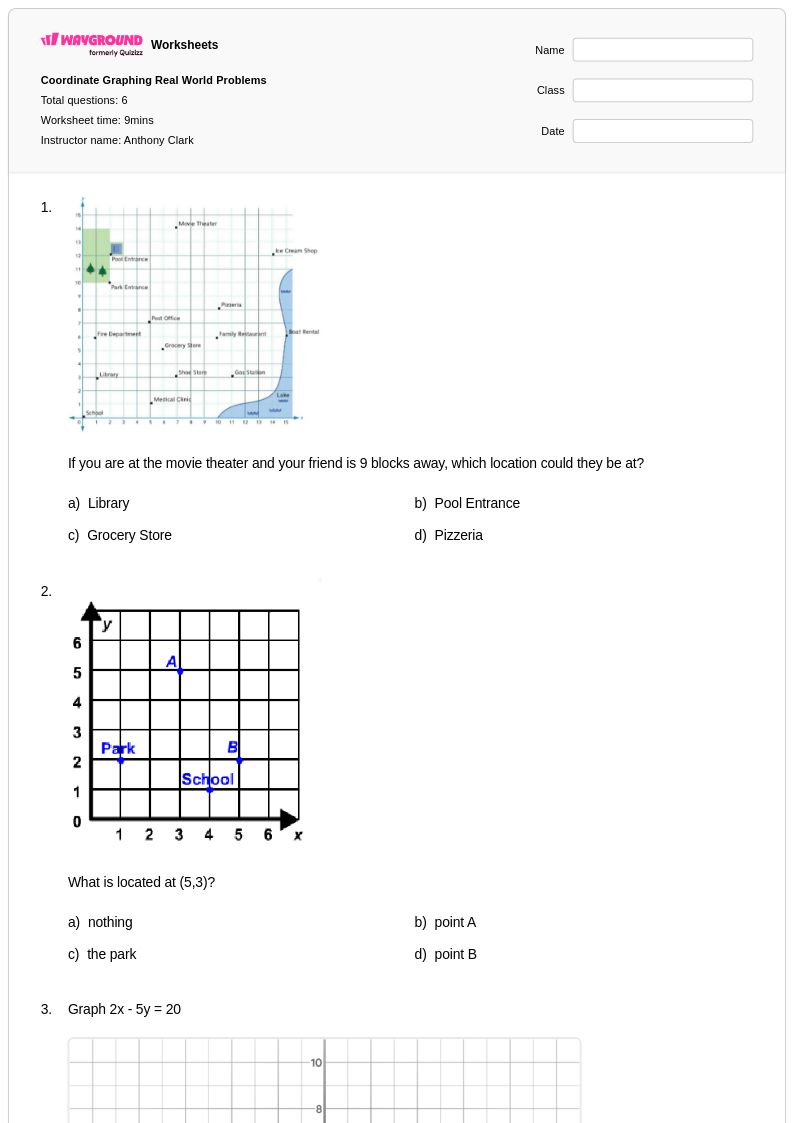
Wayground offers free Class 9 mathematics worksheets and printables focusing on graphing real world applications, featuring practice problems and answer keys to help students master data visualization skills through practical scenarios.
Explore printable Graphing Real World Applications worksheets for Class 9
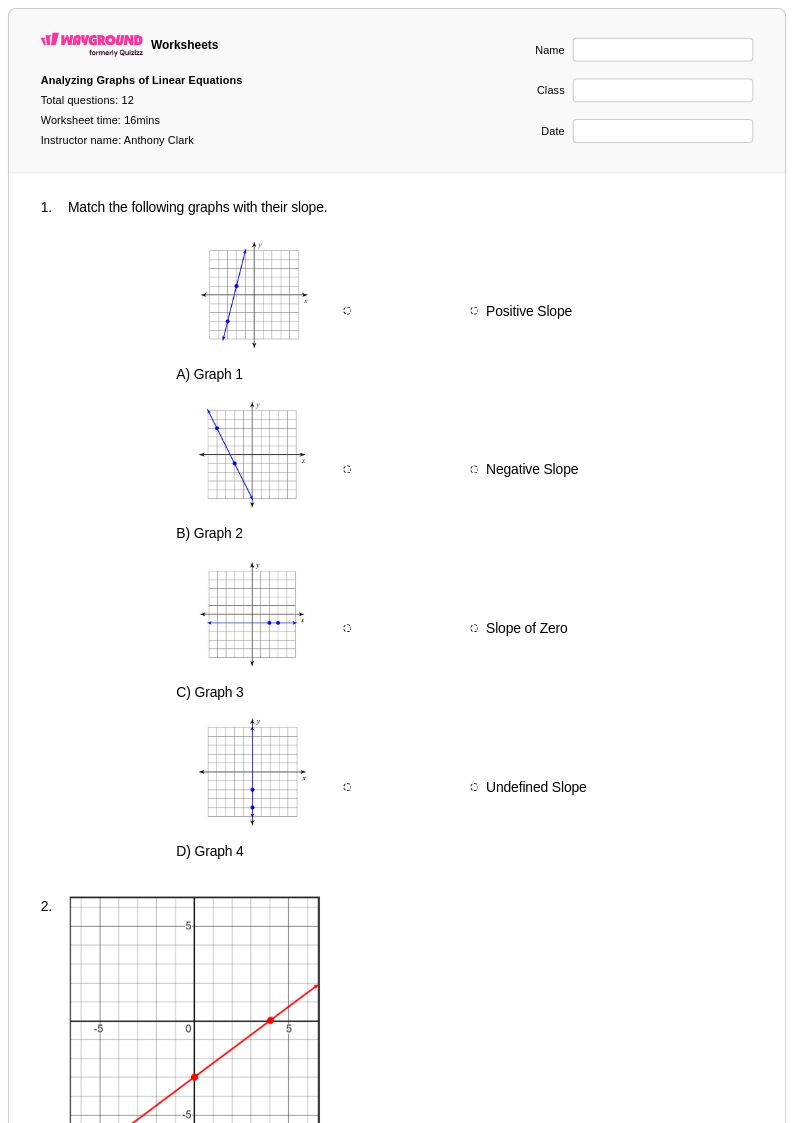
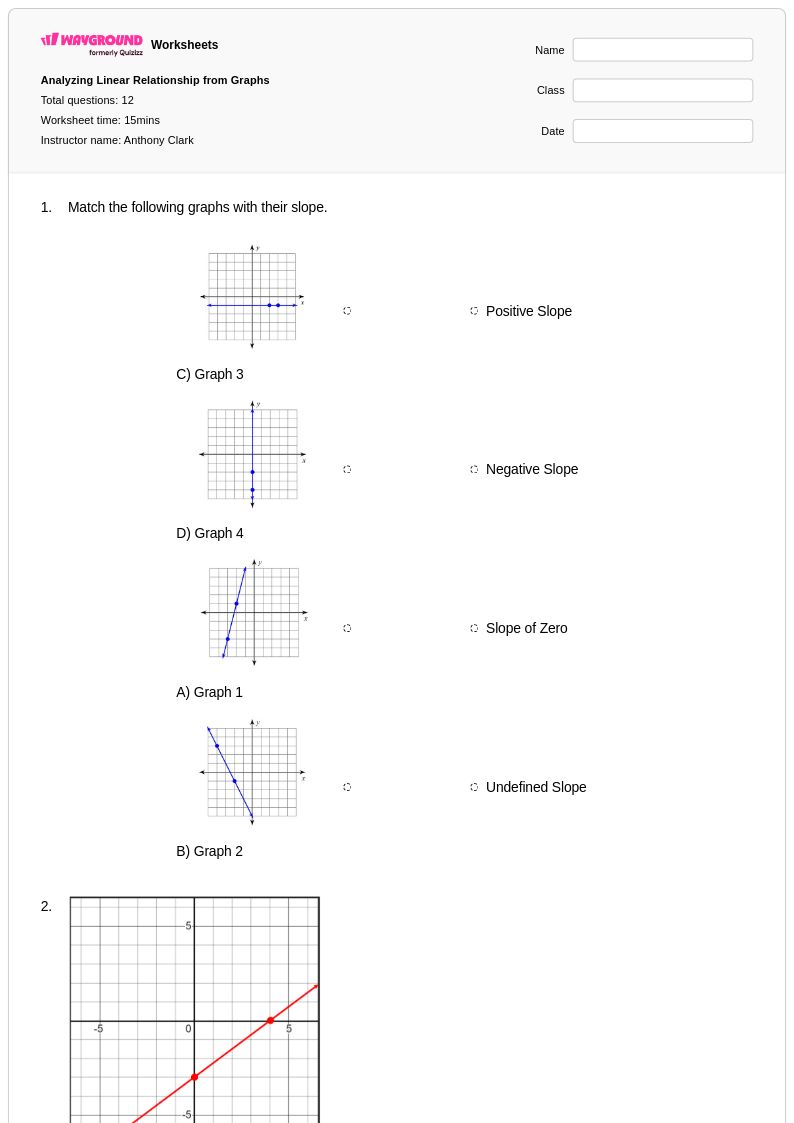
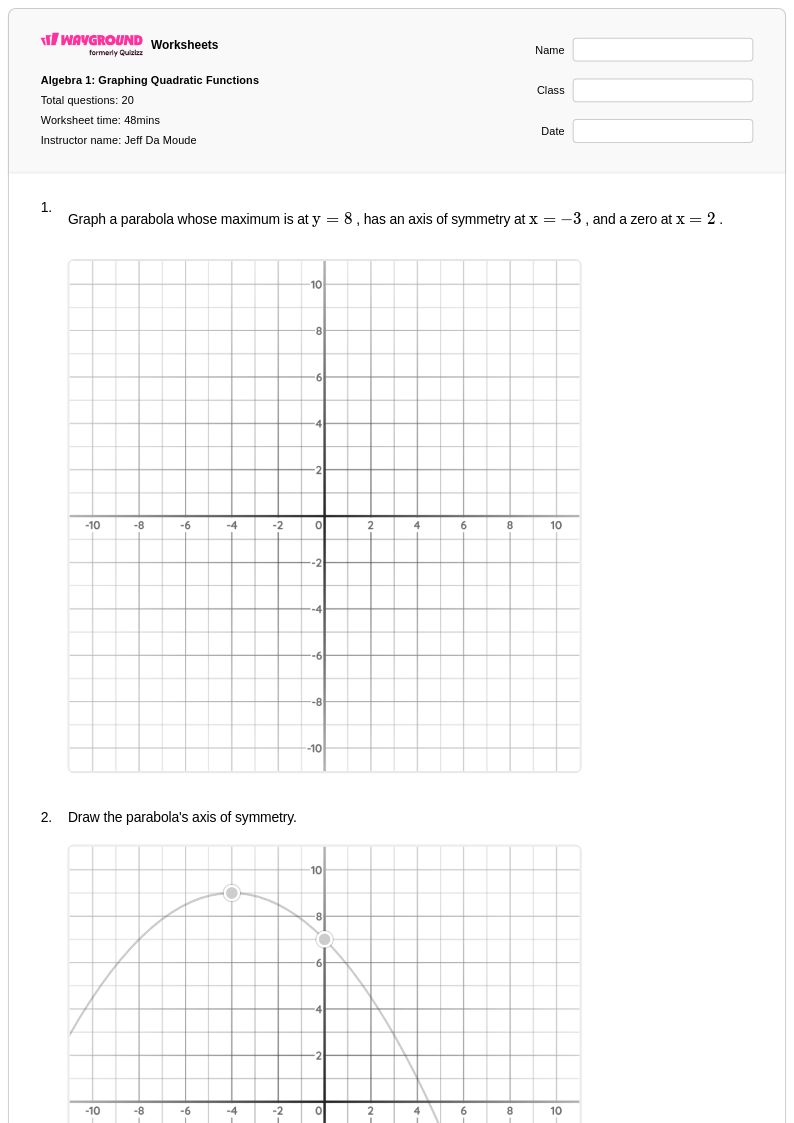
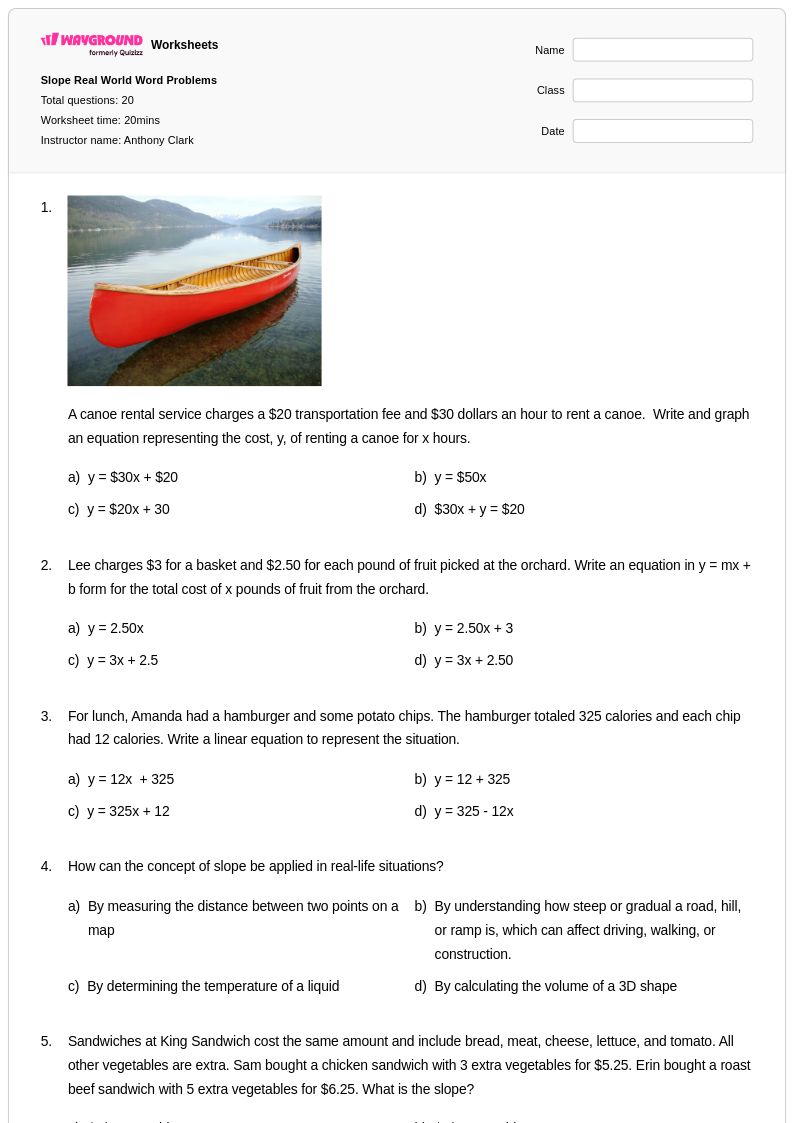
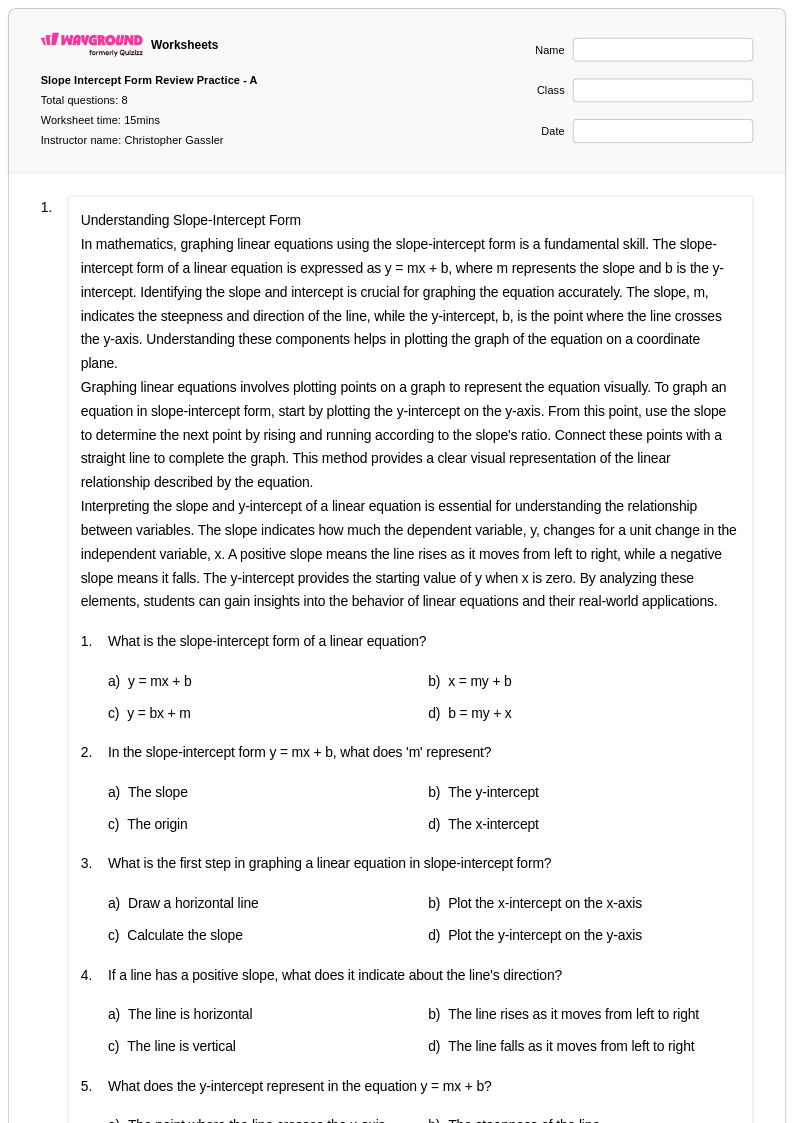
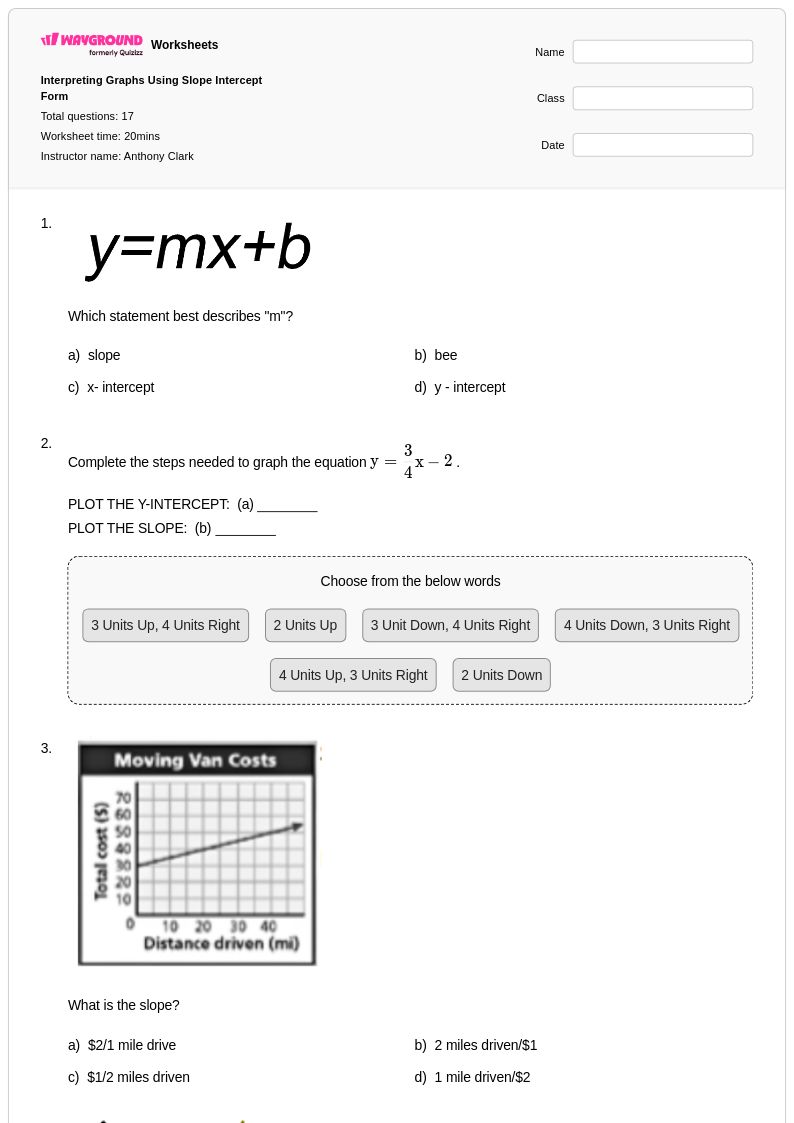
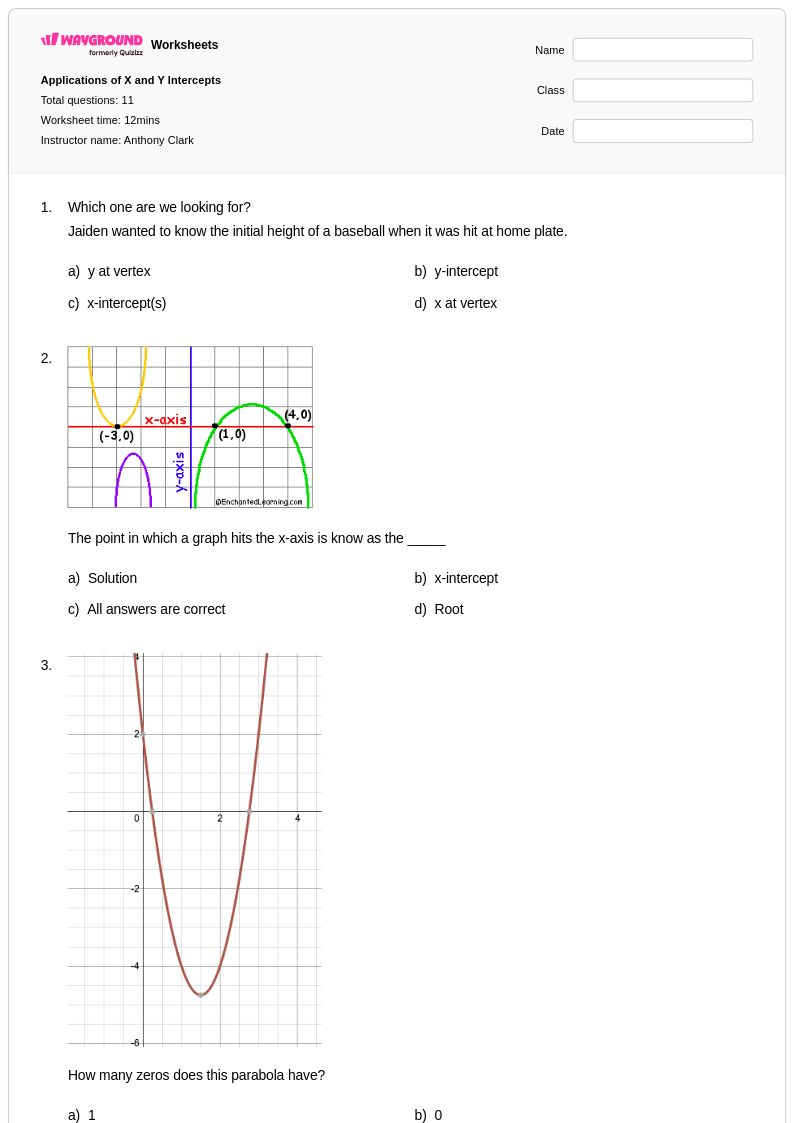
Class 9 graphing real world applications worksheets from Wayground (formerly Quizizz) provide students with essential practice connecting mathematical concepts to practical, everyday situations. These comprehensive worksheets strengthen critical analytical skills by having students interpret data from scenarios such as business profits, population growth, scientific experiments, and economic trends through various graphing techniques. Students develop proficiency in creating and analyzing linear, quadratic, and exponential graphs while learning to identify patterns, make predictions, and draw meaningful conclusions from real data sets. Each worksheet collection includes detailed answer keys and is available as free printables in pdf format, ensuring students can practice independently while receiving immediate feedback on their problem-solving approaches and mathematical reasoning.
Wayground (formerly Quizizz) empowers educators with millions of teacher-created resources specifically designed for Class 9 data and graphing instruction, featuring robust search and filtering capabilities that allow quick access to standards-aligned materials. The platform's differentiation tools enable teachers to customize worksheets based on individual student needs, whether for remediation of foundational graphing concepts or enrichment activities involving complex real-world modeling scenarios. Available in both printable pdf format and interactive digital versions, these resources seamlessly integrate into lesson planning while providing flexible options for classroom instruction, homework assignments, and skill-building practice sessions. Teachers can efficiently identify gaps in student understanding of graphing applications and provide targeted support through the platform's extensive collection of scaffolded practice problems and assessment materials.
FAQs
What are the key graphing concepts for 9th grade math?
In 9th grade, typically during Algebra 1, students deepen their understanding of functions by analyzing and comparing different function families. The focus is on interpreting key features of linear, quadratic, and exponential graphs in the context of real-world problems, and understanding how the structure of an equation relates to the shape of its graph.
How can I help students distinguish between linear, quadratic, and exponential growth?
Use real-world scenarios that exemplify each type of growth. For linear, use constant change like a car traveling at a steady speed. For exponential, use compounding change like population growth or interest. For quadratic, use a scenario with a maximum or minimum value, like the path of a thrown ball. Have students analyze tables and graphs to see how the rate of change differs for each function type.
What are common challenges for 9th graders when graphing functions?
Students often struggle to connect the abstract parameters of an equation (like slope, y-intercept, or the base of an exponent) to their meaning in a real-world context. For example, they might be able to find the y-intercept on a graph but not recognize it as the "initial value" in a word problem. Distinguishing between function types based on a table of values or a problem description is also a common hurdle.
What kind of practice do these Grade 9 worksheets offer?
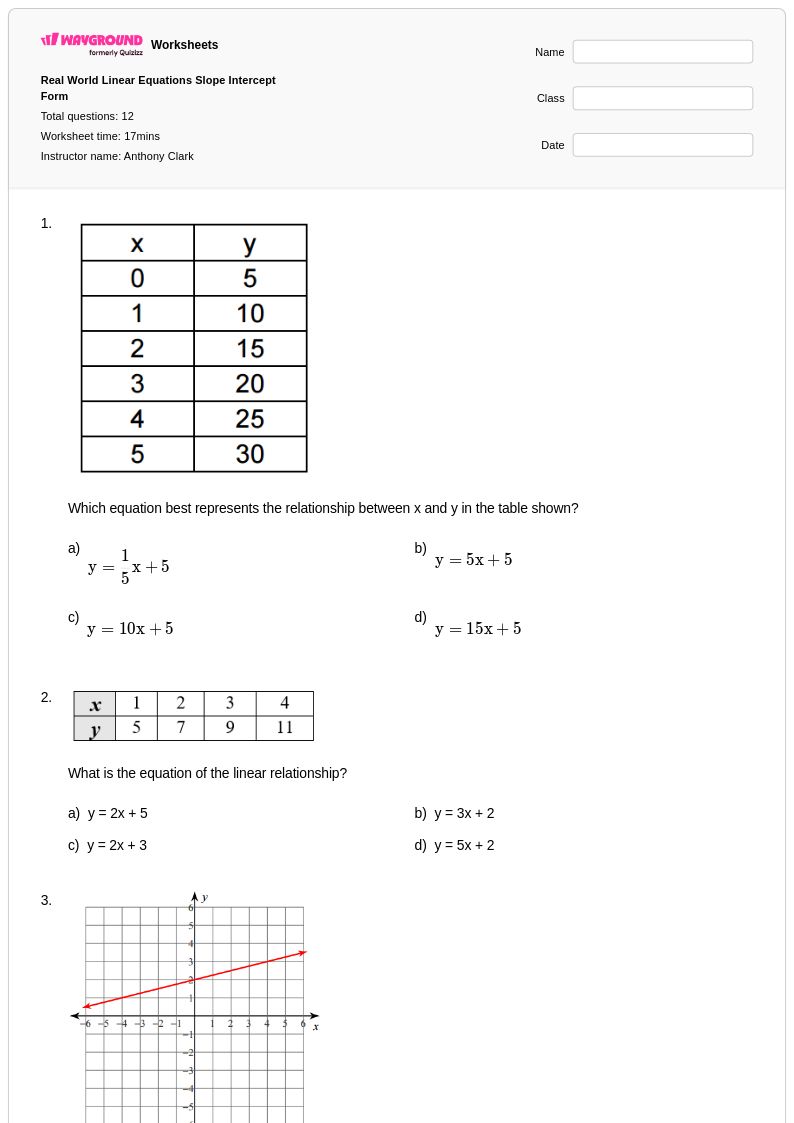
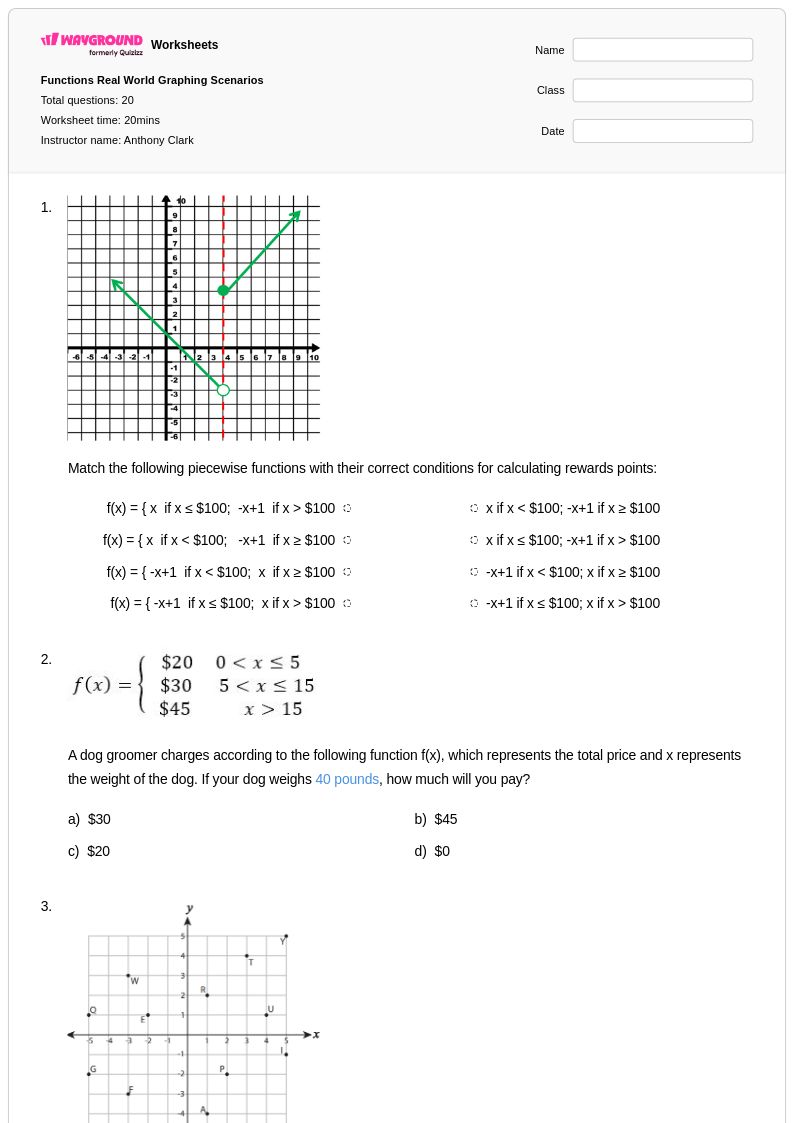
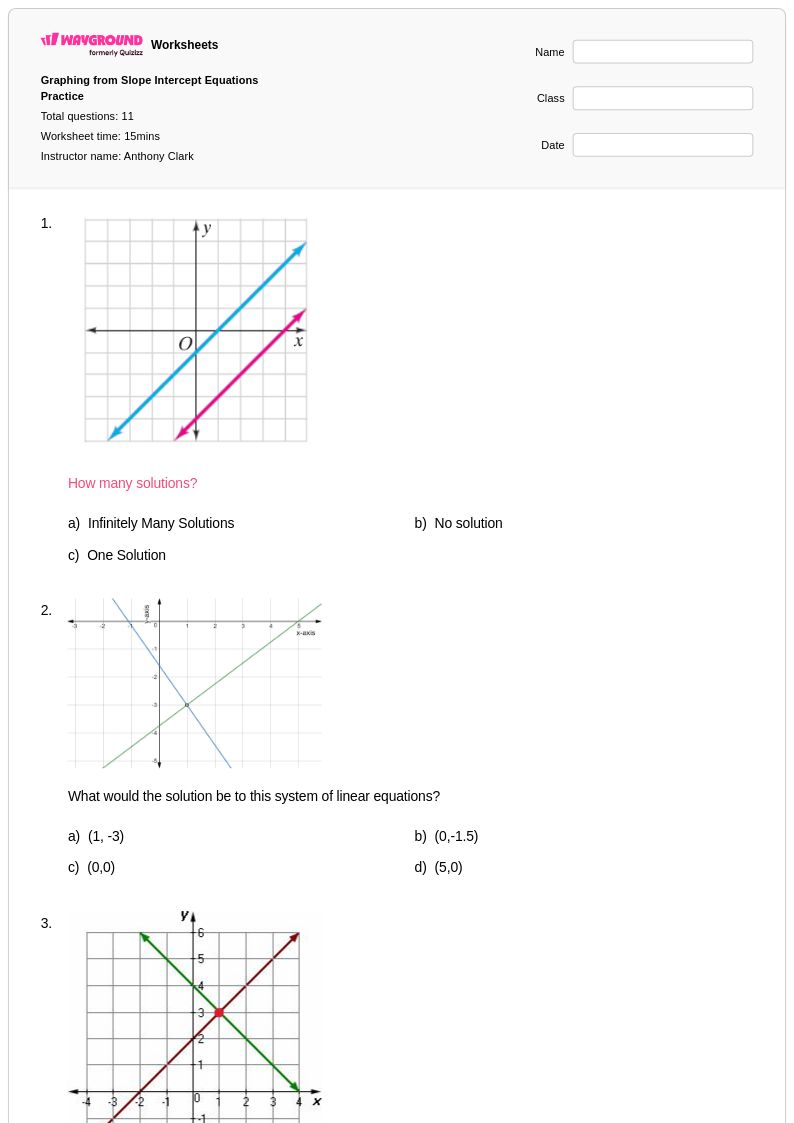
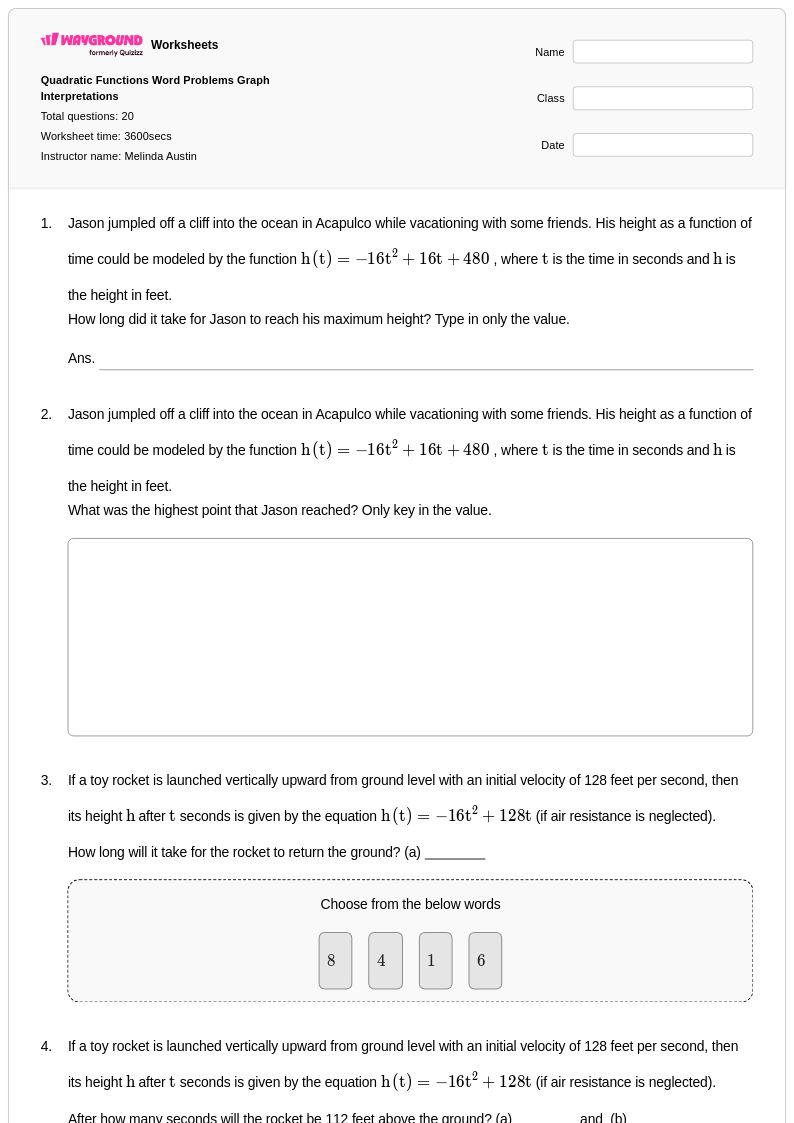
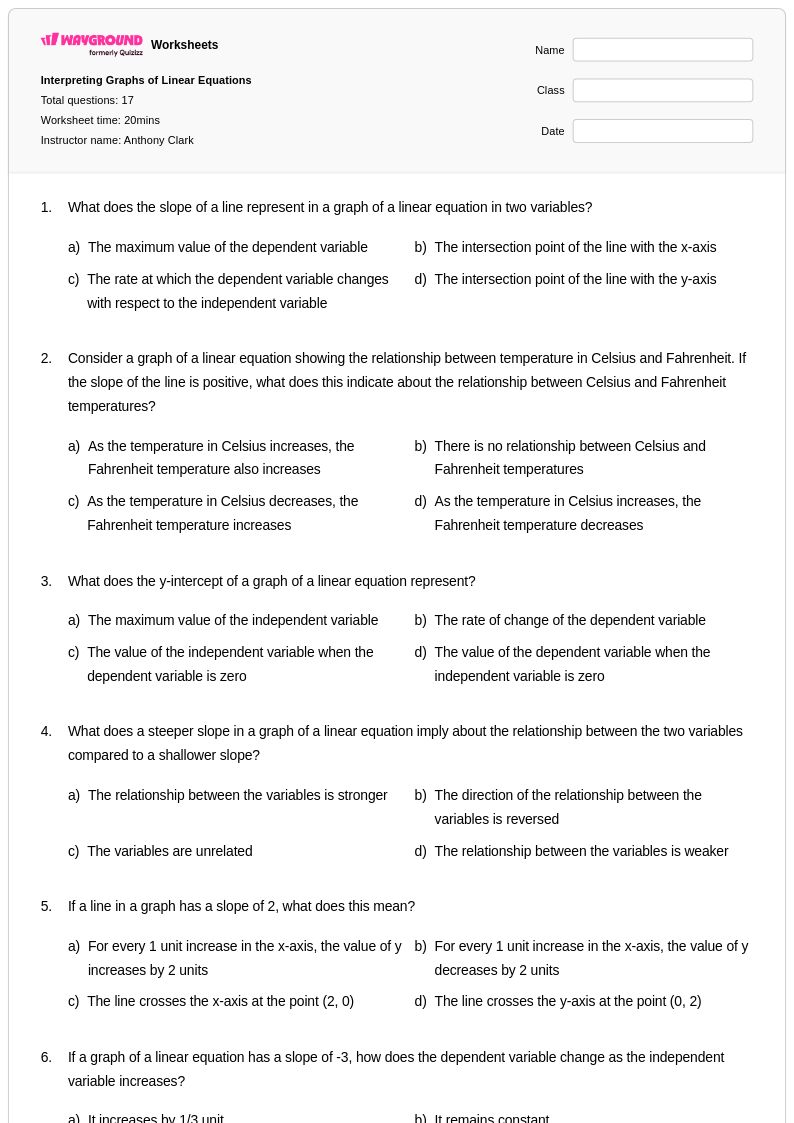
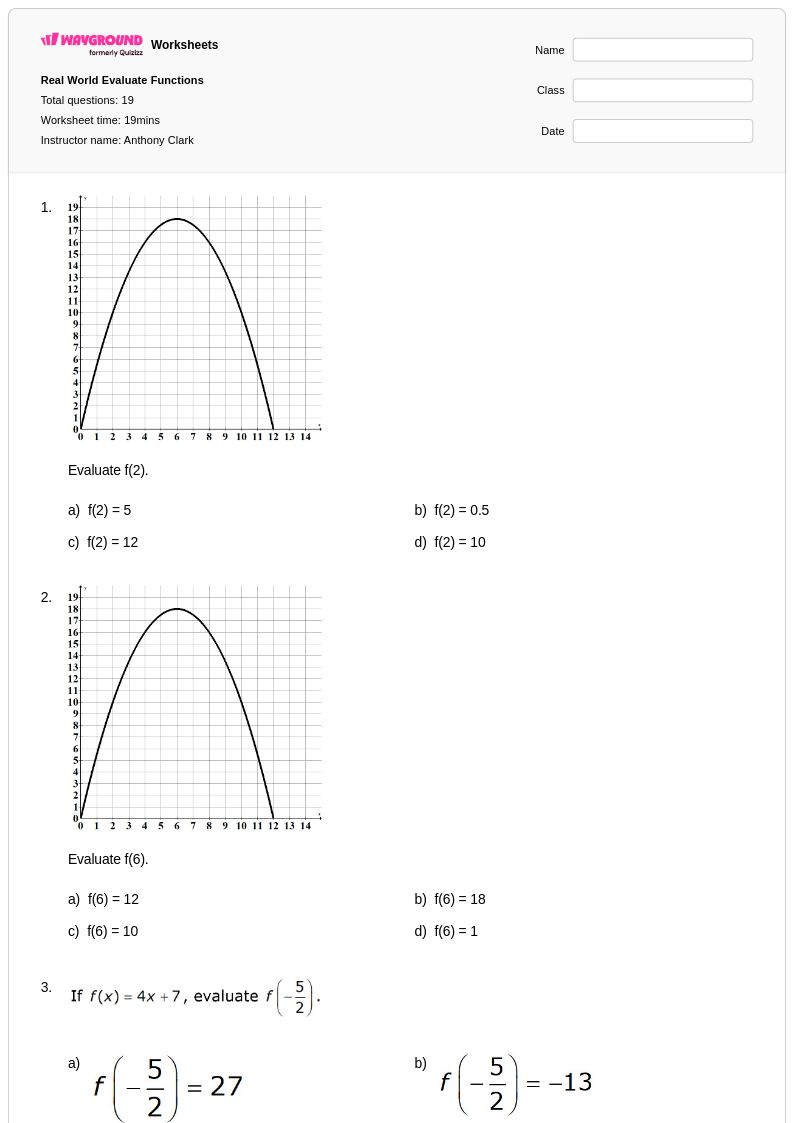
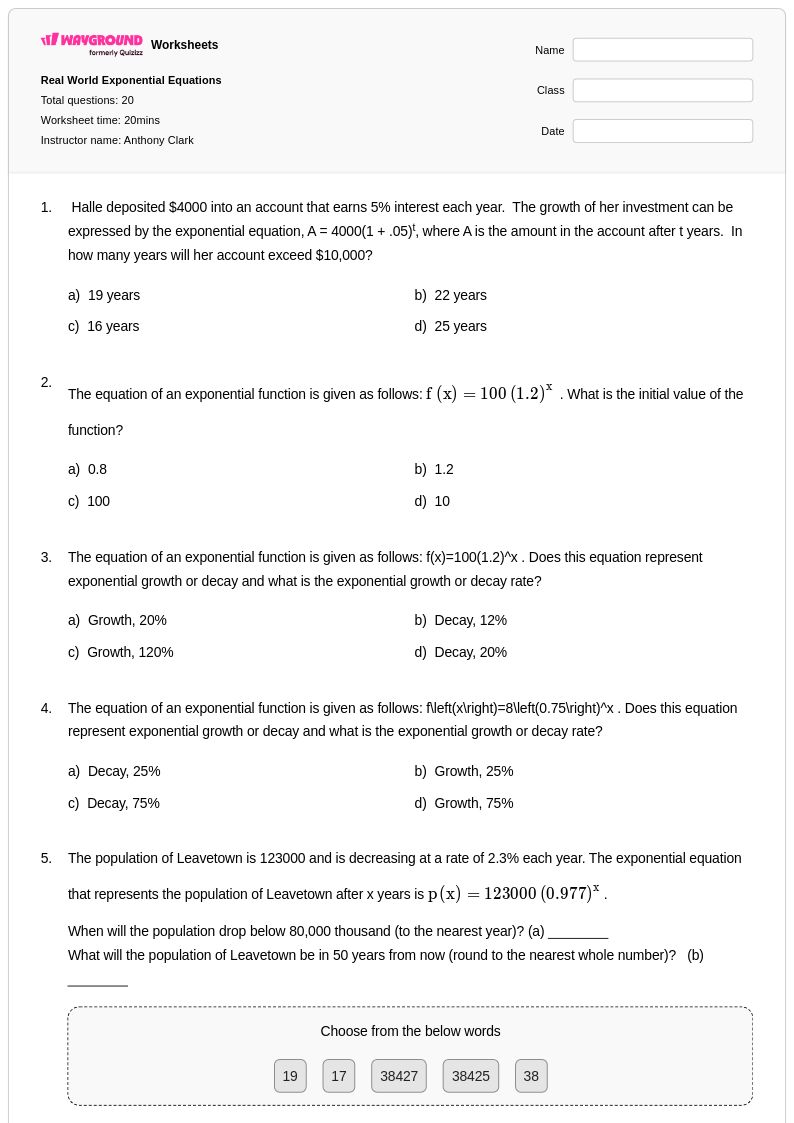
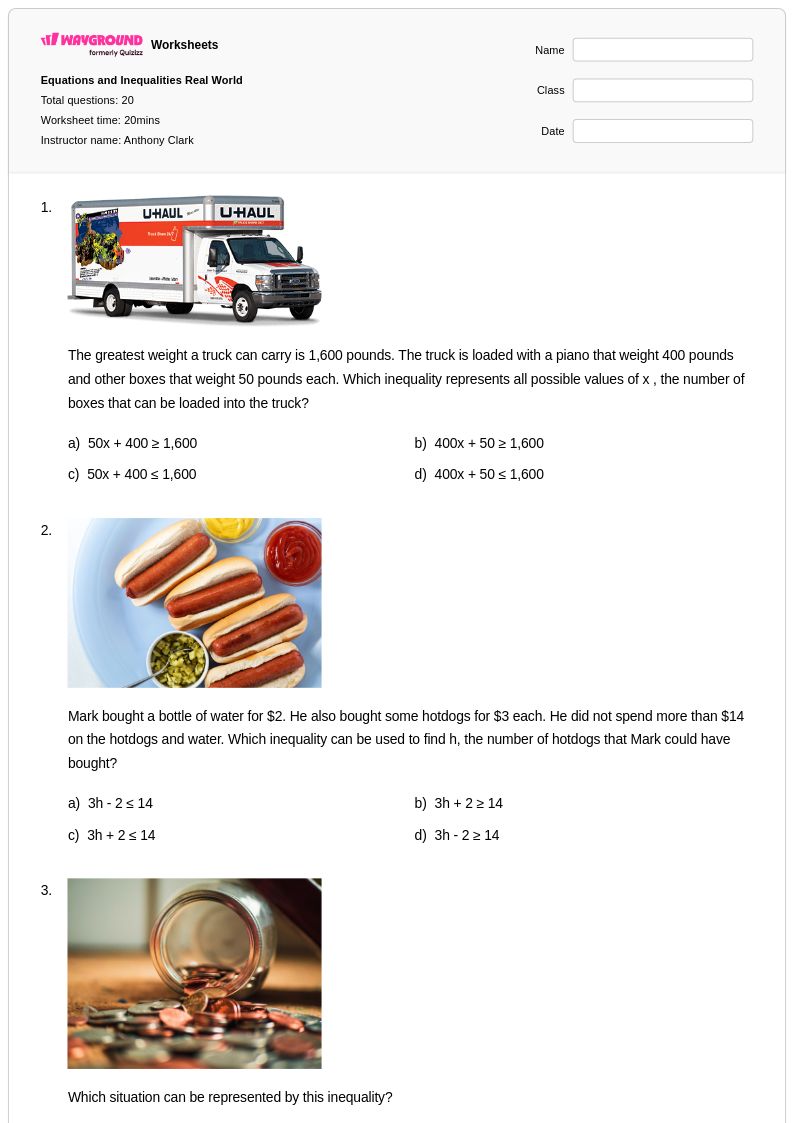
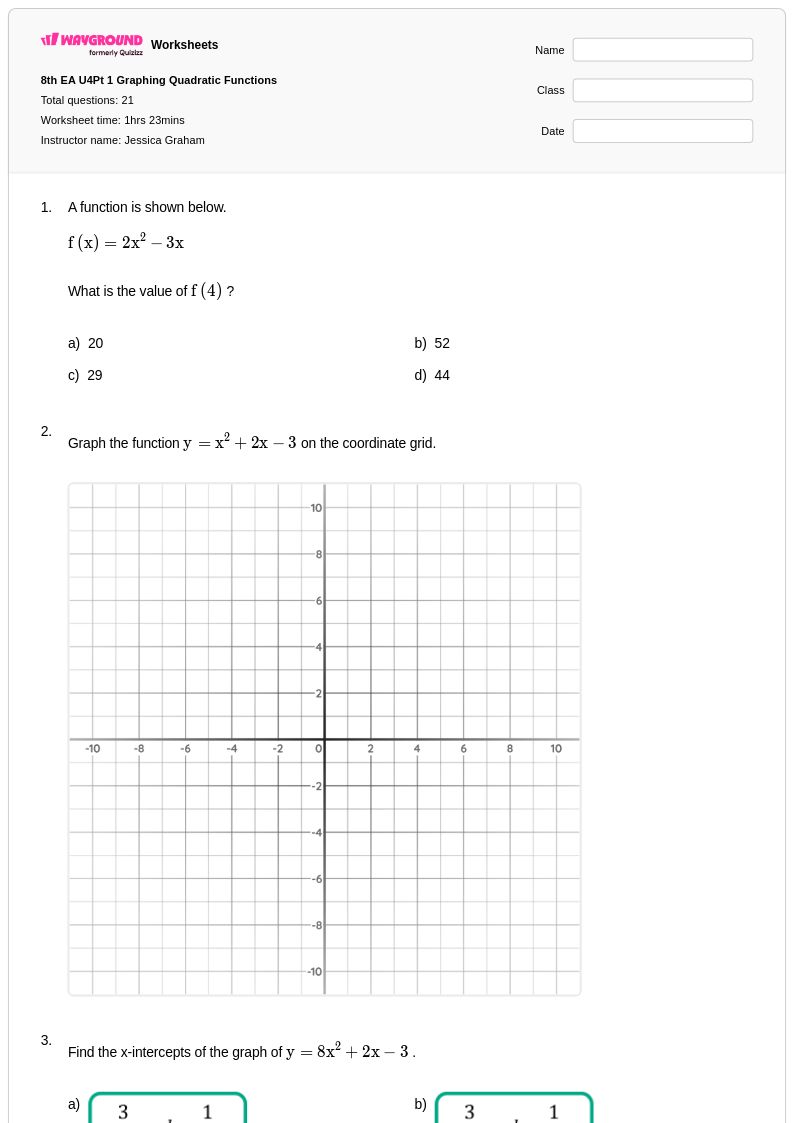
These worksheets challenge students to apply their knowledge of functions to practical scenarios involving business, science, and economics. Students practice creating and analyzing linear, quadratic, and exponential graphs, helping them identify patterns, make predictions, and interpret the meaning of key features like intercepts, maximums, and minimums in a real-world context.
How does this topic fit into the high school math curriculum?
This directly aligns with the Common Core's High School Algebra and Functions standards, particularly "Interpreting Functions" (HSF-IF). The standards require students to analyze functions using different representations and interpret key features of graphs and tables in terms of a real-world context. These worksheets provide targeted practice for building that specific skill.
How can I use these worksheets for different classroom needs?
Wayground's platform allows for easy differentiation. You can assign the standard worksheet digitally or as a printable PDF. For students needing extra support, you can create a modified version with a larger font or enable the Read Aloud feature for digital assignments. For advanced students, these problems can serve as a starting point for deeper modeling projects. Every version includes a full answer key.