
10 Q
9th - 11th
10 Q
10th - Uni
15 Q
9th - Uni
11 Q
8th
25 Q
11th - Uni
10 Q
6th - 8th
25 Q
6th
10 Q
6th
15 Q
6th
16 Q
7th
15 Q
12th
17 Q
6th
17 Q
6th
20 Q
6th
8 Q
6th
20 Q
7th - Uni
15 Q
9th - Uni
6 Q
6th
6 Q
9th - 12th
18 Q
11th
12 Q
6th
15 Q
9th
16 Q
7th
15 Q
9th - 10th
Explore Worksheets by Subjects
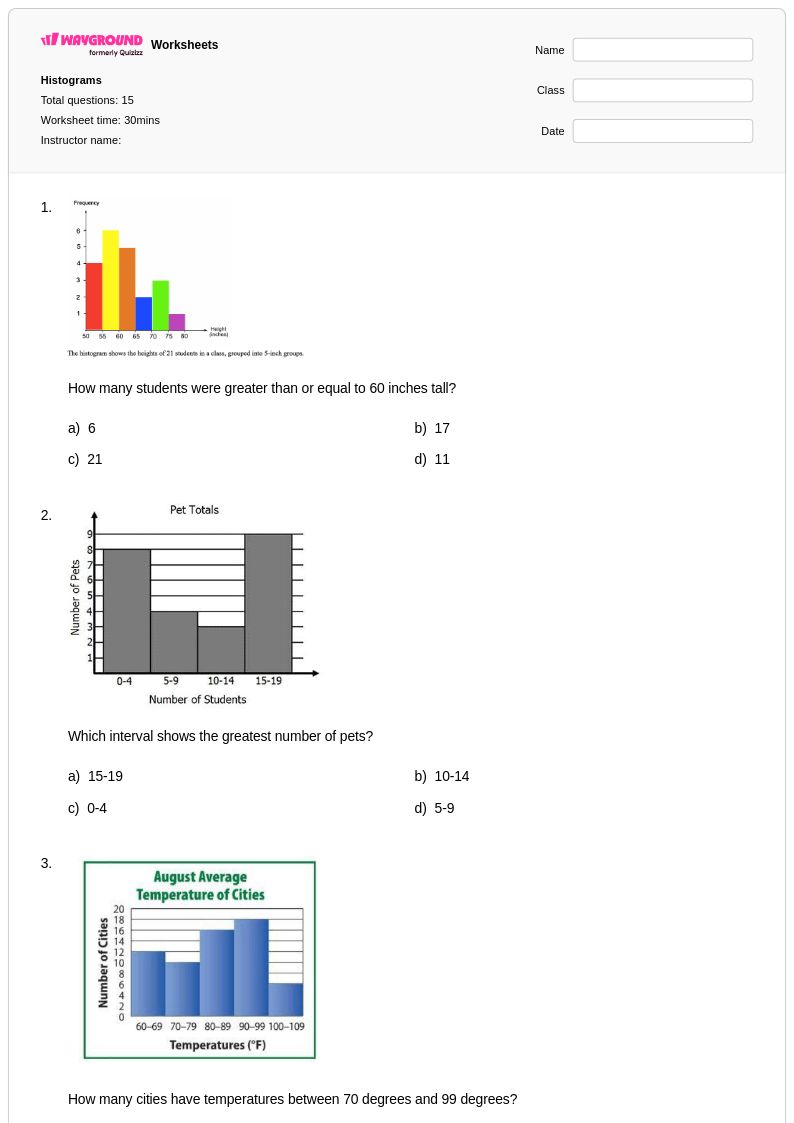
Explore printable Histograms worksheets
Histograms worksheets available through Wayground (formerly Quizizz) provide comprehensive practice opportunities for students to master this essential data visualization technique in mathematics. These expertly designed worksheets guide learners through the fundamental concepts of creating, interpreting, and analyzing histograms, helping them develop critical skills in organizing data into frequency intervals and understanding distribution patterns. Students work through carefully structured practice problems that cover histogram construction from raw data sets, reading and interpreting existing histograms, and comparing different data representations. Each worksheet includes detailed answer keys that support both independent learning and classroom instruction, with free printable pdf formats making these resources easily accessible for immediate use in any educational setting.
Wayground (formerly Quizizz) empowers mathematics educators with an extensive collection of millions of teacher-created histogram worksheets that streamline lesson planning and enhance student outcomes. The platform's robust search and filtering capabilities allow teachers to quickly locate resources that align with specific curriculum standards and learning objectives, while advanced differentiation tools enable customization based on individual student needs and skill levels. These histogram worksheets are available in both printable pdf and interactive digital formats, providing flexibility for traditional classroom instruction, remote learning, or blended educational approaches. Teachers can efficiently address diverse learning requirements through targeted skill practice, implement effective remediation strategies for struggling students, and provide enrichment opportunities for advanced learners, all while maintaining consistent focus on developing strong data analysis and graphing competencies.