
 Worksheets
Prologue Review
Total questions: 105
Worksheet time: 5hrs 42mins

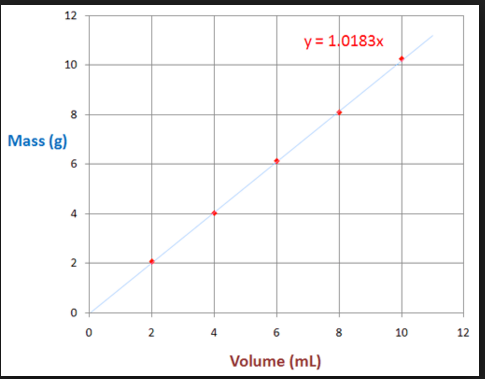


There are 24 cm3 Find the total mass.


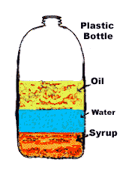
Corn syrup 1.37 g/mL
Vegetable oil 0.91 g/mL
Honey 1.42 g/mL
Lamp oil 0.81 g/mL


What is the volume of this solid?
5 meters 3
17 meters 3
2 meters 3
100 meters 3

water:1.0 g/cm3
honey: 1.36 g/cm3
dish soap: 1.03 g/cm3
corn syrup: 1.33 g/cm3
vegetable oil: 0.91 g/cm3


What is the Density of this substance?
8 grams/ mL
1 g/mL
1 mL
1 g

A climber is on a hike. After 2 hours he is at an altitude of 400 feet. After 6 hours, he is at an altitude of 700 feet. What is the average rate of change?
200 ft/ sec
75 ft/ sec
300 ft/ sec
75 ft/ hr
I see that Mrs. Menelly is holding a coffee cup, I assume that there is coffee in the coffee cup. By making the assumption that there is coffee in the mug, I have made a(n)


What will happen when the objects are placed in a container of water?
Both objects will sink
Object A will float and object B will sink.
Object B will float and object A will sink.
Both objects will float.

What is the mass of the object?
.225 g
1.5 g
32.4 g
2.5 g

Future changes in the environment can best be predicted from data that are
highly variable and collected over a short period of time.
Highly variable and collected over a long period of time.
Cyclic and collected over short periods of time.
Cyclic and collected over long periods of time.

The density of water at 4 degrees Celcius is (see ESRT p 1)
1.0 g/mL
<1.0 g/mL
>1.0 g/mL
In which phase of matter is water most dense?
solid
liquid
gas

The graph below shows temperature readings for a day in April.
The average rate of temperature change, in Fahrenheit degrees per hour, between 6 am and noon was
6o/hr
8o/hr
3o/hr
18o/hr
An observer recorded the times of three successsive high tides at one Earth locations as:
- 7:12 am
- 7:38 pm
- 8:04 am
What was the time of the next high tide?
8:12 pm
8:30 pm
8:38 pm
9:04 pm

The grade shows that high tides at Boston occur approximately every
3.5 hours
6.0 hours
12.5 hours
16.0 hours
The rising and setting of the Sun are examples of
noncylcic events
unrelated events
predictable changes
random motion
Which graph most likely illustrates a cyclic change?


A 50 gram sample of halite was placed in a jar with five other mineral samples and water. the jar was shaken vigorously for 5 minutes. The halite sample was then found to have a mass of 40 grams. What was the rate of weathering of the halite sample?
0.50 g/min
2.0 g/min
3.0 g/min
10.0 g/min

What is the mass of this object?
0.5 g
2 g
18 g
36 g

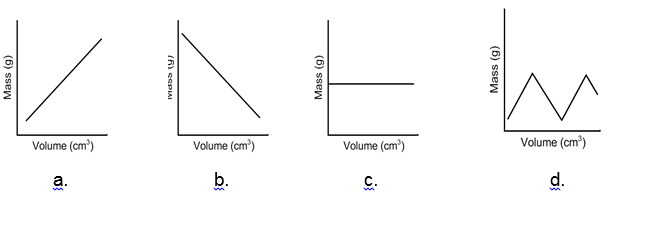
Which graph best represents the relationship between the mass and volume of various-sized pieces of this material?


If the material is heated and expands, the density of the material will
decrease
increase
remain the same

When this material is placed in a container of water, it sinks to the bottom of the container. Compared to the density of water, the density of this material is
less
greater
the same
Under the same conditions of temperature and pressure, three different samples of the same uniform substance will have the same
shape
density
mass
volume

What is the density of cube A?
0.2 g/cm3
5.0 g/cm3
12.8 g/cm3
64.0 g/cm3
Which graph best represents the relationship between the density of a substance and its state of matter (phase) for most earth materials, excluding water?


The diagram at the right represents a cylinder which contains four different liquids, W, X, Y and Z, each with a different density as indicated. A piece of solid sulfur 2.0 g/cm3 is placed on the surface of liquid W. When the sulfur is released, it will pass through
W, but not X, Y or Z
W and X, but not Y or Z
W, X, Y but not Z
W, X, Y and Z

A student accurately measured the mass of a sample of one of the four minerals to be 294.4 grams and its volume to be 73.6 cm3. Which mineral sample the student measure?
corundum
galena
hematite
quartz

What is the density of this mineral?
6.0 g/cm3
9.0 g/cm3
3.0 g/cm3
4.5 g/cm3

Which two substance could be made of the same material?
A and B
B and E
C and D
A and E

Water (W) was added to the graduated cylinder containing liquid C. Objects A and D were then added into the cylinder. Which diagram most accurately shows the resulting arrangement of these pieces?


The reason ice floats is that, compared to liquid water, solid ice
has less mass
has more mass
is less dense
is more dense

Which graph best represents the relationship between the density and the volume of these minerals?


Using a ruler to measure the length of a stick is an example of
predicting the length of the stick by guessing
extending the sense of sight by using an instrument
calculating the percent of error by using a proportion
measuring the rate of change of the stick by making inferences

The graph below shows the relationship between mass and volume for three samples, A, B, and C, of a given material.
1.0 g/cm3
5.0 g/cm3
10.0 g/cm3
20.0 g/cm3
As distance increases, gravitational forces:
Decrease
increase
Disappear
Stay the same
As mass increases, gravitational forces:
Increase
decrease
stay the same
disappear


What is the density of an object with a mass of 50g and a volume of 10cm3?
5 g/cm3
0.2 g/cm3
500 g/cm3
50 g/cm3
If a liquid has a density of 0.8 g/mL, will it float or sink in water?
Float
Sink
What happens when a parcel of air warms?
The density increases.
The density decreases.
There is no change in density.

How many hours apart are the high tides?
6 hours
12 hours
24 hours
1 hour
What is the volume of a sphere that measures 12.0 grams and shows a density of 0.8 g/ml?
12.0 mL
15.0 mL
20.0 mL
5.0 ml

The average rate of temperature change, in Fahrenheit degrees per hour, between 6 am and 2 pm was:
1.8 °F/hour
2.8 °F/hour
3.5 °F/hour
1.2 °F/hour
Using a ruler to measure the length of a stick is an example of
predicting the length of the stick by guessing
extending the sense of sight by using an instrument
calculating the percent of error by using a proportion
measuring the rate of change of the stick by making inferences
An object with an extremely high mass and a very small volume would have
a very low density
a very high density
a density that cannot be calculated
a rate that is very large
Which of the following is a correct example of making an inference?
Measuring the length of a table
Noticing that the sky is dark and concluding it might rain
Recording the temperature of a liquid
Counting the number of students in a classroom
Which graph most likely illustrates a cyclic change?


Which statement about a major hurricane is an inference?
The windspeed is measured at 200 km/hr.
The central air pressure is recorded at 946.0 mb.
A rain gauge records three inches of rain in less than one hour.
Damage from the storm is expected to be extensive.
The primary purpose of a classification system is to enable people to
make measurements that are very accurate
eliminate inaccurate inferences
organize observations in a meaningful way
extend their powers of observation
A way of expressing an observation with greater accuracy or
precision. They are based on a known standard. ex. foot, minute.
Rate of Change:
Mass:
Measurement:
Volume:
How much (quickly or slowly) something (field value) changes
over time.
Rate of Change:
Scientific Notation:
Measurement:
Observation:
An observer recorded the times of three successsive high tides at one Earth locations as:
- 7:12 am
- 7:38 pm
- 8:04 am
What was the time of the next high tide?
8:12 pm
8:30 pm
8:38 pm
9:04 pm
The rising and setting of the Sun are examples of
noncylcic events
unrelated events
predictable changes
random motion

The rate of temperature change for the water in cup A for the first 10 minutes was approximately
0.77 oC/min
1.3 oC/min
7.7 oC/min
13.0 oC/min

Which statement correctly describes the relationship between the variables on the graph?
As density increases, water vapor content decreases
As water vapor content increases, density decreases
As water vapor content increases, density increases
As water vapor content increases, density stays the same
Which graph most likely illustrates a direct relationship?

