
 Worksheets
Unit 3 - Linear Functions
Total questions: 47
Worksheet time: 1hrs 16mins
Name
Class
Date
1.

Find the slope.
a)
4
b)
-4
c)
undefined
d)
0
2.

Find the slope.
a)
0
b)
4
c)
-4
d)
Undefined
3.
Jacob collects hats. He has 6 hats already, and he collects 2 hats a week.
a)
y = 2x + 6
b)
y = 6x + 2
c)
y = 2x - 6
d)
y = 6x - 2
4.
Identify the x and y intercepts
4x - 5y = 40
4x - 5y = 40
a)
x intercept is 10
y intercept is 8
y intercept is 8
b)
x intercept is 10
y intercept is 20
y intercept is 20
c)
x intercept is 8
y intercept is 10
y intercept is 10
d)
x intercept is 10
y intercept is -8
y intercept is -8
5.

Write the equation of the line.
a)
y=⅗x+1
b)
y=⅗x-1
c)
y=(5/3)x+1
d)
y=(3/5)x+1
6.
Write the equation in point-slope form of the line that passes through the given point and has the given slope.
(4, -7); m = -1/4
(4, -7); m = -1/4
a)
y - 7 = -1/4(x - 4)
b)
y - 4 = -1/4(x + 7)
c)
y+ 7 = 4(x - 4)
d)
y + 7 = -1/4(x - 4)
7.
For the equation
y - 3 = 2(x + 4),
which of the following is true?
y - 3 = 2(x + 4),
which of the following is true?
a)
The line has m = 2 passing through the point (4, -3)
b)
The line has m = 2 passing through the point (3, -4)
c)
The line has m = 2 passing through the point (-4, 3)
d)
The line has m = 2 passing through the point (-3, 4)
8.

What is the y-intercept of the line?
a)
(0, 4)
b)
(0, -1)
c)
(0, 1)
d)
(0, -4)
9.

Find the slope.
a)
7/3
b)
-7/3
c)
3/7
d)
-3/7
10.
Before a bowler rolls her first ball, 10 pins are standing. The number of pins left standing, y, is a function of the number of pins she knocks down. What is the range of the function?
a)
{ 0, 1, 2, 3, 4, 5, 6, 7, 8, 9, 10 }
b)
{ 1, 2, 3, 4, 5, 6, 7, 8, 9, 10 }
c)
y ≤ 10
d)
0 ≤ y ≤ 10
11.
Slopes of parallel lines are...
a)
opposite reciprocals.
b)
opposites.
c)
identical.
d)
always 7.
12.
Slopes of perpendicular lines are...
a)
opposite reciprocals.
b)
opposites.
c)
identical.
d)
always 7.
13.
A line is perpendicular to y = 2x - 7.
What is the slope of this line?
What is the slope of this line?
a)
-2
b)
1/2
c)
-1/2
d)
2
14.
What is the slope of a line parallel to the line whose equation is: -2x + y = - 7?
a)
-2
b)
1/2
c)
-1/2
d)
2
15.

Write the equation of the line in SLOPE-INTERCEPT FORM given the equation:
a)
a
b)
b
c)
c
d)
d
16.

Write the equation of the line in STANDARD FORM given 2 points.
a)
a
b)
b
c)
c
d)
d
17.

Write the equation of the line in POINT-SLOPE FORM given 2 points.
a)
a
b)
b
c)
c
d)
d
18.

What is the y-intercept of the line?
a)
(0, 2)
b)
(0, -2)
c)
(0, 1)
d)
(0, -1)
19.
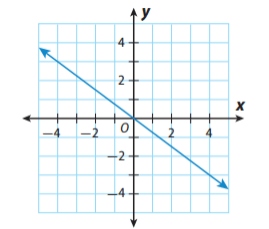
Find the slope of the line.
a)
4/3
b)
-4/3
c)
3/4
d)
-3/4
20.
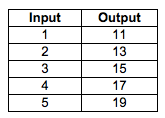
Find the rate of change
a)
1
b)
2
c)
11
d)
Not a constant slope/Non-Linear
21.
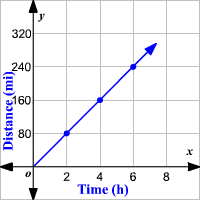
What is the rate of change for the following graph?
a)
80
b)
20
c)
40
d)
160
22.
Which of the following are ways to find the rate of change?
a)
change in y over change in x
b)
rise over run
c)
subtract y coordinates over subtract x coordinates
d)
all of the above
23.

a)
Taylor can write 6 words per minute
b)
Taylor can write 25 words per minute
c)
Taylor can write 50 words per minute
d)
Taylor can write 150 words per minute
24.
What is the linear parent function
a)
y = x
b)
y = -x
25.
From the line y = x, which line become half as steep, reflected and moved up 10 units
a)
y = 2x + 10
b)
y = -1/2x - 10
c)
y = -1/2x + 10
d)
y = 1/2x + 10
26.
Troy graphed the line of the equation f(x) = 5x + 2. Sarah
graphed the line of the equation g(x) = 5x – 2 on the same
coordinate plane. Which of the following statements best
describes the line that Sarah graphed?
graphed the line of the equation g(x) = 5x – 2 on the same
coordinate plane. Which of the following statements best
describes the line that Sarah graphed?
a)
Less steep by 2
b)
Vertical shift up 4
c)
Vertical shift down 4
d)
Steeper by 2
27.

Which line is the steepest?
a)
Blue because the equation has +4
b)
Red because it is the parent function
c)
Blue & Green have the same steepness
d)
Pink because the equation has a 5
28.
What type of correlation has one value increasing as the other value is also increasing?
a)
positive
b)
negative
c)
no
d)
Is JK throwing a water bottle?
29.
What would be the correlation be between study time and test grades?
a)
positive correlation
b)
negative correlation
c)
no correlation
d)
cannot be determined
30.

What type of association does this graph have?
a)
positive
b)
negative
c)
none
d)
all of the above
31.

Which sentence describes the relationship shown on this scatter plot?
a)
As the temperature decreases, the visitors increase.
b)
As the temperature increases, the number of visitors increases.
c)
As the visitors increase, the temperature decreases.
d)
No correlation
32.

What is the line of best fit?
a)
f(x)= 5x+1.82
b)
cannot be determined
c)
f(x)= 1.82x + 5.02
d)
f(x)= 1.1x + 4.2
33.

What type of association does this graph have?
a)
positive
b)
negative
c)
none
d)
all of the above
34.
How did the equation shift from the parent function? y=x+7
a)
Up 7
b)
Down 7
c)
Less steep
d)
Steeper
35.

Describe the correlation in the graph shown.
a)
Weak Negative
b)
Weak Positive
c)
Strong Negative
d)
Strong Positive
36.
Which of the following statements shows a relationship that is correlated but not causal?
a)
The amount of rainfall received and level of water in the lake.
b)
The number of lights left on each day and the amount of the electric bill.
c)
The increase of warm, sunny days and the number of ice cream vendors visible.
d)
The number of hours worked and how much money is made.
37.
Order the following equations from steeper to less steep.
1. y=5x
2. y=1/2x
3. y=3x
4. y=1/3 x
1. y=5x
2. y=1/2x
3. y=3x
4. y=1/3 x
a)
1, 3, 2, 4
b)
2, 4, 3, 1
c)
1, 2, 4, 3
d)
2, 3, 4, 1
38.

What is the type of correlation?
a)
Negative
b)
no correlation
c)
positive
39.

Which scatter plot shows a linear relationship between x and y?
a)
Graph A
b)
Graph B
c)
Graph C
d)
Graph D
40.

What type of association does this graph show?
a)
Positive
b)
negative
c)
none
d)
all of the above
41.
How did the equation y=1/2x shift from the parent function f(x)=x?
a)
Steeper
b)
shift up
c)
Less steep
d)
shift down
42.
What is the linear parent function?
a)
f(x) = x
b)
y = mx + b
c)
f(x) = 2x
d)
f(x) = y
43.
Which is an example of NO correlation?
a)
The age of a child and their shoe size.
b)
The age of a child and the amount of pets owned.
c)
The age of a child and their height.
d)
The age of a child and the amount of vocabulary words learned.
44.
Which of the following statements shows a causal relationship and not just a correlated one?
a)
An
individual's decision to work in construction and his diagnosis of skin cancer.
b)
A
decrease in temperature and the increase in attendance at an ice skating rink.
c)
As a child's weight increases so does her vocabulary.
d)
The
number of minutes spent exercising and the amount of calories burned.
45.

Which of the following shows the correlation coefficient and the equation for the line of best fit for the data in the table?
a)
0.93; y = .02x + 65
b)
0.93; y = 39x - 2455
c)
0.86; y =.02x + 65
d)
0.86; y = .02x + 65
46.

The table shown is comparing a person's foot length to their height in cm. Calculate a line of best fit.
a)
f(x) = 25.05x + 5.57
b)
f(x) = 5.57x + 25.05
c)
f(x) = -5.57x + 25.05
d)
f(x) = 5.57x - 25.05
47.

Describe the correlation in the graph shown.
a)
Strong Negative
b)
Strong Positive
c)
Weak Negative
d)
Weak Positive
100 %

