
 Worksheets
Scientific Method
Total questions: 72
Worksheet time: 1hrs 10mins

I. Background Research
II. Test Hypothesis
III. Ask Question
IV. Communicate Result
V. Construct Hypothesis
VI. Analyze Data and Draw Conclusions


Based on the data in the table, how many students played the three games that had the highest frequency?
62
57
60
61

Based on the graph, how many more students are in the science club than the book club?
20
16
46
18

The graph shows how employees at Disney World travel to work. How many employees ride bikes, ride the bus, or walk to work?
300
450
325
375

How many more people voted for Garza than Price and Turner combined?
8
26
23
33

The bar graph shows data about the pets owned by math students in four classes. One bar is missing from the graph. If the students have a total of 32 dogs, which bar shows the number of dogs Ms. Davalos's class has?


The number of teachers at four schools are shown in the bar graph below. The number of teachers at school S is missing. There are a total of 56 teachers at schools S, T and V. Which bar graph represents the number of teachers at school S?







A restaurant recorded the number of pizzas sold each month for one year. The data are shown in the graph below. During which month did the restaurant sell 40 pizzas?
March
May
July
August

At what rate did the temperature decrease between the 20th and 25th minutes of the experiment?
10°C in 5 min
10°C in 10 min
5°C in 5 min
5°C in 10 min

Which month had the biggest difference between the high and low temperatures?
January
April
October
November
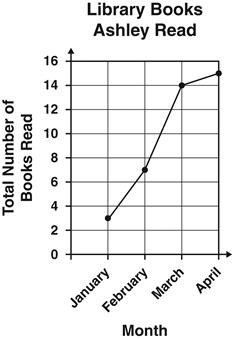
The graph below shows the total number of books Ashley had read by the end of each month for four months. During which month did Ashley read the fewest number of books?
January
February
March
April

Annie recorded the amount of rain that fell each day. The results are shown in the line graph below. How many centimeters of rain fell on the third day?
2
3
4
7


The graph shows the number of inches a plant grew each week.
Between which 2 weeks did the plant grow the MOST?
Week 1 and Week 2
Week 2 and Week 3
Week 3 and Week 4
Week 4 and Week 5
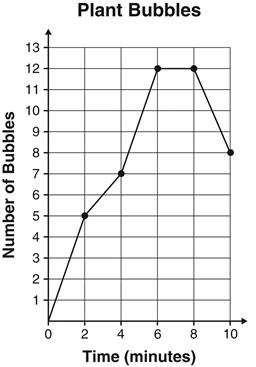
During an experiment, students counted the number of bubbles given off by water plants every 2 minutes during a 10-minute period. The results are graphed below.
At which two times were the same number of bubbles given off?
2 and 4 minutes
4 and 6 minutes
6 and 8 minutes
8 and 10 minutes






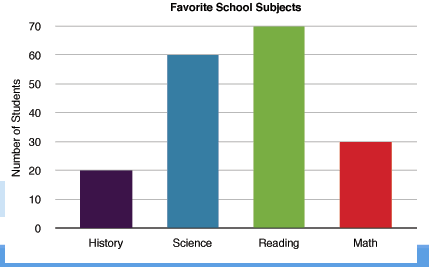
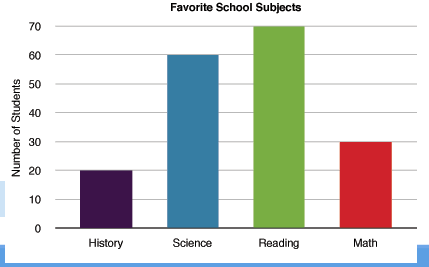
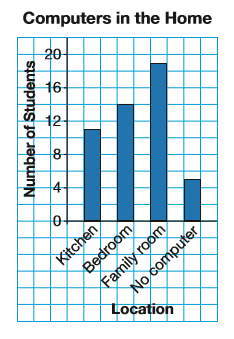
How many students were asked?
48 students
49 students
51 students
52 students
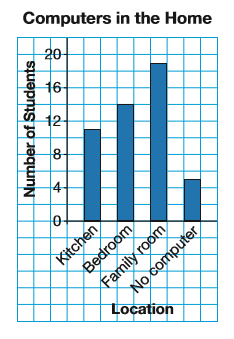
Which room had the second most votes?
Kitchen
Bedroom
Family Room

How many more boxes were recycled in week 2?
8
6
4
2


How many birds are represented by the green sector?
5
20
9
13

