
 Worksheets
Exuberant Ecology Exam Review
Total questions: 75
Worksheet time: 1hrs 27mins


The non-living part of an ecosystem
Grass
Bacteria
Biotic
Abiotic


Different populations living and interacting with each other in the same area
Biosphere
Ecosystem
Community
Niche

The area between the highest mountain and the deepest ocean where life can be found
Biosphere
Population
Community
Ecosystem


A pond ecosystem is shown in the diagram below. Which statement describes an interaction that helps maintain the dynamic equilibrium of this ecosystem?
Which statement describes an interaction that helps maintain the dynamic equilibrium of this ecosystem?
The frogs make energy available to this ecosystem through the process of photosynthesis.
The algae directly provide food for both the rotifers and the catfish.
The green-backed heron provides energy for the mosquito larvae.
The catfish population helps control the populations of water boatman and waterfleas.
What does every food chain start with? (Even if it's an abiotic factor that is not drawn or written there!)
producers
sun
consumer
decomposers


Which one is not a carnivore?
anemone
bear
shark
vulture





The table provides information on population density of mayflies (prey), a kind of insect, in a certain area over a few years. Many birds (predators) eat these mayflies.
Use the data about mayflies (prey) to predict which time period had the greatest increase in the bird (predator) population.
2005-2006
2006-2007
2007-2008

The chart shows predator and prey relationships in four different ecosystems.. Which is a correct example of a change that would happen to one population because of a change in the other population because of a predator/prey relationship?
When the population of sharks decreases because of fishing, the population of small fish will decrease.
When the population of sharks decreases because of fishing, the population of small fish will decrease.
During hunting season when many deer are killed by hunters, the mountain lion population will decline.
When the mice population increases due to having more resources, the population of snakes will decrease.

The graphs show how the number of mice predators (animals that eat mice) and the food source of the mice (plants) changed from 1996 to 2002.
Based on this information about predators and food, which year would you predict would have the highest population of mice?
1996
1998
2000
2002
This occurs when niches overlap between species and they have to compete for resources.
competition
interspecific
parasite
intraspecies

Leeches are organisms that live in ponds and feed on the blood of fish and other animals. They produce enzymes which cause the animal on which they feed to continue bleeding even after the leech is done feeding. What type of relationship does this describe?
mutualism
commensalism
parasitism
intraspecies

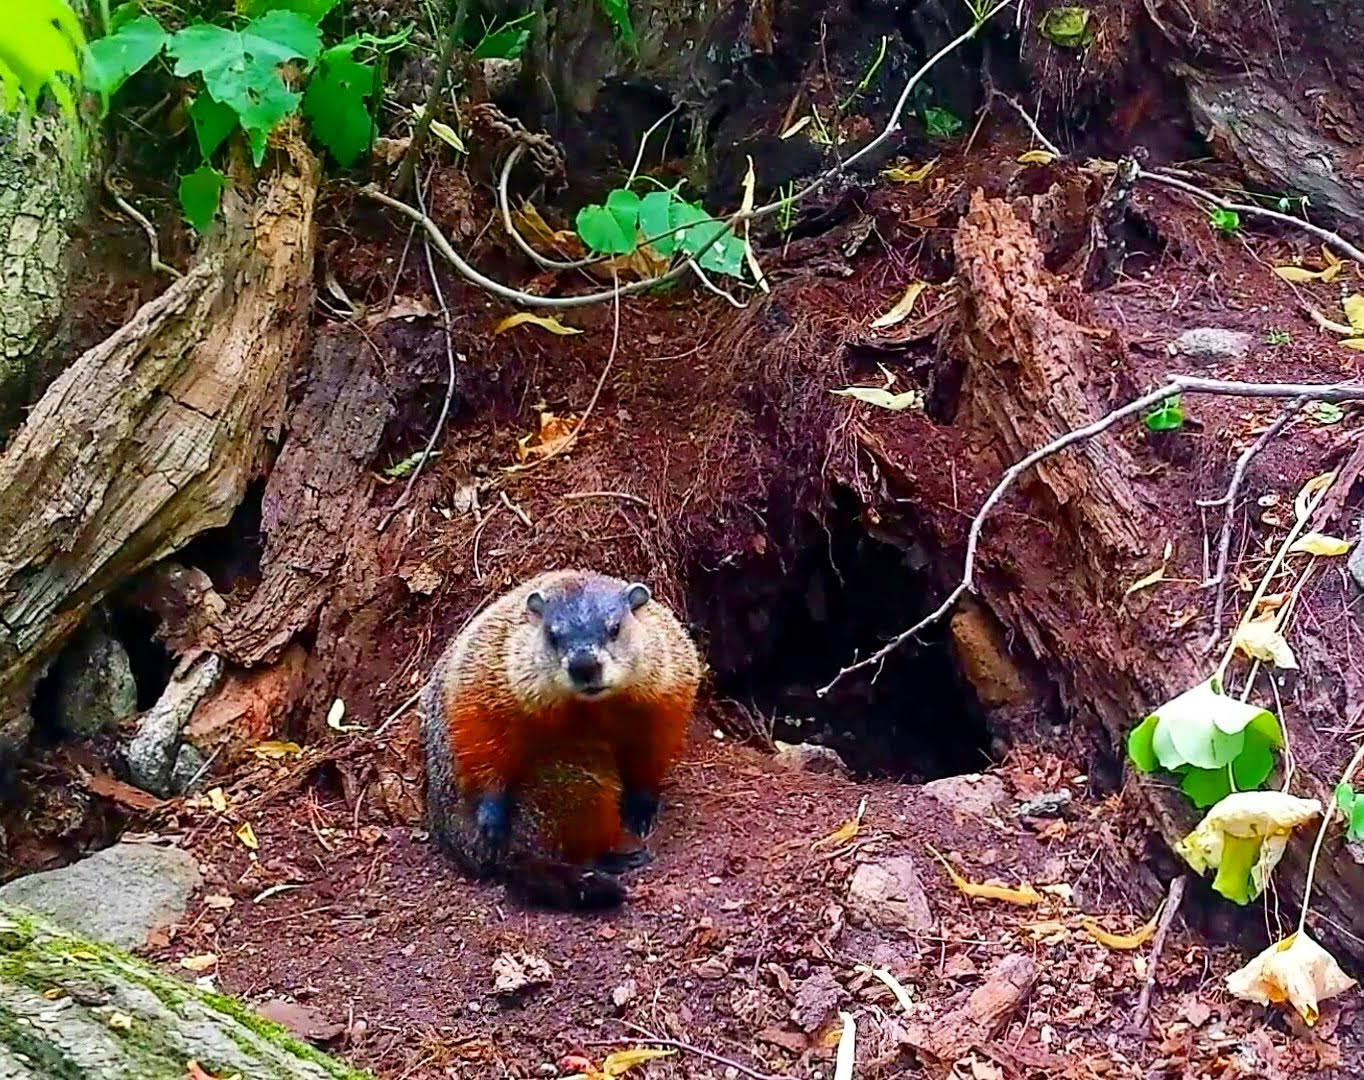
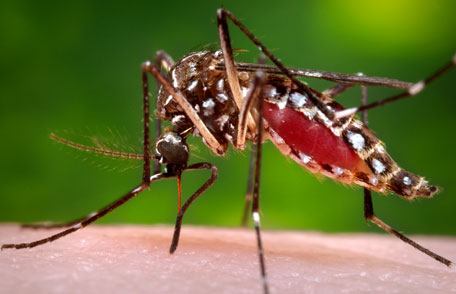

Aphids are tiny insects that live on and eat the leaves of plants, removing vital nutrients from the plants.
Predation
Parasitism
Commensalism
Mutualism


What is the carrying capacity of the graph?
1000
8000
800
600

What happens if a population grows past its carrying capacity?
The population keeps growing
The population starts to die off
The entire species will go extinct
The carrying capacity just increases
This may cause a population to increase
increase of food supply
removal of predators
removal of disease
all of these

The largest number of individuals that an environment can support long term is...
carrying capacity
emigration
immigration
population density
When death rate is equal to birth rate...
population increases
population decreases
population stays the same.
population rapidly increases then becomes stable
The ecological role an organism performs in their specific environment is considered the organism's...
Habitat
Population
Biome
Niche

Which organism in the table above is most likely a primary consumer? (Hint: Think about an energy pyramid)
Organism A
Organism B
Organism C
Organism D
Which organisms in the table above are most likely carnivores? (Select all that apply)
(Hint: Think about an energy pyramid)
Organism A
Organism B
Organism C
Organism D
Which organisms in the table above are most likely autotrophs/producers? (Hint: Think about an energy pyramid)
Organism A
Organism B
Organism C
Organism D

Use the graph above to answer the following question. What happened to the moose population as a result of the wolves being over-hunted in 1980?
The moose population decreased.
The moose population increased.
There was no change in the moose population.
Use the graph above to answer the following question. What is the most likely effect on the grass population size as a result of the wolf population changes during 1970-1980?
The grass population decreased.
The grass population increased.
There was no change in the ecosystem.

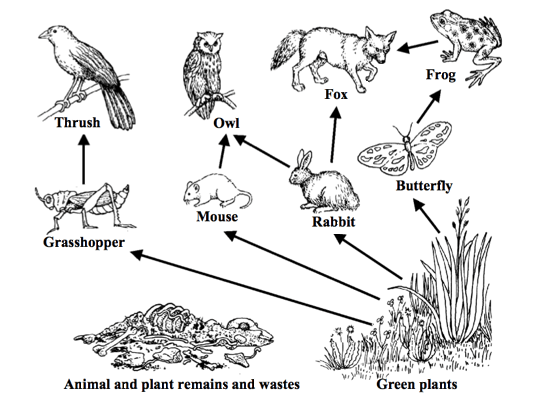
Which organism in the food web above is an omnivore?
Hawk
Sparrow
Rabbit
Shrew

Tigers live independently and require a large area for hunting. What effect would developing housing districts in these areas have on the tigers?
Introduce a new tiger to the area
Promote an increase in the tiger population
Stabilize the tiger population
Reduce the tiger's habitat
Eugene was observing wildlife on along the side of a busy street. He noticed that a group of vultures were eating the remains of a possum that had been run over. What type of consumer are the vultures?
Carnivores
Omnivores
Herbivores
Scavengers
Vegetation (plant life) in the tropical rainforest is so dense that very little sunlight reaches the forest floor. What type of relationship would the different trees in the forest share as a result of the limited sunlight?
Predation
Mutualism
Competition
Commensalism
Which of the following would be an example of a predator adaptation?
Cheetah's fast speed
King snakes imitating a coral snake's warning patterns
Cactus's needles
Zebras travelling in herds

