
 Worksheets
APES Human Population
Total questions: 31
Worksheet time: 20mins
The region of the world with the highest incidence of HIV infections is
North America
Eastern Europe/ Central Asia
Western/Central Europe
Sub-Saharan Africa
Middle East/North Africa
The replacement-level fertility rate is ____ for developed countries and ____ for developing countries.
1.6; 1.9
2.5; 2.0
2.0; 2.5
2.1; 2.5
1.8; 2.1
Which factor below is least likely to affect birth and fertility rates today?
number of people 60 or older
cost of raising and educating children
religious beliefs
educational and employment opportunities for women
average age at marriage
The text suggests that one key demographic statistic is the percentage of people in a region that are under 15 years of age. Why is this statistic important?
Young people buy lots of goods and services
Young people will be the leaders of the future
Young people will feel the effects of global warming.
Young people are reckless and impulsive
Young people are poised to move into their prime reproductive years.
Which of the following pairs of indicators best reflects the availability of health care in a country?
Crude death rate and growth rate
Crude death rate and crude birth rate
Growth rate and life expectancy
Infant mortality rate and life expectancy
Infant mortality rate and crude death rate
Which of the following statements about total fertility rate is correct
TFR is equal to the crude birth rate minus the crude death rate.
TFR is the average number of children each woman must have to replace the current population.
TFR is generally higher in developed countries than in developing countries
TFR is equal to the growth rate of a country
TFR is the average number of children each woman will give birth to during her childbearing years.
Which of the following countries best exemplifies phase 4 of a demographic transition?
Argentina
China
India
Mexico
Japan
Using the rule of 70, a population growing at 10% would double in
7 years
10 years
17 years
15 years
not enough information to tell
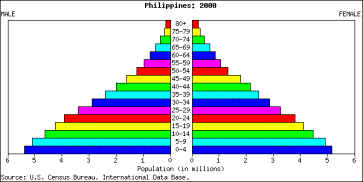
Populations whose age structure diagrams are narrower at the bottom than at the top have
high death rates
the same proportion of individuals in each age group
a declining population
a high growth rate
all of the above

Identify the effect on a population represented by the type of growth seen in the graph above.
Increasing
Decreasing
Stays the same
Which two countries had the largest number of people in 2017?
China and the United States
China and Indonesia
India and the United States
India and Indonesia
China and India
In 1798, Thomas Malthus hypothesized the collapse of the human population. What factor led to the increase to the continued increase of the human population?
Use of fossil fuels.
Increased genetic resistance of pest species.
Reliance of renewable resources.
Food production increasing at an exponential rate due to technological advances in agriculture.
Modern health care doubling the birth rate worldwide
During what two stages of demographic transition does most of a country's population increase occur?
Stages 1 and 2.
Stages 2 and 3.
Stages 4 and 5.
Stages 1 and 4.
Stages 1 and 5.
During this stage of the demographc transition, population growth levels off then declines as birth rates equals and then falls below the death rate.
Stage 1
Stage 2
Stage 3
Stage 4

Which correctly describes the term demographic transition?
The transition from low birth rates and death rates to high birth rates and death rates as a country develops.
The transition from high birth rates and death rates to low birth rates and death rates as a country develops.
The transition from high birth rates to low death rates as a country develops.
The transition from low birth rates to high death rates as a country develops.

According to this graph, Which stage of the demographic transition has the highest level of population growth?
pre-industrial
transitional
industrial
post-industrial
Which of the following is NOT associated with urban sprawl in the United States?
A. The average number of miles driven annually has tripled over the past 50 years.
B. Suburban housing is mixed in with shopping and offices.
C. Distance between work, goods, services, and home prevents pedestrian travel.
D. Lower population densities make services such as mass transit economically prohibitive.
E. Air pollution increases due to reliance on personal vehicles for transportation.
Factors that increase the spread of infectious diseases include all of the following EXCEPT
(A) flooding, which contaminates water supplies
with raw sewage
(B) global warming, which can transfer carriers
of disease from tropical to temperate areas
(C) introduction of insect vectors, which transmit
disease
(D) exposure to neurotoxins, which affect the
endocrine system
(E) rural poverty, which causes people to move
into urban areas
Recent studies have found that fine particulate matter with a diameter of 2.5 μm or less can have negative human health effects. Which of the following correctly links a negative human health effect to an anthropogenic source of fine particulate matter?
(A) High rates of respiratory disease from power
plant emissions
(B) High rates of skin cancer in urban areas with
sewage treatment plants
(C) High rates of asthma from salt spray in
coastal communities
(D) High rates of genetic deformities from
additives in food supplies
(E) High rates of obesity from exposure to waste
from meatpacking
I. China's larger population.
II. China's growing dependence on fossil fuels to drive their economy.
III. Ivory Coast's dependence on small scale and subsistence agriculture.
IV. Ivory Coast's much smaller GDP.
I. Consumer Spending
II. Investments
III. Government Spending
IV. Exports (-) Imports



