Worksheets
Math 112 Final Review
Total questions: 90
Worksheet time: 4hrs 22mins
130

7%
3/4
1/10
If A = {1, 3, 5, 7, 9} and B = {2, 3, 5, 7}, what is A ∩ B?
{3, 5, 7}
{2, 3, 5, 7}
{2, 3, 5, 7, 9}
{1, 2, 3, 5, 7, 9}
What is the complement of A?
Right Pocket (R) = {gloves, paper, coins, phone}
What is L ∪ R?


The following M & M colors are in the bowl:
4 yellow, 6 orange, 3 green, 5 blue, 2 brown
What is the probability of selecting a brown candy?
2/18
1/9
1/10
A key ring has 12 keys, 3 of which open the house door. If two keys are randomly selected without replacement, what is the probability that neither key opens the door?
221
116
169
2221

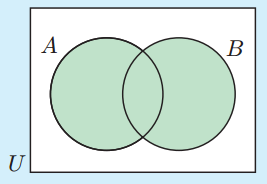
Identify the shaded area...
A
B
A'
B'
Amy plays card games. She picks a card at random. Then without putting the first card back, he picks a second card at random.
Events that have NO affect on other events are called...
Independent Events
Dependent Events
If you are picking a card randomly from a deck of cards, the events of picking a jack and picking a heart are mutually exclusive.
True
False
If you are picking a card randomly from a deck of cards, the events of picking an ace and picking a ‘3’ are mutually exclusive.
True
False

*Remember to simplify.*
5, 11, 2, 12, 4, 2


0, 89, 92, 97, 99, 100

What is the range for this data set? Remember to subtract the minimum value from the maximum value.
10
15
25
30

Rank the data from least to greatest.
55, 55, 55, 55, 55, 60, 60, 60, 60, 60, 70, 70, 75, 75, 85
55, 55, 55, 55, 55, 55, 60, 60, 60, 70, 70, 70, 75, 75, 85
55, 55, 55, 55, 55, 60, 60, 60, 60, 70, 70, 70, 75, 75, 85
55, 55, 55, 55, 55, 60, 60, 60, 60, 70, 70, 75, 75, 75, 85
The outside temperature and the amount of layers you wear.



What does point C on the box plot represent?
First Quartile
Median
Third Quartile
Mean

What do points A and E represent on the box plot?
Mean and Mode
Mean and Median
Least and Greatest Value
First and Third Quartiles

What is the range of this data set?
6
12
13
19
Interquartile Range is
the difference between the third quartile and the first quartile
the difference between the greatest and least data values.
Given a mean of 75 and a standard deviation of 7, what percentage of scores are between 75 and 82?
68%
81.5%
16%
34%
Given a mean of 75 and a standard deviation of 7, what percentage of scores are between 54 and 96?
34%
99.7%
95%
2.5%
Given a mean of 75 and a standard deviation of 7, what percentage of scores are above 82?
34%
81.5%
16%
2.5%
About what percent of the products last 6 days or less?
Then, 68% of all tires will have a life between ___________ km and __________ km.


What is the shape of the data shown?
Skewed left
Skewed Right
Symmetric
Bell shaped

The dot plots show the gas mileage, in miles per gallon, for several cars and SUV's. Which type of vehicle has a larger spread?
cars
SUVs
A data set can have more than one median. True or false?
True
False
What is a peak on a graph.
The highest point in a cluster.
No point at all.
The lowest point.
All of the Above.

A way to describe the shape of a data display that has two modes or peaks.
unimodal
bimodal
multimodal
uniform

What is the origin?
The point furthest away from the center of the coordinate plane
The four regions of a coordinate plane
the x-axis
Where the x-axis and y-axis intersect

What is the ordered pair for point K?
( - 3 , - 3 )
( 3 , - 3 )
( - 4 , - 4 )
( 5 , 8 )
The sum of a number and 4.5 is 8.2.

y = -3x + 7
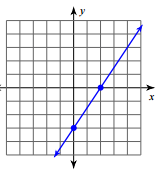


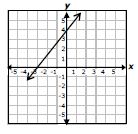
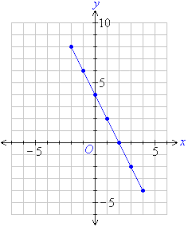
(2, 8); (3, 12)

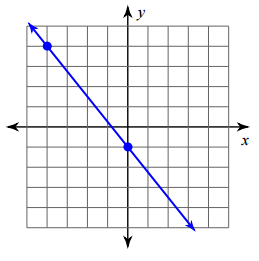
What is the slope?
1
-1
3
-3