wayground logo

Free Printable Worksheets

Font size

S
M
L
XL
Worksheets

Population Dynamics

Total questions: 82

Worksheet time: 1hrs 11mins

Name
Class
Date
1.

What causes competition to occur in an environment?

a)

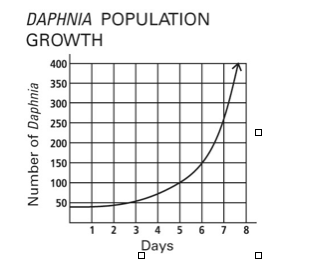
Good conditions make resources plentiful.

b)

Organisms struggle for a limited resource.

c)

Members of a population have different roles.

d)

A population falls below the environment’s carrying capacity.

2.

What is one way that cooperation helps lions to survive?

a)

They hunt in a group to increase their likelihood of catching prey.

b)

They all have a tan color that helps them blend into their environment.

c)

They eat a variety of prey, including zebras, buffaloes, and wildebeest.

d)

They live in prides of five to ten adult females and their young, and one or two adult males.

3.

Without other changes to a population, which of the following will cause a population to increase in size?

a)

The birth rate equals the death rate.

b)

The birth rate is less than the death rate.

c)

The birth rate is greater than the death rate.

d)

The birth rate and the death rate both equal 0.

4.

Which of the following is an example of an abiotic limiting factor on population size?

a)

water availability

b)

Availability of food

c)

disease

d)

predation

5.
When individuals join a population
a)
Aliens
b)
migration
c)
Immigration
d)
Emigration
6.
Carrying Capacity is
a)
the capacity of what one person can carry per day 
b)
how many animals you have in your daily bag limit at the end of the year
c)
wildebeest at a watering hole with zebras
d)
the maximum number of individuals that the environment can support
7.
What are two ways in which the environment can influence population size?
a)
competition and natural disasters
b)
biomes and ecosystems
8.
Is a fungal infection in frogs considered biotic or abiotic?
a)
biotic
b)
abiotic
9.
What type of interaction occurs when beech and maple trees are in the same forest? 
a)
cooperation
b)
competition
c)
cohabitance
10.
A part of the environment that prevents a population from growing to large is a/n______________
a)
abiotic factor
b)
biotic factor
c)
limiting factor
11.
One factor that drives population changes is
a)
the availability of resources.
b)
predation.
c)
both a and b.
d)
none of the above.
12.
When a population grows past the ecosystem's carrying capacity, what happens to the population?
a)
Continues to grow
b)
The population starts to die off to return to carrying capcity
c)
The population will go extinct due to lack of resources
d)
The population grows then finds a new carrying capacity
13.

The graph below represents the growth of a population of flies in a car? Which of the following statements best describes the graph?

a)

The fly population did not change.

b)

The fly population decreased, then increased.

c)

The fly population grew following the logistic growth model.

d)

The fly population grew following the exponential growth model.

14.

Why is biodiversity important to ecosystems?

a)

It allows ecosystems to adapt to changing climates.

b)

It establishes the separate ecosystems within a biome.

c)

It has created antibiotic-resistant bacteria

d)

It provides each organism with one specific role to ensure there is no competition.

15.

Which of the following could be a density-independent limiting factor in the desert?

a)

number of prey

b)

food supply

c)

parasitism

d)

rainfall

16.

Abiotic factors are nonliving things in an ecosystem. Select the list that only contains abiotic factors.

a)

variety of food sources, annual precipitation, and number of decomposers

b)

the density of predators, water depth, types of parasites

c)

precipitation amount, number of prey species, plant types

d)

water temperature, amount of sunlight, soil type

17.

The graph represents _____ of a population.

a)

logistic growth model

b)

exponential growth model

18.

Which point in this graph represents exponential growth?

a)

Point E

b)

Point A

c)

Point B

d)

Point C

19.

Which point on the graph best represents the carrying capacity?

a)

Letter A

b)

Letter C

c)

Letter E

d)

Letter D

20.

In which month(s) did the Cottontail Rabbits reach their carrying capacity?

a)

January and February

b)

March and May

c)

April and January

d)

April and May

21.

Owls and snakes eat mice and other organisms. What would happen to the mice population if the owl population decreased?

a)

The population would decrease, as the loss of owls as part of their diet is a limiting factor.

b)

The population would decrease, as shelters created by owl nests is a limiting factor.

c)

The population would increase, as competition for food is a limiting factor.

d)

The population would increase, as predation by owls is a limiting factor.

22.

Which of the following is density-independent limiting factor?

a)

disease

b)

competition

c)

earthquake

d)

predation

23.
A population is 
a)
a group of communities that exist in different places
b)
a group of organisms of one species that lives in the same area at the same time
c)
a group of people that populate one place at the same time on different planets
24.
When you leave a population
a)
emigration
b)
mitigation
25.
How can a populaiton grow?
a)
Emigration and death
b)
Immigration and death
c)
Immigration and birth
d)
Emigration and birth
26.
Nesting birds often space themselves evenly from other nests. This pattern is called
a)
clumped dispersion.
b)
uniform dispersion.
c)
random dispersion
d)
scatter dispersion
27.
Which of the following is a density-dependent limiting factor?
a)
human activities 
b)
unusual weather
c)
competition
d)
natural disaster
28.
Which of the following is a density-independent limiting factor?
a)
natural disaster
b)
predation
c)
disease
d)
parasitism
29.
The way in which individuals of a population are spread out is called
a)
population density
b)
survivorship
c)
population dispersion
d)
logistic curve
30.
Diseases may spread more rapidly when an area is crowded, so disease is considered to be a
a)
type I survivorship curve
b)
population crasher
c)
density-dependent limiting factor
d)
population enhancer
31.
What type of population growth is shown in the graph?  
a)
logistic growth
b)
logical growth
c)
exponential growth
d)
density-dependent growth
32.
What 2 factors decrease population size?
a)
Immigration, Births
b)
Emigration, Births
c)
Emigration, Deaths
d)
Immigration, Deaths
33.
The _________________ is maximum number of individuals of one species that the environment can support. 
a)
emigration
b)
limiting factor
c)
carrying capacity
d)
immigration
34.
Limiting factors can be biotic or abiotic factors 
a)
true
b)
false
35.
 When an environment has reached its carrying capacity for a certain population, which of the following is true? 
a)
 Growth and immigration rate is equal to death and emigration rate. 
b)
 Growth and immigration rate is greater than death and emigration rate. 
c)
Growth and immigration rate is less than death and emigration rate. 
d)
Growth rate is exponential. 
36.
 Jenn is studying a population of fish found in a pond that has a decreasing carrying capacity.  Which of the following factors would not decrease the carrying capacity of her fish? 
a)
drought
b)
flooding
c)
food shortages 
d)
 a freeze  
37.
 On remote islands, immigration and emigration usually do not have a large effect on population sizes. A bird population on a remote island remains at a relatively constant size year after year. Which of the following most likely describes the birthrate and the death rate for this population? 
a)
 Birthrate and death rate are both zero 
b)
 Birthrate and death rate are close to equal. 
c)
Birthrate is significantly less than death rate. 
d)
Birthrate is significantly greater than death rate. 
38.
Which of the following is a limiting factor in a population of organisms
a)
reproductive replacement
b)
 life spans of the members
c)
fluctuations in atmospheric temperature
d)
availability of food
39.
Which is NOT a reason for the decreasing death rate?
a)
Better health care
b)
Greater food supply
c)
Cleaner water
d)
More pollution
40.

Number of deaths each year per 1,000 people

a)

population growth

b)

population density

c)

birth rate

d)

death rate

41.

All of the people in a particular area

a)

migration

b)

demographics

c)

population

d)

census

42.

Number of births each year per 1,000 people

a)

birth rate

b)

population growth

c)

population density

d)

migration

43.

Birth Rate + Migration - Death Rate =

a)

population growth

b)

population density

44.

Birth rates tend to be higher in

a)

less developed countries

b)

developed countries

c)

industrialized countries

45.

Why do people live longer today than 200 years ago?

a)

better health care

b)

better restaurants

c)

better hairstyles

d)

better clothing

46.

Which area of North America is the most densely populated?

a)

Canada

b)

The Great Plains of the US

c)

The West Coast of the US

d)

The East Coast of the US

47.

In order for population to grow

a)

death rate must be higher than birth rate

b)

heart rate must be lower than death rate

c)

birth rate must equal death rate

d)

birth rate must be higher than death rate

48.

What word describes a poor country with an economy based on farming?

a)

standard of living

b)

dependent population

c)

less developed nation

d)

more developed nation

49.

What word describes a pyramid shaped diagram that shows the age and gender of a population?

a)

population map

b)

standard of living

c)

population pyramid

d)

pyramid graph

50.

What word describes a country with a well developed economy?

a)

more developed nation

b)

less developed nation

c)

independent population

d)

dependent population

51.

True/False: Less developed countries have more dependents than independents.

a)

True

b)

False

52.

Is this country Developed or Developing?

a)

Developed

b)

Developing

53.

Predict the future population growth of this country.

a)

Negative Growth (the population will shrink)

b)

Slow/No Growth (the population will stay about the same)

c)

Growth (the population will definitely grow)

d)

Fast Growth (the population will explode)

54.

Predict the future population growth of this country.

a)

Negative Growth (the population will shrink)

b)

Slow/No Growth (the population will stay about the same)

c)

Growth (the population will definitely grow)

d)

Fast Growth (the population will explode)

55.

How would you describe the population of this country?

a)

They are experiencing rapid population growth

b)

They are experiencing stable population growth

c)

They are experiencing negative population growth

56.
A relationship between two species where one benefits while the other is harmed.
a)
Mutualism
b)
Commensalism
c)
Parasitism
d)
Naturalism
57.
A frog eats a fly. The frog and fly are demonstrating ________.
a)
mutualism
b)
competition
c)
predator/prey
d)
parasitism
58.
A relationship between two organisms in which one organism benefits and the other is unharmed
a)
Mutualism 
b)
Competition
c)
Parasitsm 
d)
Commensalism 
59.
A relationship between two organisms in which both organisms benefit. 
a)
Mutualism 
b)
Competition
c)
Parasitsm 
d)
Commensalism 
60.
What type of species interaction is the following: two bears fighting over the same mate. 
a)
predation 
b)
mutualism 
c)
competition 
d)
parasitism 
61.
_______ is when 2 or more species live in close association. 
a)
predation 
b)
competition 
c)
symbiosis 
d)
food web 
62.

hey can live in many different places, eat a variety of foods, and tolerate a wide range of environmental conditions.

a)

generalist species

b)

specialist species

63.

They may be able to live in only one type of habitat, tolerate only a narrow range of climatic and other environmental conditions, or use only one type or a few types of food.

a)

generalist species

b)

specialist species

64.
Biodiversity refers to
a)
extinct species
b)
the variety of species on Earth
c)
nonrenewable resources
d)
the rate of species decline
65.
These were released in Australia to eat cane beetles, but now they are an invasive species and number in the millions.
a)
dingo
b)
Kangaroo
c)
Cane toad
d)
Rabbits
66.
1. What makes a species invasive?
a)
Moving to a new ecosystem and taking resources from natives 
b)
Not having papers
c)
Species that can't adapt
d)
Plants that take up too much space
67.
Which of the following is a key characteristic of most invasive species?
a)
Ability to breathe in the air & in the water
b)
Large, sharp teeth
c)
Produce many offspring
d)
Is a top predator
68.
A population of an organism will only grow exponentially if:
a)
The resources are unlimited
b)
They want to
c)
The resources are limited
d)
They do not like to compete
69.
Species that are indigenous to an area with no human intervention
a)
invasive species
b)
native species
c)
all species that live in an ecosystem
70.
Invasive species have a negative impact on...
a)
the ecosystem
b)
the economy
c)
Both the ecosystem and the economy
d)
None of these
71.

Based on this country's population pyramid, their population is

a)

Increasing

b)

Stable

c)

Decreasing

72.

Based on this country's population pyramid, their population is

a)

Increasing

b)

Stable

c)

Decreasing

73.

Based on this country's population pyramid, their population is

a)

Increasing

b)

Stable

c)

Decreasing

74.

Based on this country's population pyramid, their population is

a)

Increasing

b)

Stable

c)

Decreasing

75.
Which country has the most elderly people?
a)
1
b)
2
c)
3
76.
Which country do you think has the best health care?
a)
1
b)
2
c)
3
77.
Which country has the highest death rates?
a)
1
b)
2
c)
3
d)
4
78.

The infant mortality rate in Liberia is

a)

high

b)

low

79.

Which stage of demographic transition is Japan in?

a)

rapid growth

b)

little to no growth

c)

declining growth

80.

What is this sort of diagram called?

a)

Population Pyramid

b)

Pie Diagram

c)

Normal distribution

d)

The thing we were too lazy to bother learning about

81.

Age cohorts are shown on which side of pyramid?

a)

Side (y-axis)

b)

Bottom (x-axis)

82.

What does life expectancy measure?

a)

The average that a person in a given population can expect to live to.

b)

The number of old and young dependents who don't work compared with the working age population.

c)

The average number of children a woman in a given population will have in her lifetime.