
Font size
 Worksheets
Carrying capacity and vocabulary
Total questions: 70
Worksheet time: 2hrs 20mins

What is the carrying capacity of the graph?
1000
8000
800
600

What happens if a population grows past its carrying capacity?
The population keeps growing
The population starts to die off
The entire species will go extinct
The carrying capacity just increases
This may cause a population to increase
increase of food supply
removal of predators
removal of disease
all of these

The largest number of individuals that an environment can support long term is...
carrying capacity
emigration
immigration
population density

Something that regulates the size of a population is called...
a limiting measure
a limiting factor
carrying capacity
biodiversity
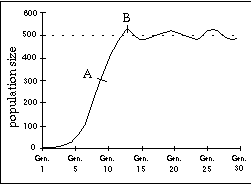
What is the carrying capacity of the graph?
around 500
more than 800
less than 300
around 700
When death rate is equal to birth rate...
population increases
population decreases
population stays the same.
population rapidly increases then becomes stable
When the death rate rises and the birth rate lowers...
population increases
population decreases
population stays the same
all of these
When birth rate is high and death rate is low...
population increases
population decreases
population stays the same
all of these
Which factor that limits a population’s size is important especially when population numbers become large and dense?
seasonal changes
extreme weather
competition for food
sea level height
A group of the same type of organism living together in the same place at the same time is a
Population
Limiting Factors
Immigration
Birth Rate

If a disease destroying barley plants swept through an ecosystem, what would happen to the bird population that eat barley plants?
The bird population would stay the same
The bird population would infinitely increase
The bird population would decrease

On which day did the population represented in the graph below reach the carrying capacity of the ecosystem?
Day 11
Day 8
Day 3
Day 5


Which limiting factor would increase due to the number of individuals in a population (aka; density-dependent)?
Unusual weather
Natural disaster
Disease

In a forest ecosystem, which of the following is NOT an example of a limiting factor that would greatly affect a rabbit population?
a rainy season
a disease that causes rabbits to die
grass available to eat
the population of hawks that eat rabbits
When a population grows past the ecosystem's carrying capacity, what happens to the population?
It continues to grow higher and higher.
The population starts to die off and returns to the carrying capacity.
The population will go extinct due to lack of resources.

The graph to the right shows the interaction of the wolf and moose populations on Isle Pekie. If the moose population continues to increase, the wolves' food supply will increase. What will most likely happen to the wolf population as a result?
It will decrease.
It will increase.
It will remain the same.

The picture to the right represents a sunny, dry desert.
Which factor most likely limits the desert’s carrying
capacity for plant life?
the number of animals that eat plants
the amount of sunlight
the availability of space to grow
the availability of water
The reason that organisms cannot produce populations of unlimited size is that
Populations always stay exactly the same.
The resources of Earth are limited.
There is no carrying capacity for the whole Earth.
Species rarely compete with each other for food.
Which factor that limits a population’s size is important especially when population numbers become large and dense?
seasonal changes
extreme weather
competition for food
sea level height
In a large Maine forest with many animals and lots of space, there are only a small number of bears. Which of these most likely limits the population of bears in the forest?
cloud cover in the atmosphere
space
supply of food
types of trees in the area
A population of salamanders that live in a river require clear, fresh water to survive. New housing developments have caused tons of sediment to muddy the river. Which
of these most likely will happen to the salamander population?
The salamanders go live on land.
The salamanders will move across land to another river.
The salamanders will quickly adapt to living in the muddy water.
The salamanders will decrease in number because of the water quality.
A scientist was studying a population of fish in a pond over a period of 10 years. He observed that
the population increased each year for 3 years, and then remained nearly constant for the rest of
the study. The best explanation for this observation is that the population had
stopped reproducing
reached carrying capacity
mutated into a different species
run out of food and all died
One species of Galapagos finches, the cactus finch, eats insects off cactus plants. A disease kills off most of the cacti in the Galapagos Islands.
Which of these most likely would happen to the carrying capacity of the island?
It would increase a small amount since the insect population would decrease.
It would remain about the same since the finches would change to a different diet.
It would decrease a lot because there is less to eat.
Mice produce a large number of offspring all year long, yet the number of mice within a given population changes very little from year to year. The stability of the population size is most likely the result of
mice continuing to reproduce when its population is large
the survival of more female mice than male mice
the development of mutations in young mice
limiting factors that keep the population in check
Ten breeding pairs of mink are introduced onto an island with no natural predators and a good supply of water and food. What will most likely happen to the mink population?
It will remain relatively constant due to equal birth and death rates.
It will die out.
It will increase until it exceeds carrying capacity.
It will decrease and then increase forever.

A sample of bacteria was added to a culture dish containing a limited food supply. (Culture dishes are designed to help bacteria grow.) The dish was kept in an incubator for two weeks, where temperature that bacteria prefer to live in was kept constant. The graph to the right shows changes that occurred in the bacterial population over the two weeks.
Which statement provides the best explanation for the population increase then decrease?
The bacteria were unable to reproduce until day 8.
The bacteria ate all of the available food.
The bacteria could not grow at all in the provided temperatures.
The bacteria could not grow at all with the provided food type.

Is wind a biotic or abiotic factor?
biotic
abiotic

Is soil a biotic or abiotic factor?
biotic
abiotic

Is temperature a biotic or abiotic factor?
biotic
abiotic

Is pH a biotic or abiotic factor?
biotic
abiotic

Is competition within a species a biotic or abiotic factor?
biotic
abiotic

Is predation a biotic or abiotic factor?
biotic
abiotic

Is disease a biotic or abiotic factor?
biotic
abiotic

Are producers biotic or abiotic factors?
biotic
abiotic
Abiotic factors are ___________.
non-living parts of an ecosystem
living parts of an ecosystem
things that once were alive, but now are dead
not important parts of ecosystems.
Biotic factors are ___________.
non-living parts of an ecosystem
living parts of an ecosystem
things that once were alive, but now are dead
not important parts of ecosystems.
Many fish die due to a drastic change in water temperature.
Density-Dependent
Density-Independent
An extensive drought in the plains threatens wildebeest, giraffe, zebra, and springbok populations.
Density-Dependent
Density-Independent
Which of the following is a density-dependent limiting factor?
human activities
unusual weather
competition
natural disaster
Which of the following are examples of a density independent factors?
forest fire
seasonal cycles
storms
disease
Which of the following are density dependent factors?
competition for resources
predation
disease
natural disasters
A community of organisms and their environment, containing biotic and abiotic factors
biotic factors
producer
ecosystem
All the populations living in an area
community
poulation
habitat


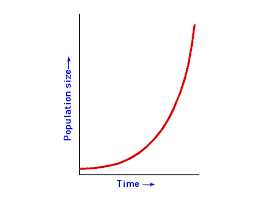

Which of the graphs below shows exponential growth?


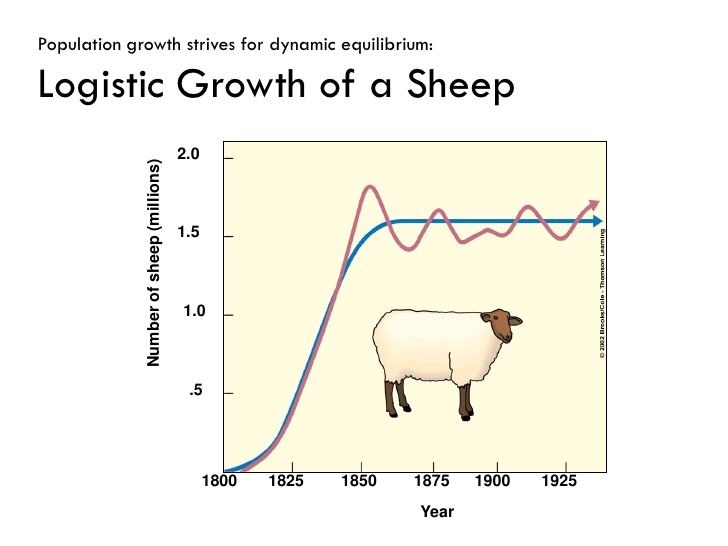
Which of the graphs below shows logistical growth?

