wayground logo

Free Printable Worksheets

Font size

S
M
L
XL
Worksheets

7A 2nd Quarter Unit Assessment Review

Total questions: 100

Worksheet time: 4hrs 12mins

Name
Class
Date
1.

What type of association is shown in this scatter plot?

a)

Nonlinear

b)

Positive linear

c)

Negative Linear

d)

No correlation

2.
What is the correlation?
a)
Negative correlation
b)
No correlation
c)
Positive correlation
d)
All of the above
3.
Name the y intercept
a)
4
b)
-1
c)
1
d)
-4
4.
Name the slope
a)
3
b)
Zero slope
c)
Undefined
d)
1
5.
Name the correct equation
a)
y=x+7
b)
y=-x
c)
y=x
d)
y=-x-7
6.
In the equation y=mx+b,
what does b represent?
a)
Slope
b)
x-intercept
c)
y-intercept
d)
Nothing significant 
7.
Name the slope.
a)
Zero slope
b)
1
c)
Undefined
d)
-1
8.
What is the slope in the equation y=2x + 3?
a)
2
b)
3
c)
5
d)
Cannot be Determined 
9.
If m=3 and b=6, what is the correct slope intercept equation?
a)
y=3-6
b)
y=3x-6
c)
y=3x+6
d)
y=6x+3
10.

Write the equation of the graph in slope-intercept form

a)

y=2x4y=-2x-4

b)

y=2x 4y=2x\ -\ 4

c)

y=12x4y=\frac{1}{2}x-4

d)

y=12x4y=-\frac{1}{2}x-4

11.

Find the slope through these two points.

a)

Zero

b)

Undefined

c)

-1/2

d)

1/2

12.
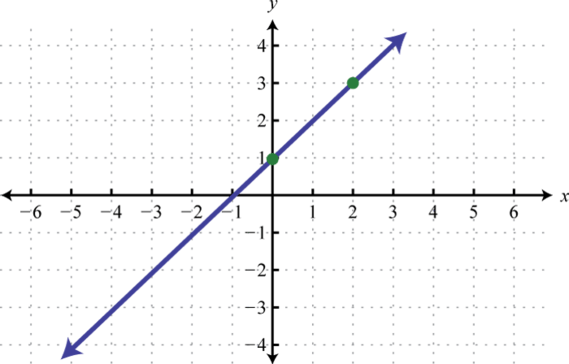
Write the equation of the line.
a)
y = -1/3x - 2
b)
y = 1/3x - 2
c)
y = 3x - 2
d)
y = -3x - 2
13.
a)
Function
b)
Not a Function
14.
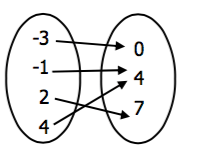
Is this mapping a function or not a function? 
a)
Function
b)
Not a Function
15.
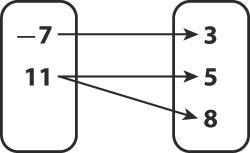
Is the relation a function? Why.
a)
Yes, because the x-value 11 has two y-values pair with it.
b)
Yes, because each x-value has only one y-value paired with it.
c)
No, because the x-value 11 has two y-values pair with it.
d)
No, because each x-value has only one y-value paired with it.
16.
Is this mapping a function or not a function? 
a)
Function
b)
Not a Function 
17.
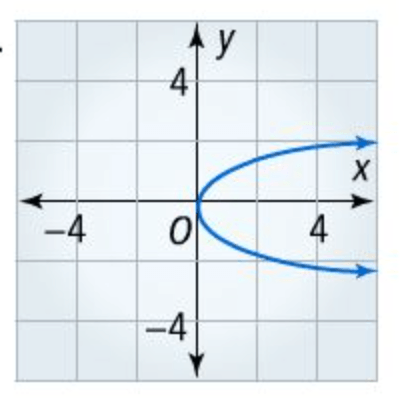
Is this graph a function or not a function? 
a)
Function
b)
Not a Function
18.
Is this table a function or not a function? 
a)
Function
b)
Not a Function
19.
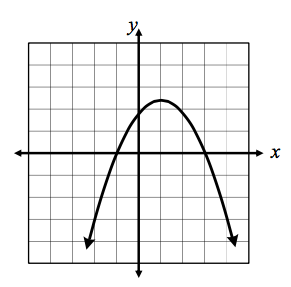
Is this graph a function or not a function? 
a)
Function
b)
Not a Function
20.
Which set of values is a function?
a)
(9,5) (10,5) (9,-5) (10,-5)
b)
(3,4) (4,-3) (7,4) (3, 8)
c)
(6,-5) (7, -3) (8, -1) (9, 1)
d)
(2, -2) (5, 9) (5, -7) (1, 4)
21.
Which ordered pair could you add to the following list of points to create a function?  (3, 5) (4, 9) (2, 5) 
a)
(3, 7)
b)
(4, 1) 
c)
(1, 9)
d)
(2, 6)
22.
Is this graph a function or not a function? 
a)
Function 
b)
Not a Function
23.
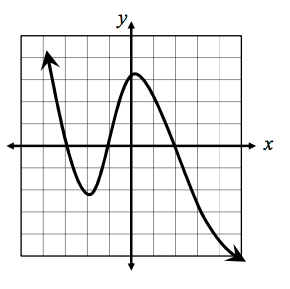
Which graph does NOT pass the vertical line test?
a)
Graph 1
b)
Graph 2
c)
Graph 3
d)
Graph 4
24.
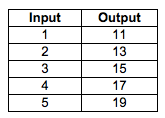
Find the rate of change
a)
1
b)
2
c)
11
d)
Not a constant slope/Non-Linear
25.
What is the initial value in this equation?
y=8x+6
a)
8
b)
6
26.

Which function has the GREATEST rate of change?

a)
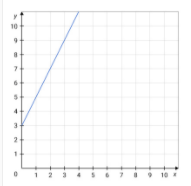
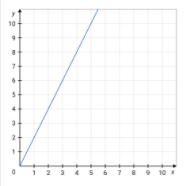
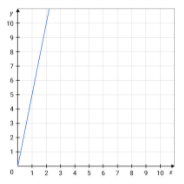
b)
c)
d)
27.

Which function has the GREATEST initial value?

a)
b)
c)
d)
28.
Is this function linear or nonlinear?
a)
Linear
b)
Nonlinear
29.
Is the graph pictured a linear or nonlinear function?
a)
Linear
b)
Nonlinear
30.
Is the equation linear or nonlinear?
a)
Linear
b)
Nonlinear
31.
Is the function linear or nonlinear?
y = x2 + 7
a)
Linear
b)
Nonlinear
32.
Is the function linear or nonlinear?
y = ⅓ x
a)
Linear
b)
Nonlinear
33.
Tim bought a new phone.  He paid $125 on the day of purchase, then $50 per month until it was paid off. What is the initial value in this situation?
a)
50
b)
125
34.

Which company shows a greater rate of change?

4 lines
35.
Write the equation in slope-intercept form:
-3y + 5x = 12
a)
y = -4 + 5x
b)
y = -4 + 5/3x
c)
y = 4 - 5/3x
d)
y = 12 + 5x
36.
Which of these represents slope-intercept form?
a)
y - y1 = m(x-x1)
b)
Ax + By = C
c)
y = mx + b
37.

What is the slope of the line represented by  6x5y=126x-5y=12  

a)

 65-\frac{6}{5}  

b)

 56\frac{5}{6}  

c)

 65\frac{6}{5}  

d)

 56-\frac{5}{6}  

38.
Find the slope
a)
-5/3
b)
-3/5
c)
5/3
d)
3/5
39.
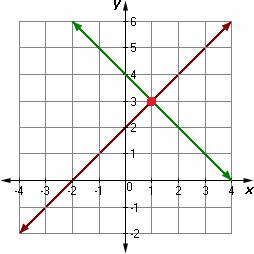
What is the solution to the system?
a)
(0, 3)
b)
(1, -1)
c)
(-3, 1)
d)
(1, 3)
40.


How many solutions?
a)
One Solution
b)
No solution
c)
Infinitely Many Solutions
41.

A system of equations with no solution will have lines that...

a)

are the same

b)

cross in one place

c)

are parallel and never touch

42.

A system of equations with one solution will have lines that...

a)

are the same

b)

cross in one place

c)

are parallel and never touch

43.

The lines graphed on the coordinate grid each represent an equation. Which ordered pair represents a solution to both equations?

a)

(2, 2)

b)

(0, 4)

c)

(0, 0)

d)

((4, 0)

44.

3y - 8 = 7y

a)

y = 4

b)

y = -4

c)

No Solution

d)

Infinite Solutions

45.

8x - 8 = -4x + 16

a)

x = 8

b)

x = 16

c)

x = 24

d)

x = 2

46.

6x + 10 = 2(3x + 4)

a)

x = 0

b)

x = 2

c)

No solutions

d)

Infinite solutions

47.

4(6k - 12) = 3(8k - 16)

a)

x = 3

b)

x = -3

c)

no solutions

d)

infinite solutions

48.
Which of the following lines represents the line of best fit for the scatter plot?
a)
A
b)
B
c)
C
d)
D
49.
Select the statement that best describes the line.
a)
The line is the line of best fit.
b)
The line is NOT a line of best fit because it does not pass through two points.
c)
The line is NOT a line of best fit because it does not go through the middle of the data set.
d)
The line is NOT a line of best fit because it does not go through the origin.
50.
Which of the following lines represents the line of best fit for the scatter plot?
a)
A
b)
B
c)
C
d)
D
51.
Which of the following lines represents the line of best fit for the scatter plot?
a)
A
b)
B
c)
C
d)
D
52.
Which of the following lines represents the line of best fit for the scatter plot?
a)
A
b)
B
c)
C
d)
There is no line of best fit for this graph because there is no trend.
53.

How many boys have shoes that are 18 centimeters long?

a)

6

b)

10

c)

2

d)

5

54.

How many total students were surveyed?

a)

64

b)

60

c)

24

d)

54

55.
How many people purchased no food and no drink?
a)
60
b)
10
c)
20
d)
200
56.
What is the relative frequency of students speaking German?
a)
7%
b)
1%
c)
100%
d)
12%
57.
What percentage of girls have blonde hair?
a)
30%
b)
32%
c)
29%
d)
40%
58.
A survey explored the relationship between gender and band class. Which is a reasonable conclusion?
a)
There are more band members than non-band members
b)
There are more boys in the class than girls
c)
There are more boys in band than not in band
d)
More than half of the bands members in the class are girls
59.
According to the table, what is the relative frequency of Students ages 14 - 17 who skip breakfast?
a)
About 27%
b)
About 35%
c)
About 15%
d)
About 30%
60.
Is this table proportional?
a)
Yes
b)
No
61.
Which table shows a proportional relationship?
a)
A
b)
B
c)
C
d)
D
62.
Does the graph show a proportional relationship?
a)
Yes
b)
No
63.

Which is the best explanation of why this graph shows a non-proportional relationship?

a)

The line is not straight.

b)

The line does not touch the origin.

c)

The line is at the wrong angle.

d)

The graph shows a proportional relationship.

64.

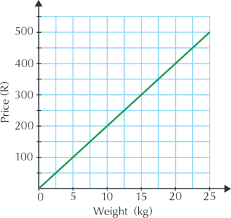
Is the graph shown proportional or non-proportional? Explain how you know.

a)

proportional because it goes to the origin

b)

non-proportional because it doesn't go to the origin

c)

non-proportional because it is not a straight line

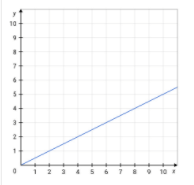
65.

Which graph is a nonproportional relationship?
a)
b)
c)
d)
66.
Simplify the expression: 7v + 2 + 12 + 2v
a)
23
b)
23v
c)
9 + 14v
d)
9v + 14
67.

Which expression is equivalent to the expression 3(4x2)2x?-3\left(4x-2\right)-2x?  

a)

 8x-8x  

b)

 16x-16x  

c)

 14x2-14x-2  

d)

 14x+6-14x+6  

68.
Find the slope of the line that passes through:
(6,7) and (4,2)
a)
2/5
b)
-5/2
c)
5/2
d)
-1/2
69.
Find the slope.
a)
-2
b)
2
c)
1/2
d)
-1/2
70.
Find the slope:
a)
3/4
b)
4/3
c)
-3/4
d)
-4/3
71.
a)

2/12

b)

2/2

c)

-2/12

d)

-2/2

72.

Which ordered pair could represent the y-intercept of a function.

a)

(0, 4)

b)

(4, 4)

c)

(4, 0)

d)

None of these.

73.

What is the y-intercept?

a)

(0,7)

b)

(0,0)

c)

(0,1)

d)

(0,2)

74.
What is the initial value of this graph?
a)
1
b)
-2
c)
0
d)
3
75.

What is the slope of the line that passes through the points (0, -15) and (-16, -20)?

a)

-16/5

b)

-5/16

c)

5/16

d)

16/5

76.

Write the equation of the line shown.

a)

y = x - 4

b)

y = -x - 4

c)

y = 4x - 4

d)

y =2x - 4

77.
When given two points and asked to write an equation, what is your first step?
a)
Find the slope
b)
Find the y-intercept
c)
Find the x-intercept
d)
Write the equation
78.
Write equation of the line containing (6,3) and (4,1)
a)
y = -1x + 5
b)
y = 1x - 3
c)
y = 1x + 5
d)
y = -1x + 3
79.
Paul the plumber charges $25 for a service call.  He then charges $100 an hour.  Write a linear equation to model this situation.
a)
y = 100x
b)
y = 25x
c)
y = 25x + 100
d)
y = 100x + 25
80.

2x + 1 = 2x - 1

a)

No Solution

b)

x = 0

c)

Infinitely Many Solutions

81.

3r - 5 = 2r

a)

No solution

b)

Infinitely many solutions

c)

One solution

82.

y= ¾ x + 5

y= 5 + ¾ x

a)

No Solution

b)

One Solution

c)

Infinitely Many Solutions

83.

Is this a function?

a)

no

b)

yes

84.
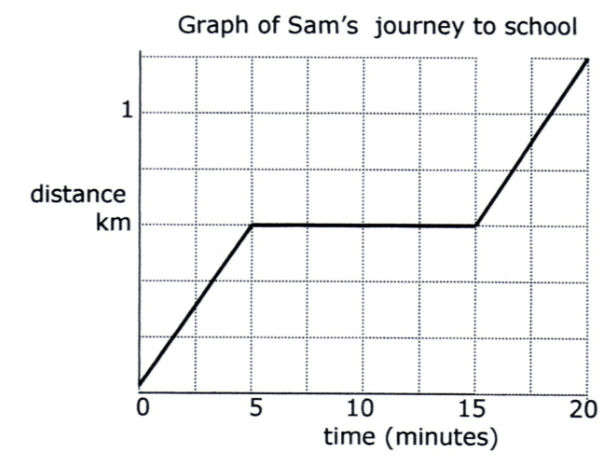
How long did it take Sam to get to school?
a)
5 minutes
b)
20 minutes
c)
1.25 km
d)
1.25 minutes
85.
Over which interval of time is this person returning home?
a)
8:00 < x < 9:00
b)
9:00 < x < 9:30
c)
9:30 < x < 11:00
d)
12:00 < x < 13:00
86.
Which statement is true about this function?
a)
The function is never constant
b)
The function is always increasing
c)
The function is never decreasing
d)
The function increases on the interval 11:00 < x < 15:00
87.
What type of association is there between the variables shown on this scatter plot?
a)
Weak, Positive Association
b)
Strong, Positive Association
c)
Weak, Negative Association
d)
No Association
88.
Which scatter plot shows a linear relationship between x and y?
a)
Graph A
b)
Graph B
c)
Graph C
d)
Graph D
89.

Predict when the club will have no members.

a)

6 years

b)

7 years

c)

8 years

d)

9 years

90.

Which statement best describes the relationship between average traffic volume and average vehicle speed shown on the scatter plot?

a)

As traffic volume increases, vehicle speed increases.

b)

As traffic volume increases, vehicle speed decreases.

c)

As traffic volume increases, vehicle speed increases at first, then decreases

d)

As traffic volume increases, vehicle speed decreases at first, then increases.

91.

Determine if the data set would have a positive, negative, or no correlation.

The number of hours a person has driven and the number of miles driven.

a)

Positive correlation

b)

Negative correlation

c)

No correlation

92.

If there is no correlation, what is the relationship between these variables?

a)

As period increases, average score decreases

b)

As period increases, average score increases

c)

There is no relationship between the variables

d)

A different answer I want to explain in detail

93.

Which scenario would most likely show a negative association between the variables?

a)

the height of a tree, x, and the amount of time it takes to climb to the top of the tree, y

b)

the number of people in the mall, x, and the number of cars in the parking lot, y

c)

miles traveled in a car, x, and the amount of gasoline used, y

d)

time spent reading a book, x, and the number of pages left to read, y

94.

A scatter plot for calories burned and minutes of exercise is drawn. Observe the graph carefully and identify the outliers present.

a)

(140,150)

b)

(150,140)

c)

(180,450)

d)

None of these

95.

Find the equation of the line of best for the scatter plot given below.

a)

y = x - 5

b)

y = x + 5

c)

y = 2x - 5

d)

y = 2x + 5

96.

Which of the following represent a line with a zero slope?

a)

x = 5

b)

y = 5

c)

x = 0

d)

all of the above

97.

which of the following is a line for a vertical equation?

a)

y = x

b)

x = 5

c)

x = y + 0

d)

y = 5

98.

what statement below is not true?

a)

horizontal lines have zero slope

b)

vertical lines have undefined slope

c)

y = 7 has a zero slope

d)

x = 0 has a zero slope

99.

all of the following have an undefined slope except for....

a)

y = 3

b)

x = 0

c)

x = -9

d)

x = 2

100.
What would the graph of y = 8 look like?
a)
Horizontal line
b)
Vertical line
c)
Slanted line
d)
No way to tell