
 Worksheets
Cubic function and graphs
Total questions: 48
Worksheet time: 44mins
Which of the following is the graph of y=(x−2)3−4


Which of the following is the graph of y=(x+5)3−1


Which of the following is the graph of y=−(x−4)3+2


Which of the following is the equation of the cubic function graphed above
y=−(x−1)3+4
y=(x−1)3+4
y=−(x+1)3+4
y=(x+1)3+4

The graph of y=x3 is graphed in blue. Which of the following equations could be equation of the function graphed in red?
y=201(x−2)3+1
y=201(x+2)3+1
y=20(x−2)3+1
y=20(x+2)3+1

The graph of y=x3 is graphed in blue. Which of the following equations could be equation of the function graphed in red?
y=−5(x+2)3−1
y=5(x+2)3−1
y=−51(x+2)3−1
y=51(x+2)3−1

Which of the following is the equation for the cubic function graphed above
y=(x+4)3+3
y=(x+4)3−3
y=(x−4)3+3
y=(x−4)3−3
Which of the following is the graph of y=(x−2)3−4
Which of the following is the graph of y=−(x−4)3+2
Which of the following is the equation for the cubic function graphed above
y=(x+4)3+3
y=(x+4)3−3
y=(x−4)3+3
y=(x−4)3−3

Which of the following is the graph of y=−(x−4)3+2

The graph of y=x3 is graphed in blue. Which of the following equations could be equation of the function graphed in red?
y=−5(x+2)3−1
y=5(x+2)3−1
y=−51(x+2)3−1
y=51(x+2)3−1

Which of these represents a CUBIC function?


A cubic function has a degree of....
1
2
3
4

Which of the following statements is/are true of the function
f(x) (shown above)? You may select more than one statement?Positive on the interval (−3, −1)
Decreasing on the interval (−4, 2)
Y-intercept at (0, 2)
Range of (−∞, ∞)
f(x) is a cubic function

Range: (-∞, 2]
Range: (-∞, ∞)
Range: (-∞, ∞)
Range: [2, ∞)


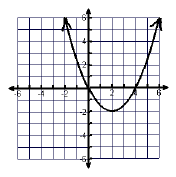
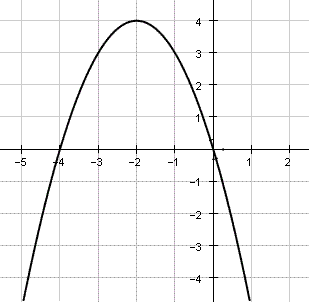
Does this function have a maximum or minimum?
maximum
minimum

What type of function is this?
Linear
quadratic
cubic
square root
Range: (-∞, 2]
Range: (-∞, ∞)
Range: (-∞, ∞)
Range: [2, ∞)
Cubic functions are used to model ___________
length or width of a side
area of a figure
volume of a figure
none of the above
Find the area of a rectangle with side lengths (x +4) (x -2) inches.

Sketch the graph of each function. State the number of real zeros. Approximate the relative minima and relative maxima to the nearest tenth.


Sketch the graph of each function. State the number of real zeros. Approximate the relative minima and relative maxima to the nearest tenth.


Factor completely.


Factor completely.


Factor completely.


Factor completely.


Factor completely.


Factor each and find all roots.


Factor each and find all roots.


Factor each and find all roots.



