
 Worksheets
Forces & Motion: Time-Graphs
Total questions: 44
Worksheet time: 30mins

Describe the motion in the graph:
Constant Speed (positive slope)
Stopped (at rest)
Acceleration (increasing speed)
Return Home (negative slope)

Describe the motion in the graph:
Constant Speed (positive slope)
Stopped (at rest)
Acceleration (increasing speed)
Return Home (negative slope)

Describe the motion in the graph:
Constant Speed (positive slope)
Stopped (at rest)
Acceleration (increasing speed)
Return Home (negative slope)

Describe the motion in the graph:
Constant Speed (positive slope)
Stopped (at rest)
Acceleration (increasing speed)
Return Home (negative slope)

Describe the motion in the graph:
Constant Speed (positive slope)
Stopped (at rest)
Acceleration (increasing speed)
Return Home (negative slope)

Describe the motion in the graph:
Constant Speed (positive slope)
Stopped (at rest)
Acceleration (increasing speed)
Return Home (negative slope)


In which of the following graphs below are both runners moving at the same speed?


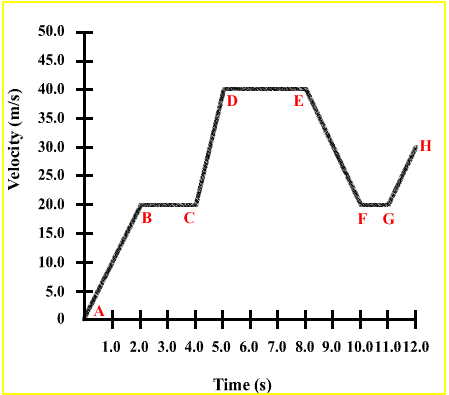

The gradient of a velocity-time graph represents (a) .
The area under a velocity-time graph represents (a) .

Calculate the distance travelled in section B.
(a)

Calculate the distance travelled in section C.
(a)

Explain the motion from 0-1s
Stationary
Constant speed
Constant acceleration
Non-constant acceleration
Explain the motion from 1-3s
Stationary
Constant speed
Constant acceleration
Non-constant acceleration
Explain the motion from 3-5s
Stationary
Constant speed
Constant acceleration
Non-constant acceleration
Explain the motion from 5-7s
Stationary
Constant speed
Constant acceleration
Constant deceleration
Explain the motion from 8s onwards. The blue line runs along the x-axis. Hint: What is the velocity from 8s onwards.
Stationary
Constant speed
Constant acceleration
Constant deceleration

Where is the acceleration the highest?
0-1s
1-3s
3-5s

Explain the motion
Stationary
Constant speed
Constant acceleration
Non-constant acceleration
The acceleration from 0-1s is (a) m/s2.
The acceleration from 3-5s is (a) m/s2.
The deceleration from 5-7s is (a) m/s2.
Calculate the total distance traveled in the first 1s.
(a)
Calculate the total distance traveled in the first 3s.
(a)
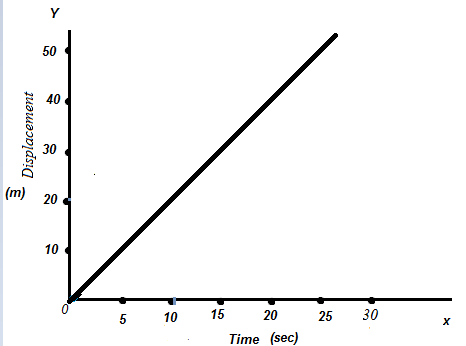
What is shown in this displacement vs time graph?
uniform velocity
uniform speed
no speed (at rest)
acceleration
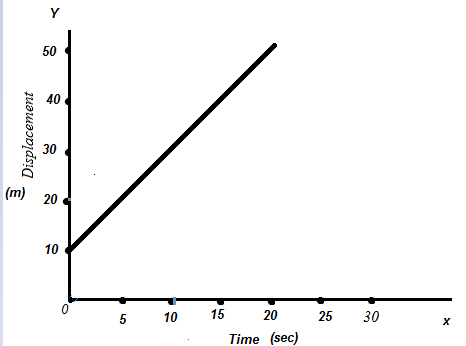
What is shown in this graph?
uniform velocity and initial displacement 10m
uniform velocity and initial velocity 10m
acceleration
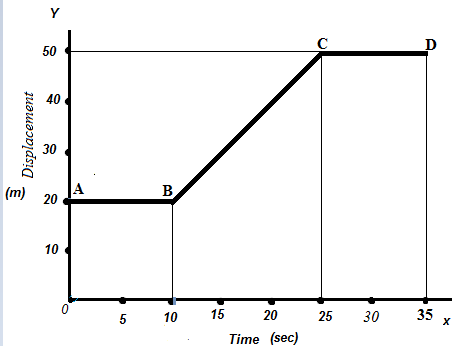
What is happening between B and C in this graph?
constant acceleration
uniform velocity
at rest
What is happening between C and D in this graph?
constant acceleration
uniform velocity
at rest
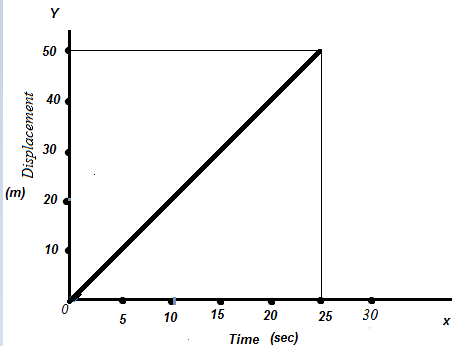
Find the velocity from the given graph.
2 m/s
21 m/s
100 m/s
-2m/s
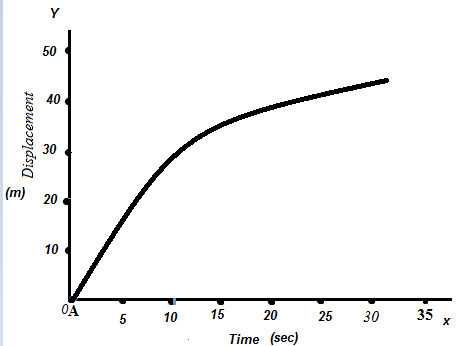
what is shown in this graph?
negative velocity
positive velocity
negative acceleration deceleration
positive acceleration
Calculate the displacement traveled in section C. Hint: Remember the area under a v-t graph = displacement and you will need to use TWO shapes!
200 m
100 m
50 m
400 m

Select the description of motion from A - B.
Slowing down away from the origin
Speeding up away from the origin
Constant velocity away from the origin
Constant velocity towards the origin

What segment of the graph shows no motion, or standing still?
A - B
B - C
C - D
None
What does a horizontal line (not on the x-axis) mean on a V-T graph?
No movement
Constant velocity
Changing velocity
Change in direction
Calculate the displacement traveled in section D. Hint: Remember the area under a v-t graph = displacement!
250 m
50 m
100 m
200 m
150 m
Calculate the displacement traveled in section A. Hint: Remember the area under a v-t graph = displacement!
75m
50 m
100 m
125 m
150 m

