
 Worksheets
Populations
Total questions: 96
Worksheet time: 2hrs 35mins

What age groups does the bottom of a population pyramid represent?
The elderly
The working adults
The children
Males

What does the whole right side of the population pyramid represent?
Males
Females
Unemployed
Young people

What age group does the top of the population pyramid represent?
The working people
The rich people
The elderly
The young people

What growth rate does this population pyramid represent?
Rapid Growth
Slow Growth
Negative Growth
Zero Growth

Is this country Developed or Developing?
Developed
Developing

Predict the future population growth of this country.
Negative Growth (the population will shrink)
Slow/No Growth (the population will stay about the same)
Growth (the population will definitely grow)
Fast Growth (the population will explode)

Predict the future population growth of this country.
Negative Growth (the population will shrink)
Slow/No Growth (the population will stay about the same)
Growth (the population will definitely grow)
Fast Growth (the population will explode)

Which country, A or B, has an ageing population?
A
B

Which growth rate does this population pyramid represent?
Slow Growth
Zero Growth
Rapid Growth
Negative Growth

Based on this country's population pyramid, their population is
Increasing
Stable
Decreasing

Based on this country's population pyramid, their population is
Increasing
Stable
Decreasing


One reason the world is growing so quickly is because...
The world has infinite resources for everyone
Birth rate is higher than death rate
There are more and more places for people to live
Death rate is higher than birth rate

According to the diagram, squirrels are which type of survivorship curve?
Type I
Type II
Type III
When there is a high survivorship early in life due to high parental care, then a rapid decrease in survivorship in late life as old age sets in, which type of
survivorship?
Type I
Type II
Type III
A graph that shows the number or proportion of individuals surviving to each age for a given species or group.
survivorship curve
exponential
linear
logistic

Tracks organisms that tend to live long lives (low death rate and high survivorship rate); toward the end of their life expectancies, however, there is a dramatic increase in the death rate.
Type I
Type II
Type III
Type IV
Describes organisms with a high death rate (or low survivorship rate) immediately following birth. Examples include bacteria, fishes, and invertebrates.
Type I
Type II
Type III
Type IV
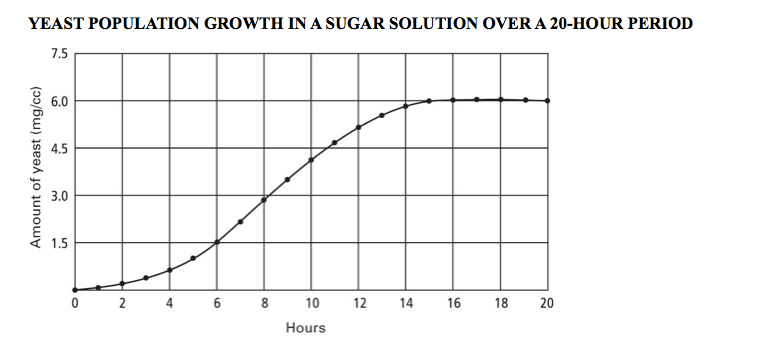
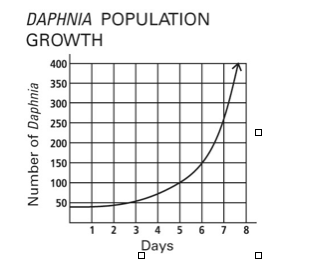
logistic
exponential
average
density-independent
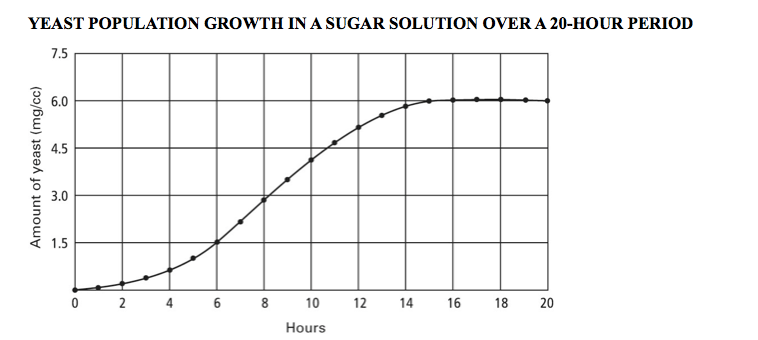


What is the carrying capacity of the graph?
1000
8000
800
600

What happens if a population grows past its carrying capacity?
The population keeps growing
The population starts to die off
The entire species will go extinct
The carrying capacity just increases

The largest number of individuals that an environment can support long term is...
carrying capacity
emigration
immigration
population density
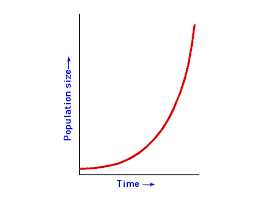
A J-curve represents
exponential growth
logistic growth
no growth
When two or more species uses the same resource they participate in a biological interaction called
competition
aggression
niche
fight
A close, long-term relationship shared among species is a
parasitic relationship
symbiotic relationship
community relationship
competition relationship
The act of one organism killing another for food.
commensalism
predation
parasitism
mutualism
Symbiotic relationship in which one individual is harmed and the other is benefited.
commensalism
predation
parasitism
mutualism
Relationship in which both participating individuals benefit.
commensalism
predation
parasitism
mutualism
Symbiotic relationship in which one individual benefits; the other is neither helped nor harmed.
commensalism
predation
parasitism
mutualism
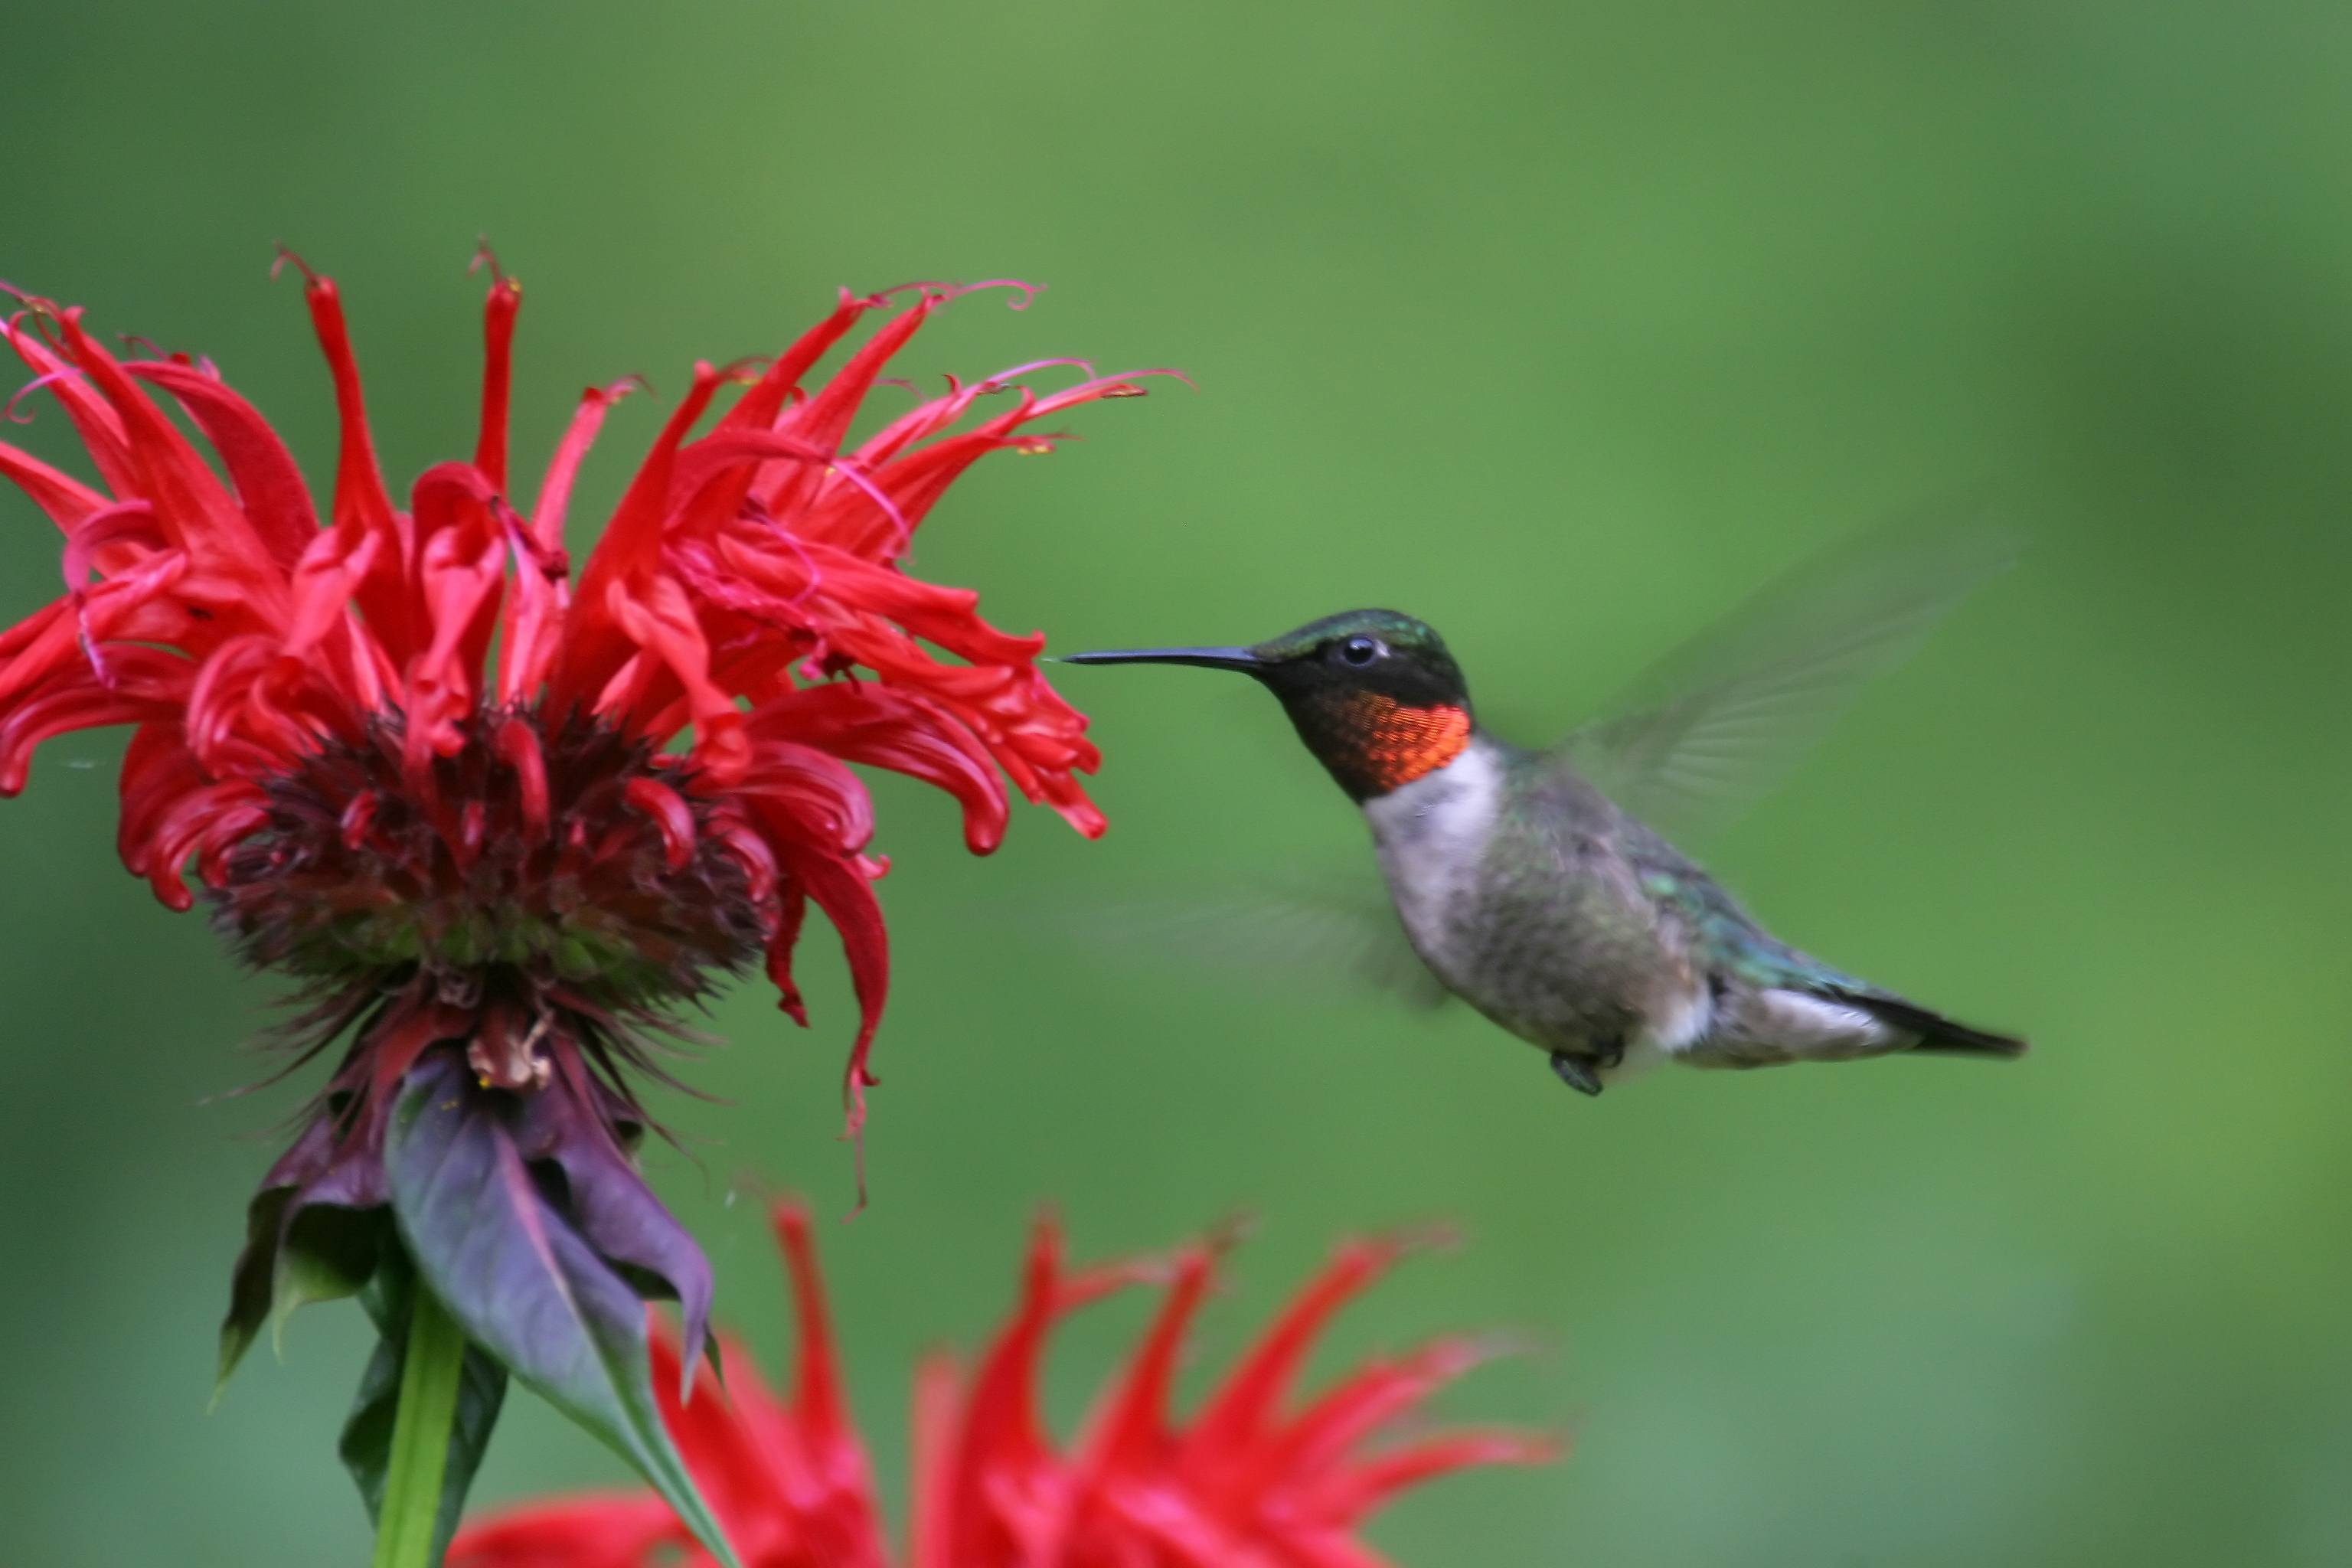
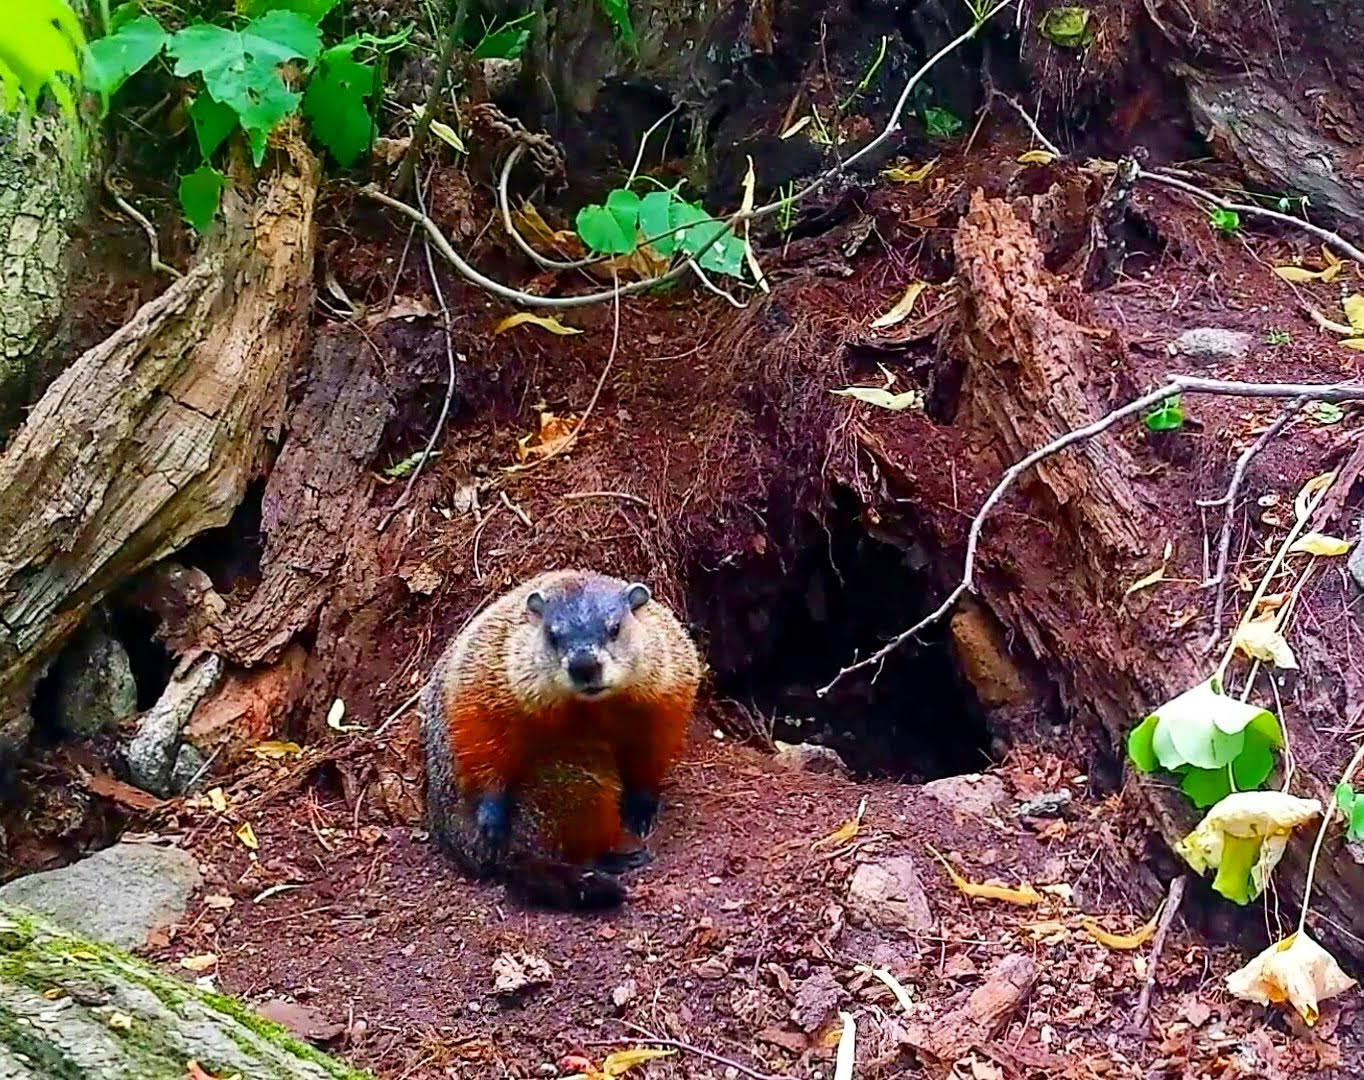
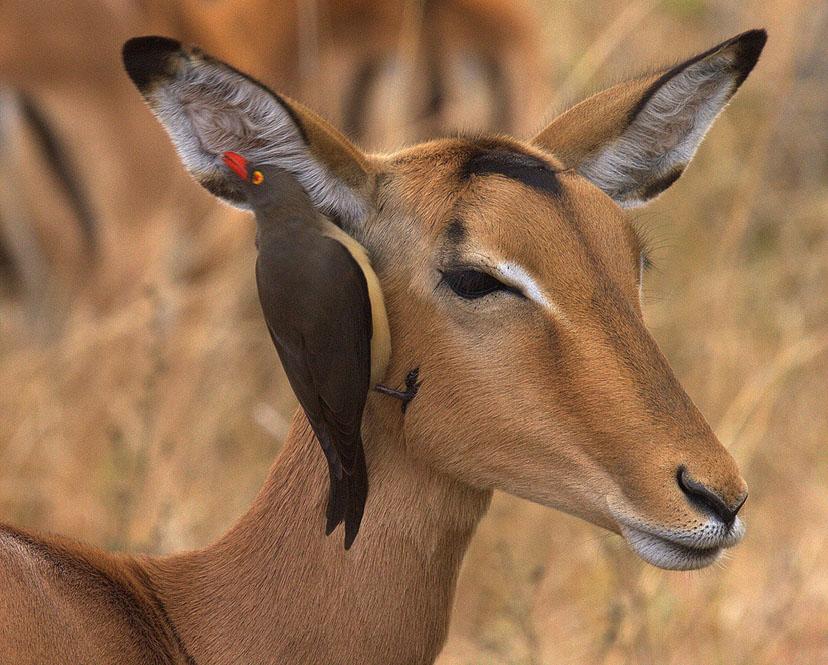
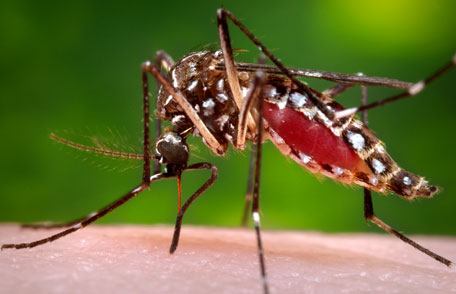

Aphids are tiny insects that live on and eat the leaves of plants, removing vital nutrients from the plants.
Predation
Parasitism
Commensalism
Mutualism


the maximum number of offspring that a given organism can produce.
Some species have much higher reproductive potentials than others.
Death rate
Birth rate
Exponential growth
Reproductive potential
The number of live births per thousand organisms of a population per year.
Death rate
Birth rate
Exponential growth
Reproductive potential

Role or position and species has in its environment
habitat
ecological niche
ecosystem
Place where an organism lives
habitat
population
ecology


Countries with high levels of literacy and higher education are in which level of economic development?
More Developed
Newly Industrialized
Less Developed

Which correctly describes the term demographic transition?
The transition from low birth rates and death rates to high birth rates and death rates as a country develops.
The transition from high birth rates and death rates to low birth rates and death rates as a country develops.
The transition from high birth rates to low death rates as a country develops.
The transition from low birth rates to high death rates as a country develops.

The average number of children a woman of childbearing years would have in her lifetime, if she had children at the current rate for her country.
fertility rate
replacement fertility rate
growth rate
death rate

Which of the following leads to a decrease in birthrates among women?
Higher Education
High Infant Mortality Rate
No Prenatal Care
No contraceptives
The study of human population is
survivorship
demography
age structure
migration
Movement of individuals into or out of a population.
demographic transition
infrastructure
urbanization
migration
The basic facilities and services that support a country or region, such as roads, bridges, and sewers.
arable land
demographic transition
infrastructure
urbanization

The size of the human population began to increase exponentially after the
bubonic plague
development of plowing and irrigation
Industrial Revolution
development of the first cities.
An increase in the ratio or density of people living in urban areas, rather than rural areas.
Urbanization
Demography
Survivorship
Human Development Index (HDI)
What is the term for the total number of people living in a place?
Population
Population density
Urbanization
Rate of natural increase
The birth rate refers to the:
Number of babies born per year
Number of people who die per year
Number of people who move to a city per year
Number of people who immigrate per year
The number of people who die in a year is called the:
death rate.
rate of natural increase.
birth rate.
rural rate.
Population density is a measurement of:
the number of people per square mile.
the total number of people living somewhere.
the number of immigrants living somewhere.
the average income of a group of people.
If you want to calculate population density, you need to know an area's total population and:
the area's total size.
the area's economic strength.
the area's level of urbanization.
the area's death rate.
pattern of spacing of a population within an area
density-dependent factor
carrying capacity
Which type of distribution is best suited for herding animals?
Even
Clumped
Random
Paired
Which type of distribution is best suited for aggressive animals?
Paired
Even
Random
Clumped

What type of dispersion does this picture represent?
Random
Even
Clumped
None

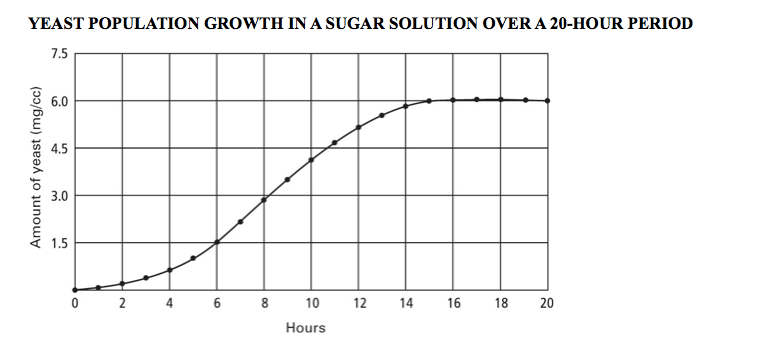
What type of limiting factor the picture represent?
Density-dependent
Density-independent
none

What type of limiting Factor the picture represent?
Density-dependent
Density-independent
none

What is the maximum number of individuals that the ecosystem in the picture can support?
40
200
100
1000
Which phase of the demographic transition is marked by high birth rates and high death rates?
Phase 1 (Pre-Industrial)
Phase 2 (Transitional)
Phase 3 (Industrial)
Phase 4 (Post-Industrial)
Which phase of the demographic transition is marked by high birth rates and low death rates?
Phase 1 (Pre-Industrial)
Phase 2 (Transitional)
Phase 3 (Industrial)
Phase 4 (Post-Industrial)
Which phase of the demographic transition is marked by decreasing birth rates and low death rates?
Phase 1 (Pre-Industrial)
Phase 2 (Transitional)
Phase 3 (Industrial)
Phase 4 (Post-Industrial)
Which phase of the demographic transition has the highest total fertility rates?
Phase 1 (Pre-Industrial)
Phase 2 (Transitional)
Phase 3 (Industrial)
Phase 4 (Post-Industrial)
Which phase of the demographic transition results from increased women's education and birth control?
Phase 1 (Pre-Industrial)
Phase 2 (Transitional)
Phase 3 (Industrial)
Phase 4 (Post-Industrial)
Which phase of the demographic transition results from improved medical care, sanitation, and food production?
Phase 1 (Pre-Industrial)
Phase 2 (Transitional)
Phase 3 (Industrial)
Phase 4 (Post-Industrial)
Which phase of the demographic transition results from high levels of affluence and economic development?
Phase 1 (Pre-Industrial)
Phase 2 (Transitional)
Phase 3 (Industrial)
Phase 4 (Post-Industrial)

