
 Worksheets
Demand and Supply Summative
Total questions: 75
Worksheet time: 38mins
Thousands of people leave a small town due to a factory closing down. Sales at the local grocery store are reduced. What causes this change?
Prices or availability of substitutes
Prices or availability of complementary goods
Change in the weather or season
Change in the number of buyers
Which statement expresses a central idea of how the laws of supply and demand work?
The government sets the prices for goods and services.
Prices are determined by the interaction of producers and consumers.
Consumers alone determine the prices for goods and services.
Technology dictates the prices charged for goods and services.
Which of the following would NOT be a determinant of demand?
The price of related goods
Income
Tastes
The prices of the inputs used to produce the good
Suppose you like banana cream pie made with vanilla pudding. Assuming all other things are constant, you notice that the price of bananas is higher. How would your demand for vanilla pudding be affected by this?
It would decrease.
It would increase.
It would be unaffected.
There is insufficient information given to answer the question.
What will happen in the rice market if buyers are expecting higher prices in the near future?
The demand for rice will increase.
The demand for rice will decrease.
The demand for rice will be unaffected.
The supply of rice will increase.

Refer to Graph 4-1. The movement from point A to point B on the graph shows
a decrease in demand.
an increase in demand.
an increase in quantity demanded.
a decrease in quantity demanded.
What does the Latin phrase Ceteris paribus literally mean?
"other things being equal."
"after this therefore because of this."
"to respond slowly to a change in price."
"There's no such thing as a free lunch."

Refer to Graph 4-4. On the graph, what could most likely cause the movement from S to S1?
A decrease in the price of the good.
An increase in income.
An improvement in technology.
An increase in input prices.

Refer to Graph 4-5. According to the graph, what are the equilibrium price and quantity?
$7, 20.
$7, 60.
$5, 40.
$3, 60.

Refer to Graph 4-5. According to the graph, What occurs at a price of $7?
there would be a shortage of 40 units.
there would be a surplus of 40 units.
there would be a surplus of 20 units.
the market would be in equilibrium.

Refer to Table 4-2. In the table shown, what would be the result if the price were $8?
a surplus of 30 units would exist and price would tend to fall.
a surplus of 60 units would exist and price would tend to rise.
a surplus of 60 units would exist and price would tend to fall.
a shortage of 30 units would exist and price would tend to rise.
This part of the market determines DEMAND
buyers
sellers
suppliers
store owners
This part of the market determines SUPPLY
buyers
sellers
consumers
us
For the law of demand, as price rises, what happens to quantity demanded?
it goes up
it goes down
it stays the same
it is not effected
For the law of supply, as price rises, what happens to quantity supplied?
it goes up
it goes down
it stays the same
it is not effected
When quantity supplied and quantity demanded is equal
surplus
shortage
equilibrium
law of demand
If a price is below the equilibrium price it creates a...
shortage
surplus
market price
supply

What does this curve represent?
demand
supply
equilibrium
shortage
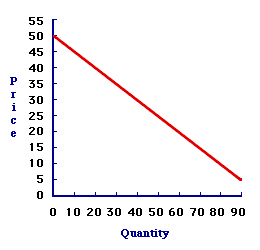
What does this curve represent?
supply
equilibrium
demand
surplus
A place where buyers and sellers of a particular good or service interact
Supply
Demand
Agency
Market
According to the law of supply, what happens as price increases?
The quantity supplied increases
The quantity supplied decreases
The supply curve shifts to the left
The supply curve shifts to the right
Which of these are determinants of demand?
Income
Tastes and preferences
Price of other goods
All of these
None of these


In the figure above, which movement reflects an decrease in the price of fruit snacks?


from point a to point b
from point a to point c
from point a to point d
from point a to point e

from point a to point b
from point a to point c
from point a to point d
from point a to point e


The above figure represents the market for bicycles. When the song "On A Bicycle Built For Two" by Nat King Cole came out, what happened?
demand curve will not shift, and the supply curve shifts from S1 to S2.
demand curve will not shift, and the supply curve shifts from S2 to S1.
demand curve shifts from D1 to D2 and the supply curve will not shift.
demand curve shifts from D2 to D1 and the supply curve will not shift.

Take a look at the graph below. Label the curves by filling in the blanks. The supply curve is __________________ and the demand curve is _________________.
red ..... blue
blue .... red

Which scenario below could cause a change in the quantity supplied to go from point C to point D on the supply curve?
The demand decreased
The price decreased
The price increased
The law of demand says that as prices go ________________, consumers buy _______________ of that product.
down .... less
down .... more

Which of the scenarios below could cause a change in the quantity demanded for gas, to go from point A to point B?
The price of gas increased
The price of gas decreased

If current production is shown by the green (x) on the supply curve, is there a shortage or a surplus?
shortage
surplus
Identify the correct determinant of supply:
Example: If the cost of electricity used to power an automotive factories falls, the supply of cars in the market increases
Cost of resources
Number of sellers
Change in expectations
Change in technology
Example: If the government requires factories to reduce pollution, complying will initially increase costs of production in the market and reduce supply.
Example: As the demand for DVDs decreased due to consumer preference for streaming movies, the market price for DVDs fell. This lower market price caused sellers to leave the DVD market and supply decreased.
Example: If airlines expect prices for airline tickets to fall in September when families are less likely to travel due the school calendar, they will supply more during the summer months when they can charge higher fares.
Examples: When auto manufacturer were able to implement robotics on the production line, automobiles were produced more quickly and at a smaller cost per unit. This allowed the industry to supply more cars.
Example: An economic boom allows skilled workers to move from fast food jobs into white collar office administration jobs. Fast food producers are forced to hire less skilled workers and supply of fast food decreases.

