
 Worksheets
Classwork March 8
Total questions: 39
Worksheet time: 21mins
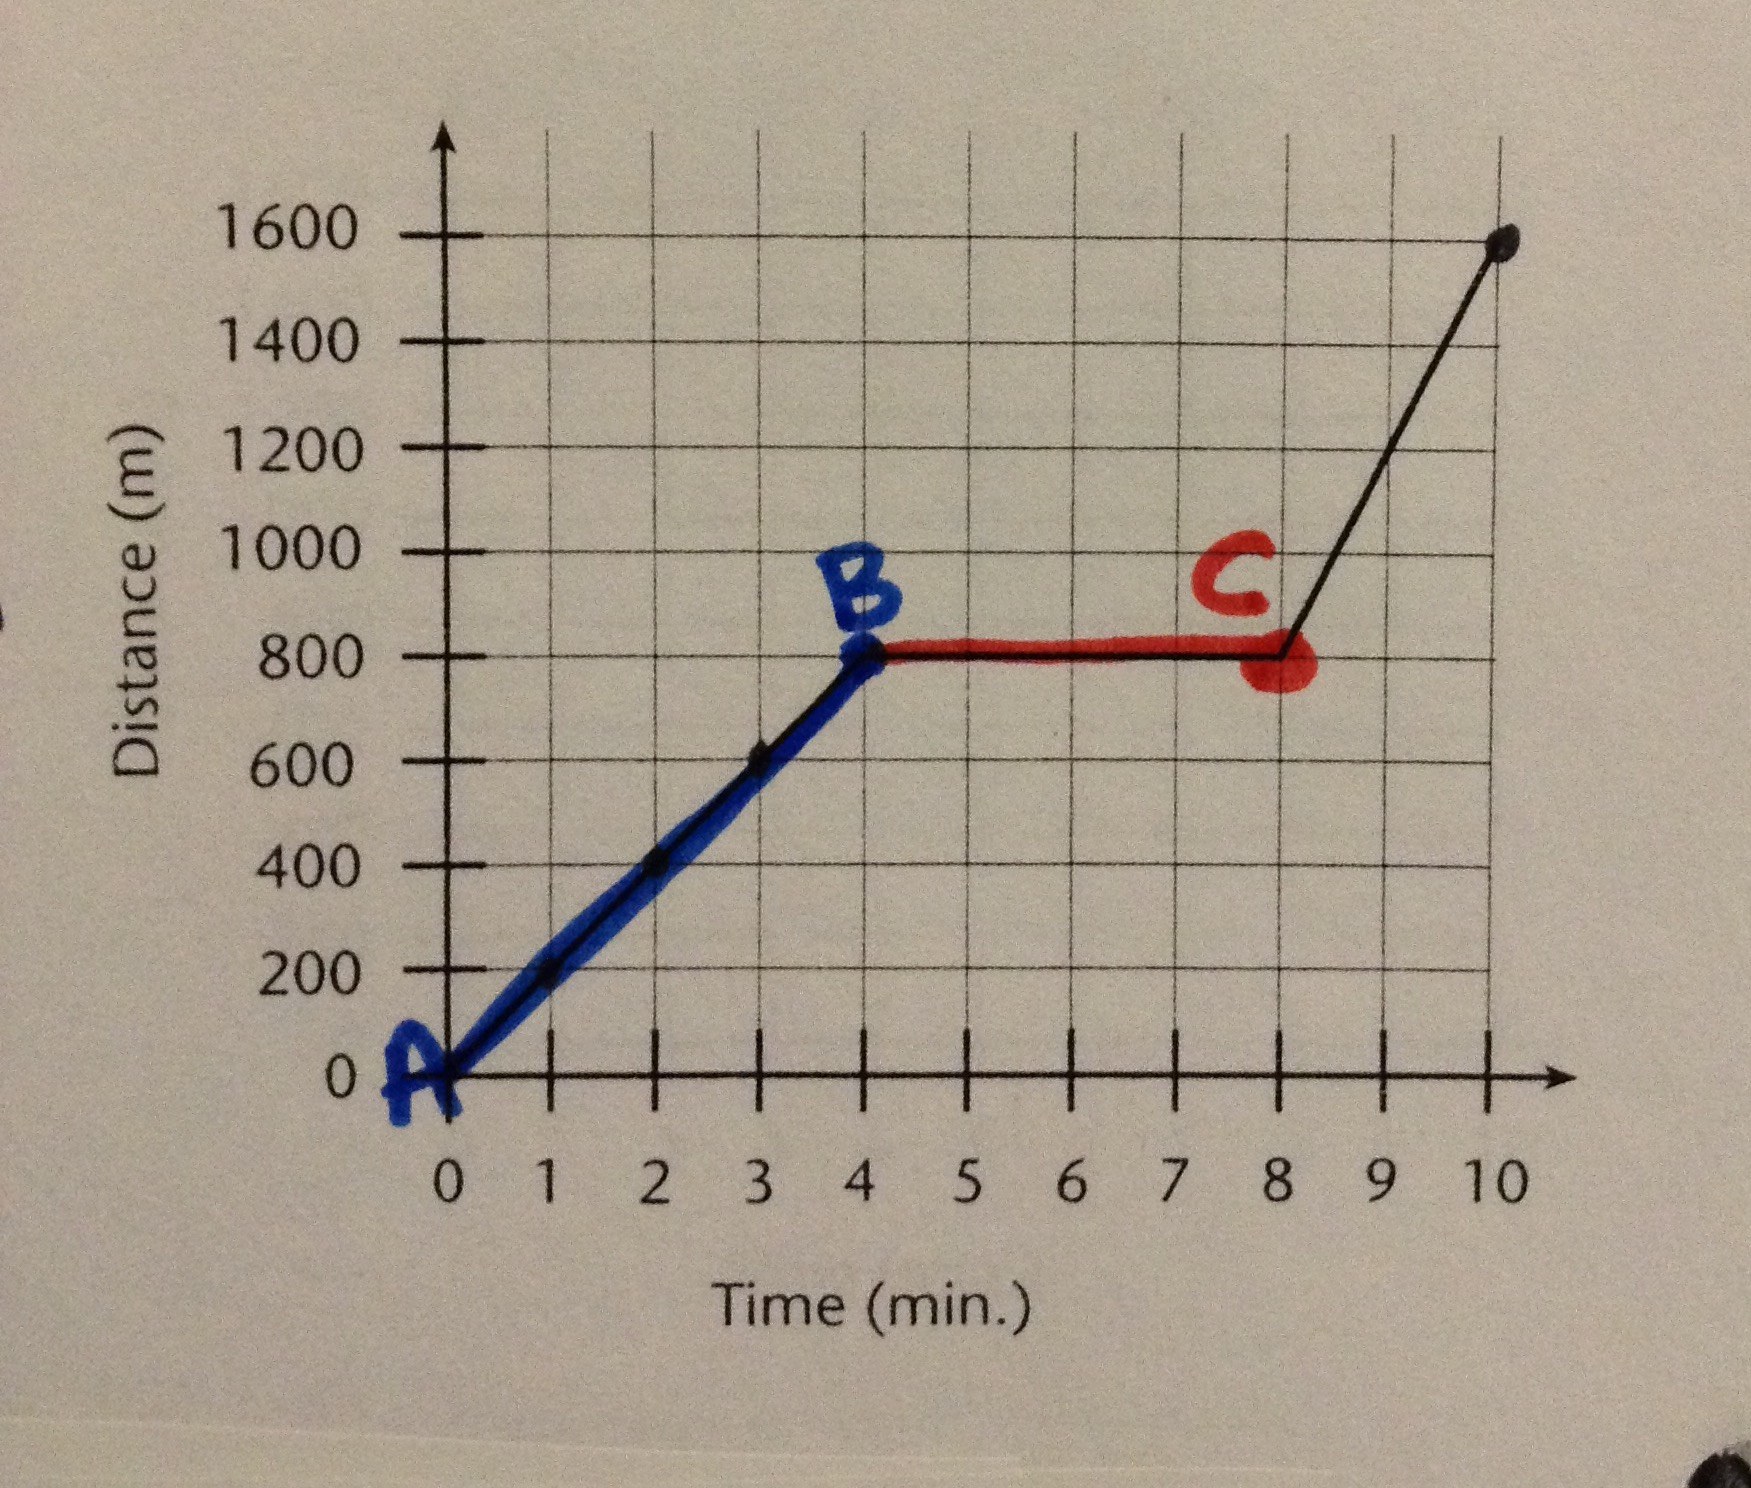
What is occurring from point A to point B?
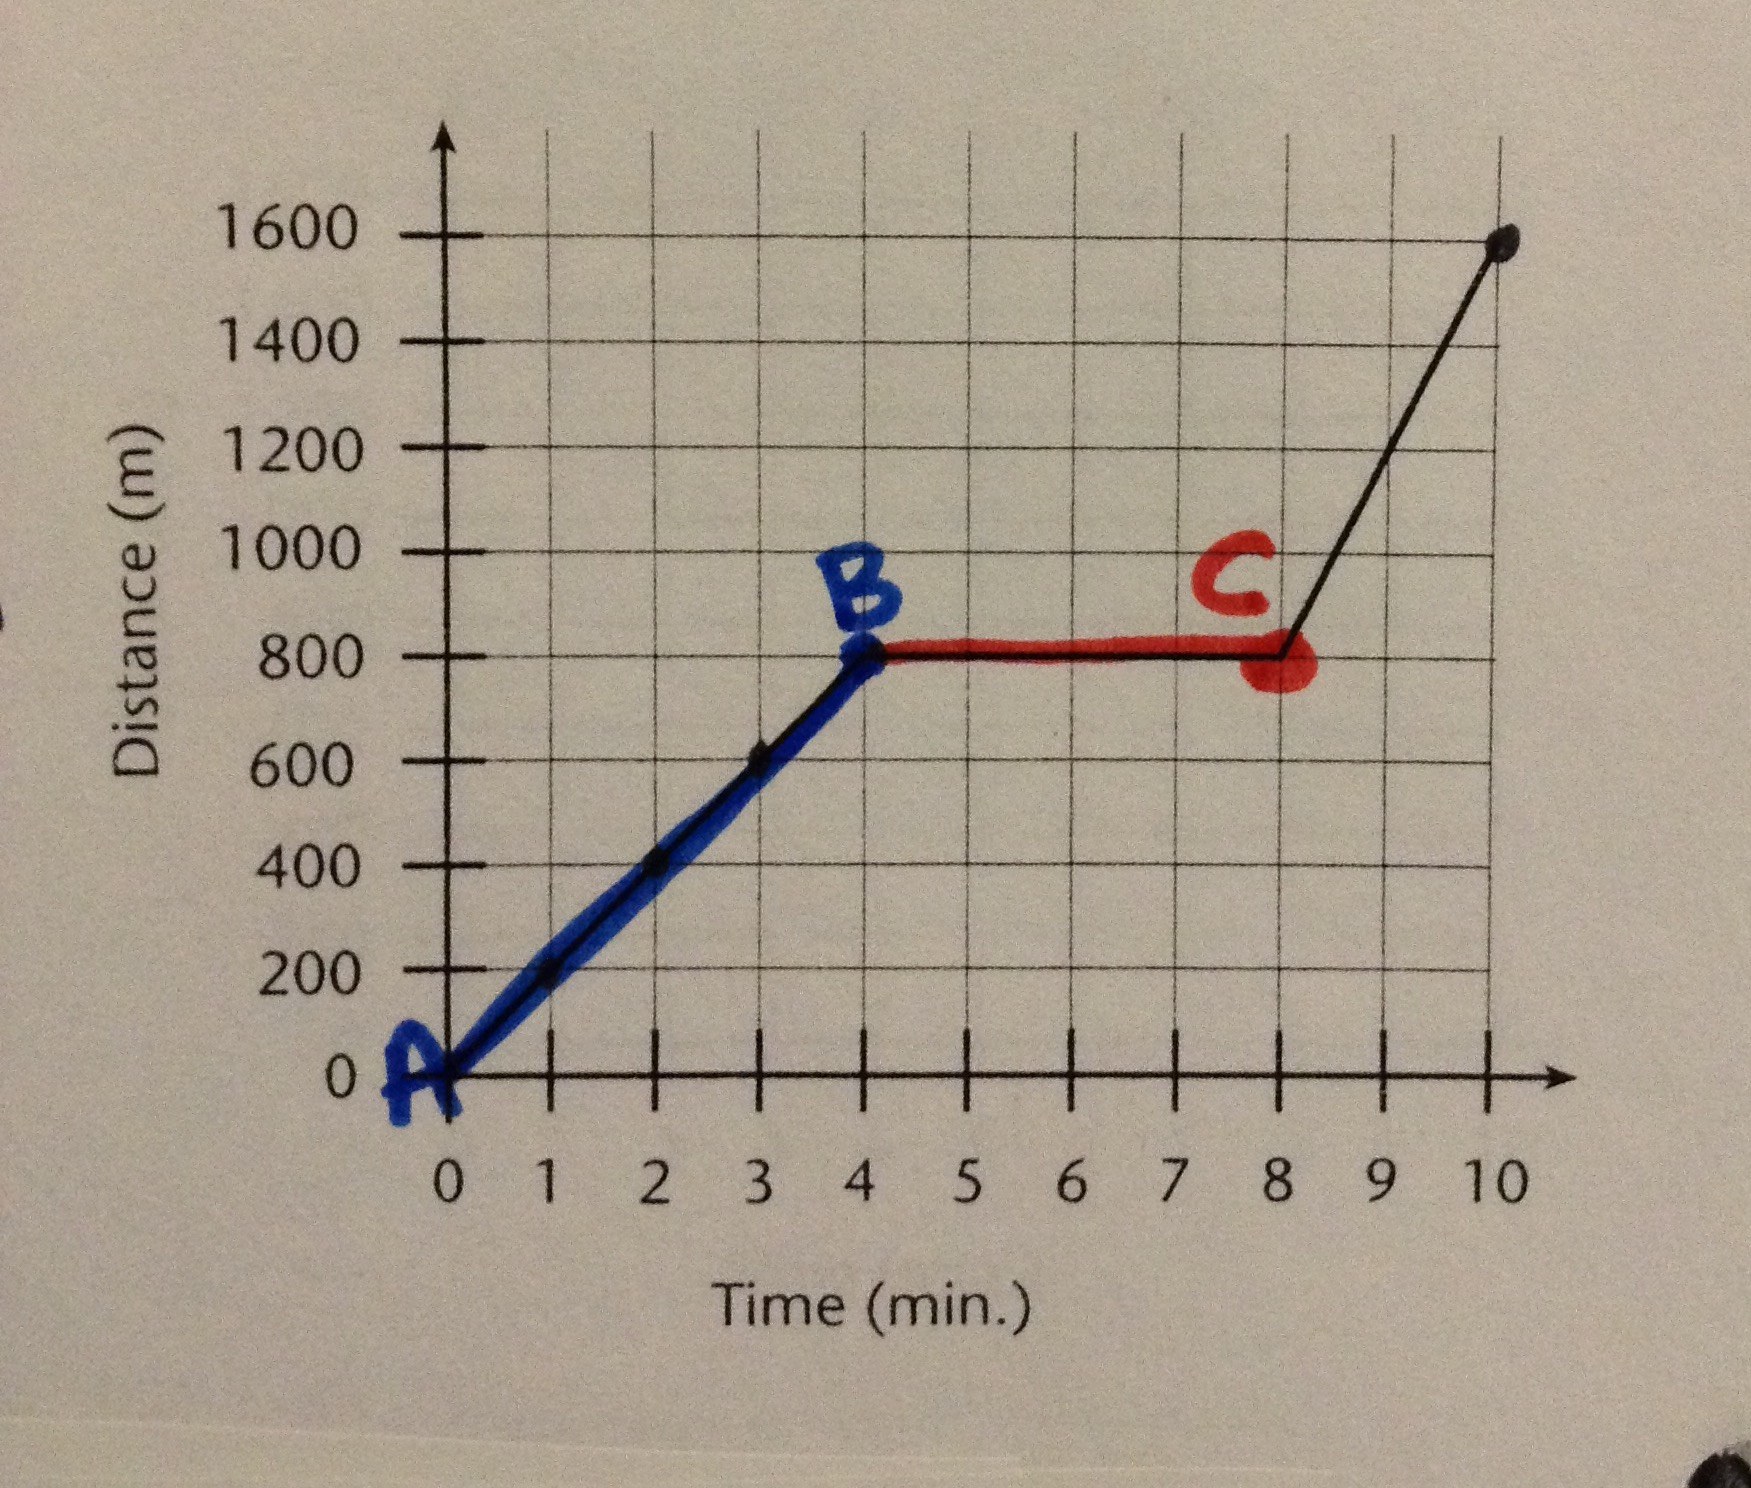
What was occurring from point B to point C?

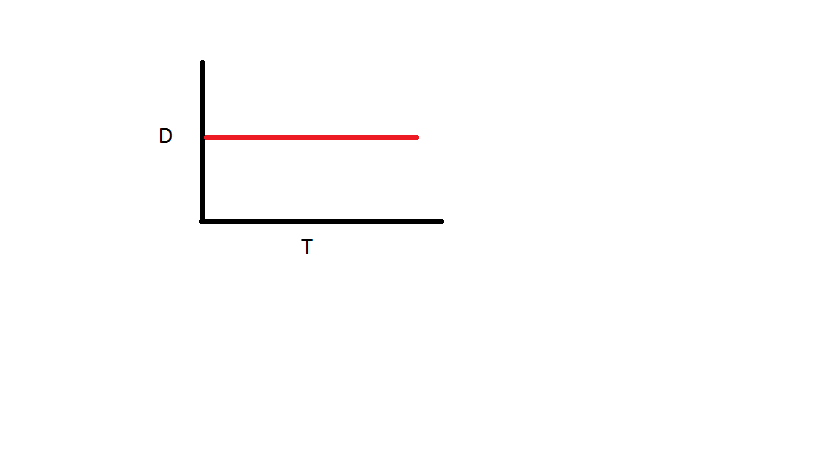
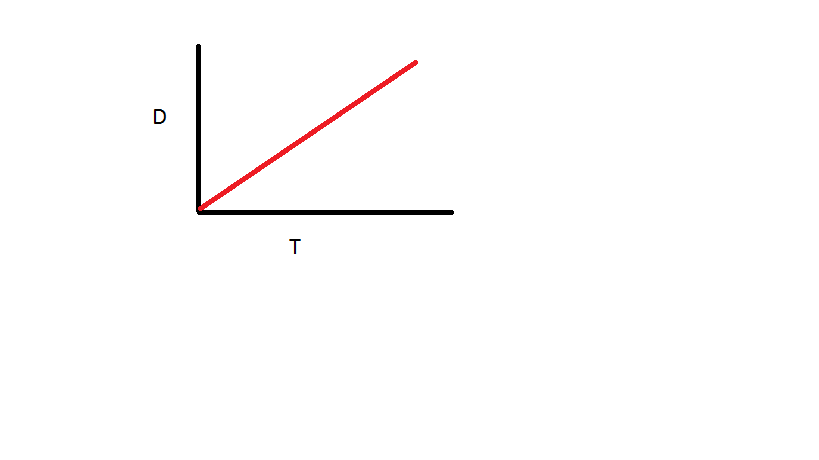


An airplane accelerates down a runway at 3.20 m/s/s for 32.8 s until is finally lifts off the ground. Determine the distance traveled before takeoff.
1720m
104.96m
1270m
2704m
vi
velocity
initial velocity
final velocity
acceleration
vf
velocity
initial velocity
final velocity
acceleration
acceleration units
m/s
m/s2
m2/s2
m
distance or displacement units
m/s
m/s2
m2/s2
m
time units (that we use in physics)
s
min
hr
year
a tiger travels 96 m in 8s. what is his velocity over the interval
0.04m/s
25m/s
225m/s
12m/s
what is the formula to calculate speed.
S=t/d
S=t/d
S=t x d
S=d x t

This could be the graph of a projectile's...
Horizontal Acceleration vs Time
Horizontal Velocity vs Time
Horizontal Position vs Time
Vertical Velocity vs Time

This graph could show a projectile's ...
Vertical Position vs. Time
Vertical Velocity vs. Time
Vertical Acceleration vs Time
Horizontal Velocity vs Time

This graph could show a projectile's ...
Vertical Velocity
Vertical Acceleration
Horizontal Velocity
Horizontal position

This graph shows the vertical velocity of an object that has been thrown in the air. When does the object reach its highest point.
0 seconds
4 seconds
8 seconds
10 seconds
This graph shows the vertical velocity of an object that has been thrown in the air. When does the object reach the ground again?
0 seconds
4 seconds
8 seconds
10 seconds
This graph shows the vertical velocity of an object that has been thrown in the air. The acceleration of this object is..
constant -10 m/s/s
increasing
decreasing
remaining zero

This Graph shows the vertical velocity of an object that has been thrown in the air. What was the object's vertical velocity when it was thrown?
-10 m/s
10 m/s
80 m/s
40 m/s
This Graph shows the vertical velocity of an object that has been thrown in the air. Its starting velocity is 40 m/s. What height does the object reach at its peak?
0 m
20 m
40 m
80 m
160 m

This Graph shows the vertical velocity of an object that is thrown up in the air. What is happening at 'A'
The object is moving up and slowing down
The object is moving up and speeding up
The object is moving down and slowing up
The object is moving down and speeding up
The object is stopped momentarily
This Graph shows the vertical velocity of an object that is thrown up in the air. What is happening at 'B'?
The object is moving up and slowing down
The object is moving up and speeding up
The object is moving down and slowing up
The object is moving down and speeding up
The object has reached the highest point
This Graph shows the vertical velocity of an object that is thrown up in the air. What is happening at 'C'?
The object is moving up and slowing down
The object is moving up and speeding up
The object is moving down and slowing up
The object is moving down and speeding up
The object is stopped momentarily
This Graph shows the vertical velocity of an object that is thrown up in the air. What is the acceleration at 'A'?
10 m/s/s
2 m/s/s
0 m/s/s
-10 m/s/s
This Graph shows the vertical velocity of an object that is thrown up in the air. What is the acceleration at 'B'?
10 m/s/s
2 m/s/s
0 m/s/s
-10 m/s/s
This Graph shows the vertical velocity of an object that is thrown up in the air. What is the acceleration at 'C'?
10 m/s/s
2 m/s/s
0 m/s/s
-10 m/s/s

Two projectiles are fired horizontally from the same height but with different velocities as shown in the picture. Which one will hit the ground first?
The one on the left.
The one on the right
They will hit at the same time.
Two projectiles are fired horizontally from the same height but with different velocities as shown in the picture. Which one will travel farther before hitting the ground?
The one on the left.
The one on the right
They will hit at the same time.

Two projectiles are fired horizontally with the same velocity but from different heights as shown in the picture. Which one will hit the ground first?
The one on the left.
The one on the right
They will hit at the same time.

The Data table shows how the velocity changes over time. What value should go in box A.
-10
0
10
30

The data table shows the velocity of a projectile. What value should go in box 'B'
-10
0
10
30
Two projectiles are fired horizontally with the same velocity but from different heights as shown in the picture. Which one will go farther before hitting the ground?
The one on the left.
The one on the right
They will hit at the same time.

If this velocity graph is from a projectile, what does the area of the shaded region represent?
Initial velocity
How high it got
The range
The acceleration

If this velocity graph is from projectile, what does the area of the shaded region represent.
The maximum height
The maximum velocity
Vertical acceleration
How long it was in the air

