
 Worksheets
Algebra I STAAR Reminders
Total questions: 55
Worksheet time: 55mins
Which equation should you type into desmos in order to find the equation of a linear table?
y∼mx+b
y=mx+b
y1=mx1+b
y1∼mx1+b
Which equation should you type into desmos in order to find the equation of a quadratic table?
y1∼ax12+bx1+c
y1∼ax12+bx+c
y∼ax12+bx1+c
y1∼mx1+b
Which equation should you type into desmos in order to find the equation of a exponential table?
y1∼a(b)x1
y∼a(b)x
y1∼a(b)x1
y∼a(b)x
Domain is
x
y
Domain is read from....
Top to Bottom
Bottom to Top
Left to Right
Right to Left
Range is
x
y
Range is read from....
Top to Bottom
Bottom to Top
Left to Right
Right to Left

The graph of part of linear function is g shown on the grid. Which inequality best represents the domain of the part shown?
-9 < x ≤ 2
-9 ≤ x < 2
-6 < g(x) ≤ 3
-6 ≤ g(x) < 3
Slope is also called...
Zero
Rate of Change
Y-intercept
Root
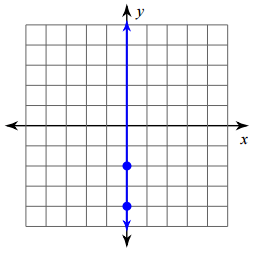
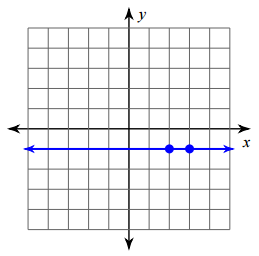
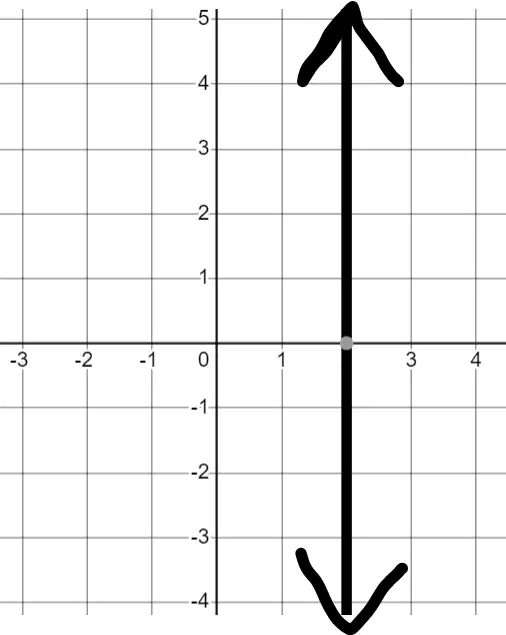
What is the slope of the line and its equation?
Slope: Zero
Equation: y=2
Slope: Zero
Equation: x=2
Slope: Undefined
Equation: x=2
Slope: Undefined
Equation: y=2
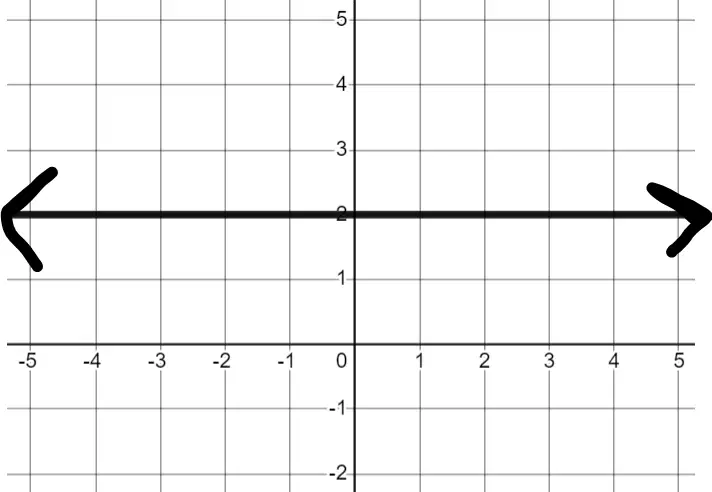
What is the slope of the line and its equation?
Slope: Zero
Equation: y=2
Slope: Zero
Equation: x=2
Slope: Undefined
Equation: x=2
Slope: Undefined
Equation: y=2
To find the slope of a graph, you must find the...
runrise
riserun

To find the slope of a table, you must find the...
change in xchange in y
change in ychange in x

What is the Slope represented in this table?
slope: −41
slope: −4
slope: 41
slope: 4

What is the zero of the following function?
23
3
-2
32

Which graph is correct for y = -x + 3?
A
B
y = -3x + 7
You were asked to graph 2y−4x = 8 . You cannot graph it just yet, what do you have to do first?
find the opposite of 8
make it into a quadratic
solve for y so it looks like y=mx+b
solve for x to get your answer
(4, -7); m = -1/4
y - 3 = 2(x + 4),
the line has a slope of 2 and contains what point?
The slope of parallel lines are...
flipped sign and flipped fraction
opposite signs
the same
Which function is parallel to the line y=43x−5 ?
y=−43x+2
y=43x+2
y=34x+2
y=−34x+2
The slope of perpendicular lines are...
flipped sign and flipped fraction
opposite signs
the same
Which function is perpendicular to the line y=43x−5 ?
y=−43x+2
y=43x+2
y=34x+2
y=−34x+2

What is the solution to the following system of equations?
(4, 3)
(3, 4)
(-4, 3)
No solution
How would you graph ≥
Shade Above
Solid Line
Shade Above
Dashed Line
Shade Below
Solid Line
Shade Below
Dashed Line
How would you graph <
Shade Above
Solid Line
Shade Above
Dashed Line
Shade Below
Solid Line
Shade Below
Dashed Line
How would you graph ≤
Shade Above
Solid Line
Shade Above
Dashed Line
Shade Below
Solid Line
Shade Below
Dashed Line
How would you graph >
Shade Above
Solid Line
Shade Above
Dashed Line
Shade Below
Solid Line
Shade Below
Dashed Line

which equation best represents this graph?
y < 1/2x + 1
y < 1/2x + 2
y >1/2x + 2
y > 2x


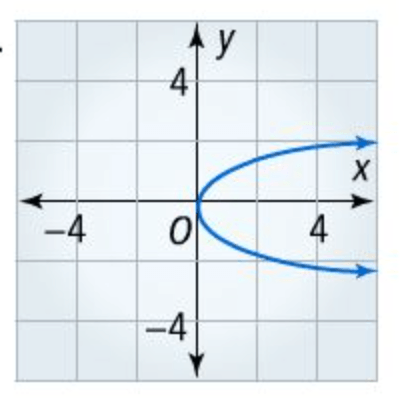


Estimate the correlation coefficient
r= -0.9
r= 0.9
r=-0.5
r=0.5
Which example shows CAUSATION? (Which one CAUSED the other to happen.)
Rainfall and time spent reading.
Eating more butter and increased divorce rates.
It started raining and the baseball game was delayed.
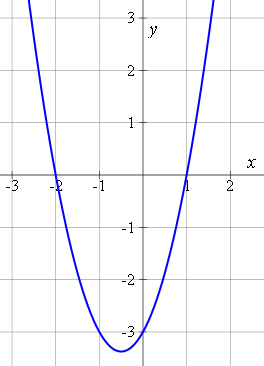
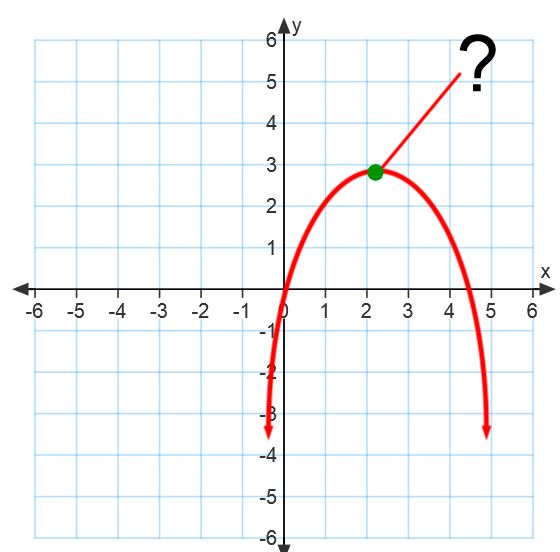

The graph of a quadratic function is shown on the grid. Which equations best represents the axis of symmetry?
y = 6
x = 2
y = 4
x = 0
The graph of f(x)= x2 was transformed to create the graph of g(x) = (x - 7.5)2. Which of these describes the transformation?
A horizontal shift to the right 7.5 units
A horizontal shift to the left 7.5 units
A vertical shift down 56.25 units
A vertical shift up 56.25 units
The graph of f(x)= x2 was transformed to create the graph of g(x) = x2 + 7.5. Which of these describes the transformation?
A horizontal shift to the right 7.5 units
A horizontal shift to the left 7.5 units
A vertical shift down 7.5 units
A vertical shift up 7.5 units
The graph of f(x)= x2 was transformed to create the graph of g(x) = 41 x2 Which of these describes the transformation?
Vertical Stretch (thinner)
Vertical Compression (wider)
The graph of f(x)= x2 was transformed to create the graph of g(x) = 4x2 Which of these describes the transformation?
Vertical Stretch (thinner)
Vertical Compression (wider)
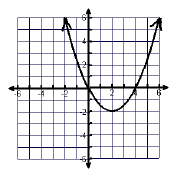

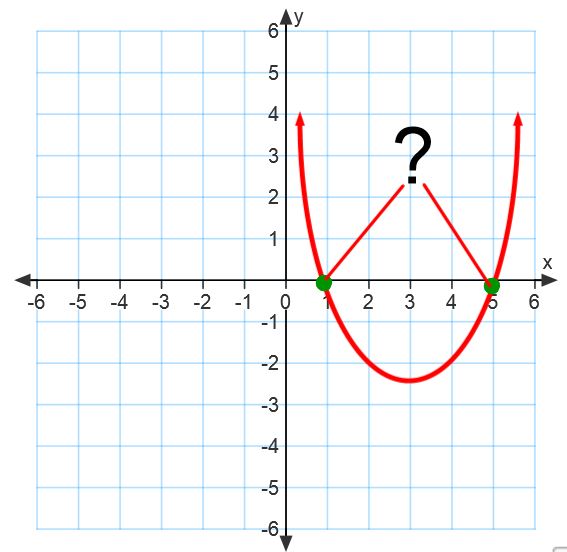
Use the graph to determine the solutions.
x=1 and x=5
x=-1 and x=-5
x=-1 and x=5
x=0 and x=5
Use the graph to determine the factors.
(x+1)(x+5)
(x-1)(x-5)
(x-1)(x+5)
(x+1)(x-5)

Which table represents the following equation?


The cost of tuition at a college is $12,000 and is increasing at a rate of 6% per year. Write an exponential function to model the situation.
C(t) = 12000(.94)t
C(t) = 12000(.06)t
C(t) = 12000(1.06)t
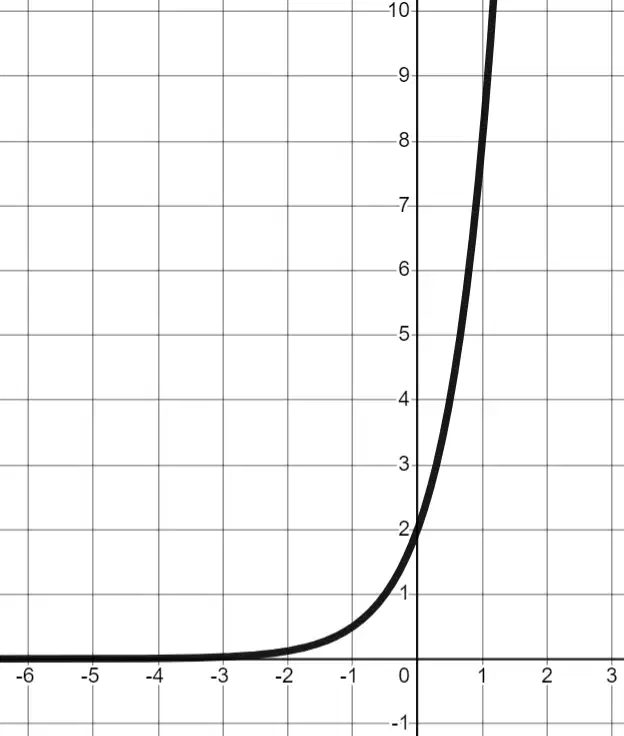
What is the equation of the following function?
y=2+(4)x
y=4(2)x
y=2(4)x
y=4+(2)x

