wayground logo

Free Printable Worksheets

Font size

S
M
L
XL
Worksheets

Chapter 9 Review

Total questions: 80

Worksheet time: 4hrs 13mins

Name
Class
Date
1.
Based on the graph, if Joe earned $400, how many hours did he work?
a)
20 hours
b)
35 hours
c)
45 hours
d)
15 hours
2.
Which of the following lines represents the line of best fit for the scatter plot?
a)
A
b)
B
c)
C
d)
D
3.
Find the slope for the trend line using points (2,2) and (4,3)
a)
2
b)
1/2
c)
-2
d)
-1/2
4.
In the scatter plot, does the image shows a "Line of Best Fit"?
a)
Yes
b)
No
5.
Which scatter plot shows a negative relationship?
a)
Graph A
b)
Graph B
c)
Graph C
d)
Graph D
6.
Which scatter plot shows no relationship?
a)
Graph A
b)
Graph B
c)
Graph C
d)
Graph D
7.
Which scatter plot show a positive relationship?
a)
Graph A
b)
Graph B
c)
Graph C
d)
Graph D
8.
What type of correlation does this graph have?
a)
Negative 
b)
no association
c)
positive 
9.
Make a prediction for a resting heart rate after 6 hours of exercise a week.
a)
6
b)
50
c)
55
d)
59
10.

Which sentence describes the relationship shown on this scatter plot?

a)

As the temperature decreases, the visitors increase.

b)

As the temperature increases, the number of visitors increases.

c)

As the visitors increase, the temperature decreases.

d)

No correlation

11.
You are analyzing a scatter plot that has a negative correlation. What is true of the of the x and y values?
a)

As x increases, y decreases

b)

As x increases, y increases

c)

As x decreases, y decreases

12.
As x increases, y increases
a)
correlation coefficient
b)
causation
c)
positive correlation
d)
negative correlation
13.
What is a scatter plot?
a)
A graph that shows the relationship of two data sets.
b)
A graph drawn using rectangular bars to show how large each value is.
c)
A graph that shows information that is connected in some way.
d)
A graph that shows data changing over time.
14.
What represents the y axis?
a)
ABC Company
b)
Hours Worked
c)
Amount Earned in Dollars
d)
Hours in Car
15.
What represents the x axis?
a)
ABC Company
b)
Hours Worked
c)
Amount Earned in Dollars
d)
Hours in Car
16.

What type of correlation does this graph have?

a)

positive 

b)

negative

c)

none

d)

all of the above

17.

What is the correlation?

a)

Negative correlation

b)

No correlation

c)

Positive correlation

18.

Match the following

a)
1.

Non-linear Correlation

b)
2.

No Correlation

c)
3.

Positive, Linear Correlation

d)
4.

Negative, Linear Correlation

19.
Which scatter plot shows a linear relationship between x and y?
a)

Graph A

b)

Graph B

c)

Graph C

d)

Graph D

20.

This implies that one variable has a direct affect on the other variable.

a)

Correlation

b)

Causation

21.

Correlation or Causation?

The number of times you come to tutoring and your test scores improving

a)

Correlation

b)

Causation

22.

Correlation or Causation?

The inches of snowfall and the number of heart attacks

a)

Correlation

b)

Causation

23.

What are the coordinates of the outlier?

a)

(1,9)

b)

(9,1)

c)

(2,2)

d)

y=x

24.
Which of the following lines represents the line of best fit for the scatter plot?
a)
A
b)
B
c)
C
d)
D
25.
Which of the following lines represents the line of best fit for the scatter plot?
a)

A

b)

B

c)

C

d)

D

26.

Estimate the correlation coefficient for this scatterplot.

a)

A) r = 1.2

b)

B) r = 0.89

c)

C)r = 0

d)

D) r = -0.89

27.

Estimate the correlation coefficient for this scatterplot.

a)

A) r = -0.9

b)

B) r = 1

c)

C) r = 0.9

d)

D) r = -1

28.

Average time spent listening to music per day and average time spent watching TV per day.  r=.17r=-.17  

a)

strong positive

b)

strong negative

c)

weak positive

d)

weak negative

29.

Score on science exam and number of words written on the essay question.  r=.28r=.28  

a)

strong positive

b)

strong negative

c)

weak positive

d)

weak negative

30.

Number of steps taken per day and number of kilometers walked per day. r=.92r=.92  

a)

strong positive

b)

strong negative

c)

weak positive

d)

weak negative

31.
Which of the following lines represents the line of best fit for the scatter plot?
a)
A
b)
B
c)
C
d)
D
32.

What is the equivalent percent to 0.05?

a)

50%

b)

500%

c)

5%

d)

0.05%

33.

136 out of 200 college students had a student loan. Calculate the percent.

a)

68%

b)

14.7%

c)

6.8%

d)

71%

34.

How many males were surveyed?

a)

77

b)

15

c)

150

d)

52

35.

What number should go in the blue box?

a)

21

b)

135

c)

19

d)

22

36.

How many total have no cell phone?

a)

13

b)

9

c)

22

d)

100

37.

How many total people were surveyed?

a)

78

b)

22

c)

70

d)

100

38.
According to the table, what is the relative frequency of students ages 10 - 13 who eat breakfast?
a)
About 33%
b)
About 50%
c)
About 40%
d)
About 44%
39.
How many females were surveyed?
a)
10
b)
16
c)
26
d)
14
40.
What was the most popular party type?
a)
Bowling
b)
Skating
c)
Dancing
d)
Total
41.
What percentage of males drive sports cars?
a)
35%
b)
16.25%
c)
65%
d)
25%
42.
Out of those surveyed, what is the probability that the student is a boy who can't bike to school (in simplest form)?
a)
4/30
b)
7/30
c)
2/15
d)
14/30
43.

A survey was given to decide what sport males & females prefer to watch on TV. What is the GRAND TOTAL of people that were surveyed?

a)

48

b)

52

c)

100

d)

36

44.

How many males were surveyed?

a)

48

b)

52

c)

31

d)

36

45.

How many females were surveyed?

a)

48

b)

52

c)

31

d)

36

46.

How many males that were surveyed prefer basketball?

a)

13

b)

15

c)

20

d)

48

47.

How many females that were surveyed prefer football?

a)

23

b)

16

c)

13

d)

52

48.

How many total people prefer baseball?

a)

36

b)

31

c)

33

d)

100

49.

How many total people prefer football?

a)

36

b)

31

c)

33

d)

100

50.

What is the JOINT relative frequency of a female preferring basketball (take the inner cell divided by the grand total)?

a)

31%

b)

100%

c)

52%

d)

16%

51.
Which best describes the form of this scatterplot?
a)
linear
b)
nonlinear
c)
scattered
52.
What is a line of best fit used for?
a)
To make predictions
b)
To make the graph look pretty
c)
To connect the points
d)
To make it look like you know what you are doing
53.
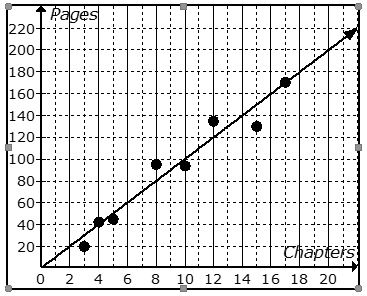
The scatter plot shows the relationship between the number of chapters and the total number of pages for several books.  Use the trend line to predict how many chapters would be in a book with 180 pages. 
a)
12 chapters
b)
15 chapters
c)
18 chapters
d)
21 chapters
54.
Select the statement that best describes the line.
a)
The line is the line of best fit.
b)
The line is NOT a line of best fit because it does not pass through two points.
c)
The line is NOT a line of best fit because it does not go through the middle of the data set.
d)
The line is NOT a line of best fit because it does not go through the origin.
55.

Which scatterplot shows a negative relationship?

a)
b)
c)
56.

Which shows a line of best fit?

a)
b)
c)
d)
57.

If m = 8/5 and b = -8/5, what is the equation of the trend line in y= mx + b?

a)

0 = 8/5 (1) - 8/5

b)

y = -8/5 x + 8/5

c)

y = 8/5 x - 8/5

d)

y = mx + b

58.

If m = -3/4 and b = 9, what is the equation of the trend line in y= mx + b?

a)

0 = -3/4 (9) +9

b)

y = -3/4 x + 9

c)

y = -3/4 x - 9

d)

y = 3/4 + 9

59.

The scatterplot shows the temp, in degrees, outside a house every hour for 10 hours.

Estimate the temp after 13 hours based off the trendline.

a)

57.5

b)

50

c)

10

d)

13

e)

61.5

60.

What does the x variable represent?

a)

The number of laps

b)

The amount of time in hours

c)

The amount of time in minutes

d)

How long it takes to go 0 laps

61.
Is the relation a function? 
{(4,5), (4,-7), (4,2), (4,0), (4,9)}
a)
Yes
b)
No
62.

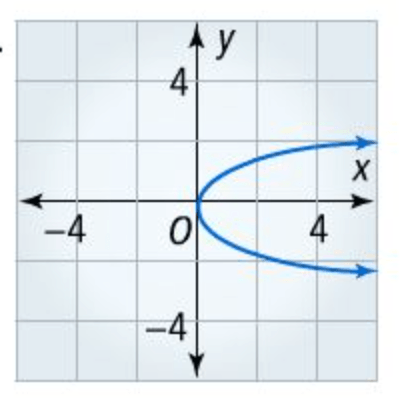
Does the graph represent a function?

a)

Yes

b)

No

63.

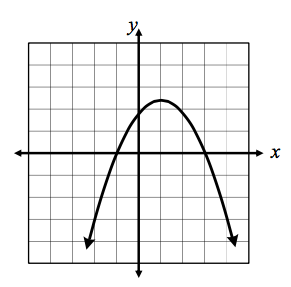
Does the graph represent a function?

a)

Yes

b)

No

64.
Find the slope of the line.
a)
-2
b)
2
c)
-1
d)
1
65.
Find the slope of the line.
a)
1/4
b)
-1/4
c)
-4
d)
4
66.
Find the slope of the line.
a)
Undefined
b)
0
c)
1
d)
-1
67.
What is the slope?
y = 3x + 1
a)
m = 3
b)
m = 3x
c)
m = 1
d)
m = 4
68.
What does 'b" represent in y=mx=b
a)
y-intercept
b)
macaroni
c)
nothing
d)
slope
69.
What is the rate of change?
a)
1/2
b)
2
c)
7
d)
3
70.
What is the rate of change?
a)
5
b)
1/5
c)
15
d)
10
71.
Find the slope of the line.
a)
Undefined
b)
0
c)
1/1
d)
-1/1
72.

Find the slope of the table.

(a)  

73.

Find the slope of the table.

(a)  

74.

Find the slope of the table.

a)

-1/2

b)

-2

c)

1/2

d)

2

75.
What is the slope in the equation:  y=4x+3
a)
3
b)
4x
c)
4
d)
x
76.
How would you write the equation with a slope of 2/3 and a y-intercept of -3
a)
y=3/2x+3
b)
y=2/3-3
c)
y=2/3x-3
d)
y=2/3x+3
77.
If m=3 and b=6, what is the correct slope intercept equation?
a)
y=3-6
b)
y=3x-6
c)
y=3x+6
d)
y=6x+3
78.
Write the equation of the line.
a)
y = -1/3x - 2
b)
y = 1/3x - 2
c)
y = 3x - 2
d)
y = -3x - 2
79.
Write the equation of the line.
a)
y = -2/3x + 4
b)
y = 2/3x + 4
c)
y = 3/2x + 4
d)
y = -3/2x + 4
80.
Find the slope.
a)
2/5
b)
-2/5
c)
5/2
d)
-5/2