
 Worksheets
Science PAT Review (Other)
Total questions: 40
Worksheet time: 26mins
gathering information through the use of 5 senses
Hypothesis
Observation
Inferring
Manipulated Variable
conclusion
idea or conclusion that's drawn from evidence and reasoning.
Conclusion
Question
Scientific Method
Inference
What are the 3 types of variables
Red
Manipulated
Functional
Controlled
Responding
What is the maninpulated variable
What you keep the same
What you change
What happens or what you measure
What is the controlled variable
What you keep the same
What you change
What happens or what you measure
What is the responding variable
What you keep the same
What you change
What happens or what you measure
Purpose Question: How does being late for class impact test scores?
What is the responding variable?
test scores
the time a student arrives to class
amount of time to complete test
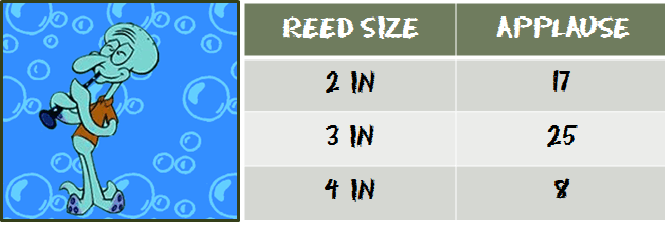
Squidward found new reeds to try out in his clarinet. He used an applausometer to measure applause after playing Under the Sea with each reed. The results were put in the table.
What was the responding variable?
The Song
The Reed
The Applause
A scientist was trying to see if the amount of water a plant gets affects plant growth. She collected 10 identical plants and gave them different amounts of water. She measured their daily growth. The plants received the same amount of sunlight.
In this experiment what is the manipulated variable?
The amount each plant grows
Amount of sunlight each plant is exposed to
Amount of water given to each plant
That all 10 plants were identical
A scientist was trying to see if the amount of water a plant gets affects plant growth. She collected 10 identical plants and gave them different amounts of water. She measured their daily growth. The plants received the same amount of sunlight.
In this experiment what is the responding variable?
The amount each plant grows
Amount of sunlight each plant is exposed to
Amount of water given to each plant
The mass of fertilizer given to each plant
A scientist was trying to see if the amount of water a plant gets affects plant growth. She collected 10 identical plants and gave them different amounts of water. She measured their daily growth. The plants received the same amount of sunlight.
Select ALL of the controlled variables
Amount of sunlight each plant is exposed to
That all 10 plants were identical
Amount of water given to each plant
The amount each plant grows
A scientist was trying to determine if a shape of hot air balloons impacted how high they went. The shape of 10 hot air balloons was varied. 5 were cones while 5 of them were round. The altitude (how high they went) was measured.
The responding variable would be:
The shape of the balloons
The maximum altitude each balloon reached
Weather conditions were the same for each balloon flight
The air inside each balloon was identical
The 5 cone shaped balloons
A scientist was trying to determine if a shape of hot air balloons impacted how high they went. The shape of 10 hot air balloons was varied. 5 were cones while 5 of them were round. The altitude (how high they went) was measured.
The two controlled variables would be:
The shape of the balloons
The maximum altitude each balloon reached
Weather conditions were the same for each balloon flight
The air inside each balloon was identical
The 5 cone shaped balloons
A scientist was trying to determine if a shape of hot air balloons impacted how high they went. The shape of 10 hot air balloons was varied. 5 were cones while 5 of them were round. The altitude (how high they went) was measured.
The manipulated variable would be:
The shape of the balloons
The maximum altitude each balloon reached
Weather conditions were the same for each balloon flight
The air inside each balloon was identical
The 5 cone shaped balloons
A students wants to determine if the shape of a container affects how fast water will evaporate from it.
The manipulated variable would be
The shape of the container
The material the container is made of
The decrease in water mass that occurs every hour
The temperature of the room
The humidity of the room
A students wants to determine if the shape of a container affects how fast water will evaporate from it.
The manipulated variable would be
The shape of the container
The material the container is made of
The decrease in water mass that occurs every hour
The temperature and humidity of the room
A students wants to determine if the shape of a container affects how fast water will evaporate from it.
The controlled variables would be
The shape of the container
The material the container is made of
The decrease in water mass that occurs every hour
The temperature and humidity of the room
Problem: How does the amount of fertilizer a farmer uses affect the number of beans harvested?
The controlled variable would be:
The amount of fertilizer used
The number of beans harvested from the plant
10 plants with no fertilizer
40 plants given various amounts of fertilizer
The amount of water each plant receives
Problem: How does the amount of fertilizer a farmer uses affect the number of beans harvested?
The manipulated variable would be:
The amount of fertilizer used
The number of beans harvested from the plant
10 plants with no fertilizer
40 plants given various amounts of fertilizer
The amount of water each plant receives
Problem: How does the amount of fertilizer a farmer uses affect the number of beans harvested?
The responding variable would be:
The amount of fertilizer used
The number of beans harvested from the plant
10 plants with no fertilizer
40 plants given various amounts of fertilizer
The amount of water each plant receives
Problem: How does the amount of junk food a student eats affect the number of cavities he or she gets?
What is the responding variable?
mass of junk food consumed
number of new cavities in a year
number of times students brush their teeth in a day
the toothpaste students use
a group of students that eats no junk food
Problem: How does the amount of junk food a student eats affect the number of cavities he or she gets?
What are the two controlled variables?
mass of junk food consumed
number of new cavities in a year
number of times students brush their teeth in a day
the toothpaste students use
a group of students that eats no junk food
Problem: How does the amount of junk food a student eats affect the number of cavities he or she gets?
What is the manipulated variable.
mass of junk food consumed
number of new cavities in a year
number of times students brush their teeth in a day
the toothpaste students use
a group of students that eats no junk food

The following data was collected in a student experiment. What is the responding variable?
Size of the sugar cube
Time it took to dissolve
The solvent used (water)
The temperature of the water
The following data was collected in a student experiment. What is the manipulated variable
Size of the sugar cube
Time it took to dissolve
The solvent used (water)
The temperature of the water
The following data was collected in a student experiment. What are the controlled variables?
Size of the sugar cube
Time it took to dissolve
The solvent used (water)
The temperature of the water
Factors that remain the same in an experiment to make it fair are called the
controlled variables
manipulated variables
responding variables
tested variables

You are measuring the temperature of water that just had ice place into it. If you took the temperature at 20 minutes, what is a reasonable temperature?
20
50
80
85

If the hippo population trend continues, what will the population be in 2011?
12
24
42
38
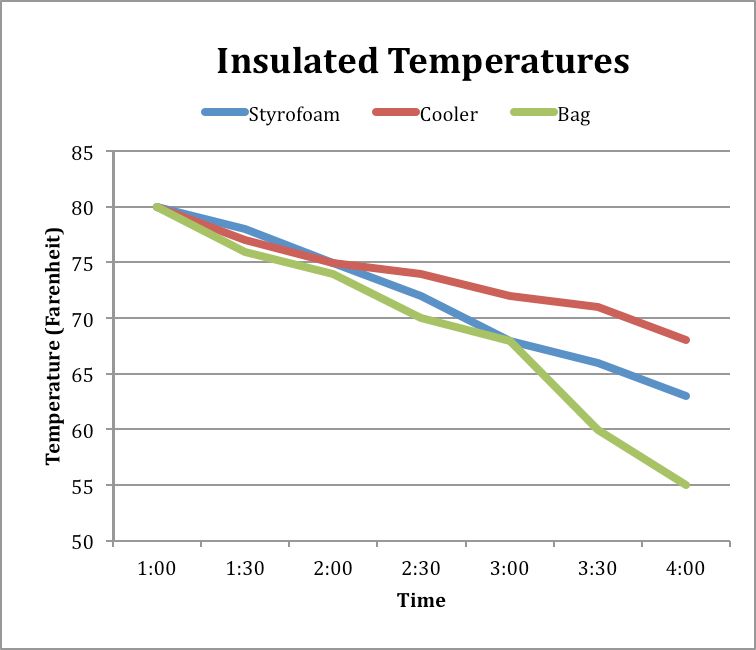
What was the temperature of the liquid in the Styrofoam container at 4:00?
55 degrees
68 degrees
73 degrees
63 degrees

What is the responding variable in the test shown above?
Colour of the pen
Type of filter paper
Separation of the ink
Length of the filter paper

Which of the following rows identifies the manipulated variable and a controlled variable in this experiment?


The heights of two poplar trees grown in different locations are recorded over a five-year period. Both trees have the same exposure to sunlight and receive the same amount of water. Both trees experience the same air temperature. The resulting heights of both trees are recorded in the graph below. The responding variable in this experiment is
time
tree height
temperature
amount of water given

Stacie’s class set up the shown chromatography experiment, what is the manipulated variable?
colour of the pen
length of filter paper
type of black ink used
volume of water added to the beaker

The students in a Grade 6 class had their right index fingerprints analyzed. The results of the analysis are presented in the graph below. Which of the following conclusions could be correctly made about the Grade 6 class?
Less than half of students have a right index finger with an arch fingerprint.
More girls than boys have a right index finger with a loop fingerprint.
Less girls than boys have right index fingers with whorl fingerprints.
Most students have a right index finger with a mixed fingerprint.

A student conducts an experiment to determine the effects of salt in soil on the germination and growth of seeds. The following chart shows the results. Which of the following conclusions could be made from the results of this experiment?
The more salt there is in the soil, the taller the plants grow.
The more water there is in the soil, the shorter the plants grow.
The more water there is in the soil, the greater the percentage of living plants.
The more salt there is in the soil, the lower the percentage of seeds germinated.

A Grade 6 class conducts an experiment to test the growth rate of spruce tree seedlings in different temperatures. They write up their experiment using the following outline. In which of the sections above would students place a graph showing the growth of the spruce tree seedlings at different temperatures?
Hyothesis
Materials and Design
Oberservations
Conclusions

