
 Worksheets
Bio Unit 1 Review
Total questions: 146
Worksheet time: 5hrs 43mins
Different types of rose bushes are grown in a greenhouse for two months. The number of flowers on each bush is counted at the end of the experiment.
(What’s the Independent Variable?)
The number of flowers.
Different types of rose bushes.
The greenhouse.
There isn't one.
You water three sunflower plants with salt water. Each plant receives a different concentration of salt solutions. A fourth plant receives pure water. After a two- week period, the height is measured.
(What’s the Independent Variable?)
Height of the plant.
Type of plant.
Concentration of salt solution.
Plant getting pure water.
Different rose bushes are grown in a greenhouse for two months. The number of flowers on each bush is counted at the end of the experiment.
(What’s the Control Group?)
The number of flowers.
Different types of rose bushes.
The greenhouse.
There isn't one.
Three redwood trees are kept at different humidity levels inside a greenhouse for 12 weeks. One tree is left outside in normal conditions. The heights of the trees are measured once a week.
(What’s the Independent Variable?)
Humidity level.
Height of each tree.
The tree left outside.
Type of tree.
You water three sunflower plants with salt water. Each plant receives a different concentration of salt solutions. A fourth plant receives pure water. After a two- week period, the height is measured.
(What’s the Dependent Variable?)
Height of the plant.
Type of plant.
Concentration of salt solution.
Plant getting pure water.
Pea plant clones are given different amounts of water for a three-week period. The first pea plant receives 400 milliliters a day. The second pea plant receives 200 milliliters a day. The third pea plant receives 100 milliliters a day. The fourth pea plant does not receive any extra water: the plant only receives natural ways of receiving water. The heights of the pea plants are recorded daily.
(What’s the Independent Variable?)
Height of the plant.
Amount of water.
The plant only getting water naturally.
Type of plant.
Pea plant clones are given different amounts of water for a three-week period. The first pea plant receives 400 milliliters a day. The second pea plant receives 200 milliliters a day. The third pea plant receives 100 milliliters a day. The fourth pea plant does not receive any extra water: the plant only receives natural ways of receiving water. The heights of the pea plants are recorded daily.
(What’s the Control Group?)
Height of the plant.
Amount of water.
The plant only getting water naturally.
Type of plant.
Three redwood trees are kept at different humidity levels inside a greenhouse for 12 weeks. One tree is left outside in normal conditions. The heights of the trees are measured once a week.
(What’s the Dependent Variable?)
Humidity level.
Height of each tree.
The tree left outside.
Type of tree.
Different types of rose bushes are grown in a greenhouse for two months. The number of flowers on each bush is counted at the end of the experiment.
(What’s the Dependent Variable?)
The number of flowers.
Different types of rose bushes.
The greenhouse.
There isn't one.
You water three sunflower plants with salt water. Each plant receives a different concentration of salt solutions. A fourth plant receives pure water. After a two- week period, the height is measured.
(What’s the Control Group?)
Height of the plant.
Type of plant.
Concentration of salt solution.
Plant getting pure water.
Three redwood trees are kept at different humidity levels inside a greenhouse for 12 weeks. One tree is left outside in normal conditions. The heights of the trees are measured once a week.
(What’s the Control Group?)
Humidity level.
Height of each tree.
The tree left outside.
Type of tree.
Pea plant clones are given different amounts of water for a three-week period. The first pea plant receives 400 milliliters a day. The second pea plant receives 200 milliliters a day. The third pea plant receives 100 milliliters a day. The fourth pea plant does not receive any extra water: the plant only receives natural ways of receiving water. The heights of the pea plants are recorded daily.
(What’s the Dependent Variable?)
Height of the plant.
Amount of water.
The plant only getting water naturally.
Type of plant.
One tank of goldfish is fed the normal amount of food once a day. A second tank is fed twice a day. A third tank is fed four times a day during a six week study. The fish’s weight is recorded daily.
(What's the Independent Variable?)
Fish fed normally once a day.
Weight of the fish.
Times fed per day/amount of food.
Type of fish tank.
You decide to clean the bathroom. You notice that the shower is covered in a strange green slime. You try to get rid of this slime by adding lemon juice. You spray half of the shower with lemon juice and spray the other half of the shower with water. After 3 days of spraying equal amounts 3 times a day, there is no change in the appearance of the green slime on either side of the shower.
(What's the Dependent Variable?)
Appearance of slime.
The half strayed with water.
Amount of liquid sprayed.
The lemonade juice.
One tank of goldfish is fed the normal amount of food once a day. A second tank is fed twice a day. A third tank is fed four times a day during a six week study. The fish’s weight is recorded daily.
(What's the Dependent Variable?)
Fish fed normally once a day.
Weight of the fish.
Times fed per day/amount of food.
Type of fish tank.
You decide to clean the bathroom. You notice that the shower is covered in a strange green slime. You try to get rid of this slime by adding lemon juice. You spray half of the shower with lemon juice and spray the other half of the shower with water. After 3 days of spraying equal amounts 3 times a day, there is no change in the appearance of the green slime on either side of the shower.
(What's the Control Group?)
Appearance of slime.
The half strayed with water.
Amount of liquid sprayed.
The lemonade juice.
You want to test which size of soccer ball is easiest to juggle with your feet. You test a size 3, size 4, and size 5 ball. You count the seconds the ball stays in the air for each of the trials. You allow yourself to use both of your feet, knees, and head to juggle the ball.
(What's the Dependent Variable?)
There isn't one.
Time ball spends in air.
What you hit it with.
Size of the ball.
You want to test which size of soccer ball is easiest to juggle with your feet. You test a size 3, size 4, and size 5 ball. You count the seconds the ball stays in the air for each of the trials. You allow yourself to use both of your feet, knees, and head to juggle the ball.
(What's the Control Group?)
There isn't one.
Time ball spends in air.
What you hit it with.
Size of the ball.
You decide to clean the bathroom. You notice that the shower is covered in a strange green slime. You try to get rid of this slime by adding lemon juice. You spray half of the shower with lemon juice and spray the other half of the shower with water. After 3 days of spraying equal amounts 3 times a day, there is no change in the appearance of the green slime on either side of the shower.
(What's the Independent Variable?)
Appearance of slime.
The half strayed with water.
Amount of liquid sprayed.
The lemonade juice.
One tank of goldfish is fed the normal amount of food once a day. A second tank is fed twice a day. A third tank is fed four times a day during a six week study. The fish’s weight is recorded daily.
(What's the Control Group?)
Fish fed normally once a day.
Weight of the fish.
Times fed per day/amount of food.
Type of fish tank.
You want to test which size of soccer ball is easiest to juggle with your feet. You test a size 3, size 4, and size 5 ball. You count the seconds the ball stays in the air for each of the trials. You allow yourself to use both of your feet, knees, and head to juggle the ball.
(What's the Independent Variable?)
There isn't one.
Time ball spends in air.
What you hit it with.
Size of the ball.
The things that are kept the same to ensure the results are due to the experiment are called..
Control Group
Constants
Independent Variable
Dependent Variable
The variable that is changed on purpose is..
Control Group
Constants
Independent Variable
Dependent Variable
The variable that is measured/affected by another variable is..
Control Group
Constants
Independent Variable
Dependent Variable
The part of the experiment that is kept the same so we can compare our results to see if there is a change..
Control Group
Constants
Independent Variable
Dependent Variable
Mr. Krabbs wants to make Bikini Bottoms a nicer place to live. He has created a new sauce that he thinks will reduce the production of body gas associated with eating krabby patties from the Krusty Krab. He recruits 100 customers with a history of gas problems. He has 50 of them (Group A) eat krabby patties with the new sauce. The other 50 (Group B) eat krabby patties with sauce that looks just like the new sauce but is really just mixture of mayonnaise and food coloring. Both groups were told that they were getting the sauce that would reduce gas production. Two hours after eating the krabby patties, 30 customers in group A reported having fewer gas problems and 8 customers in group B reported having fewer gas problems.
Which group is the control group?
Group A
Group B
Mr. Krabbs wants to make Bikini Bottoms a nicer place to live. He has created a new sauce that he thinks will reduce the production of body gas associated with eating krabby patties from the Krusty Krab. He recruits 100 customers with a history of gas problems. He has 50 of them (Group A) eat krabby patties with the new sauce. The other 50 (Group B) eat krabby patties with sauce that looks just like the new sauce but is really just mixture of mayonnaise and food coloring. Both groups were told that they were getting the sauce that would reduce gas production. Two hours after eating the krabby patties, 30 customers in group A reported having fewer gas problems and 8 customers in group B reported having fewer gas problems.
What is the independent variable?
The different sauces
Gas problems
Mr. Krabbs wants to make Bikini Bottoms a nicer place to live. He has created a new sauce that he thinks will reduce the production of body gas associated with eating krabby patties from the Krusty Krab. He recruits 100 customers with a history of gas problems. He has 50 of them (Group A) eat krabby patties with the new sauce. The other 50 (Group B) eat krabby patties with sauce that looks just like the new sauce but is really just mixture of mayonnaise and food coloring. Both groups were told that they were getting the sauce that would reduce gas production. Two hours after eating the krabby patties, 30 customers in group A reported having fewer gas problems and 8 customers in group B reported having fewer gas problems.
What is the dependent variable?
The different sauces
Gas problems
Mr. Krabbs wants to make Bikini Bottoms a nicer place to live. He has created a new sauce that he thinks will reduce the production of body gas associated with eating krabby patties from the Krusty Krab. He recruits 100 customers with a history of gas problems. He has 50 of them (Group A) eat krabby patties with the new sauce. The other 50 (Group B) eat krabby patties with sauce that looks just like the new sauce but is really just mixture of mayonnaise and food coloring. Both groups were told that they were getting the sauce that would reduce gas production. Two hours after eating the krabby patties, 30 customers in group A reported having fewer gas problems and 8 customers in group B reported having fewer gas problems.
What should Mr. Krabb's conclusion be?
The new sauce does not appear to work as it reduced the amount of gas produced in 60% of the people tested.
The new sauce appears to work as it reduced the amount of gas produced in 60% of the people tested.
SpongeBob notices that his pal Gary is suffering from slimotosis, which occurs when the shell develops a nasty slime and gives off a horrible odor. His friend Patrick tells him that rubbing seaweed on the shell is the perfect cure, while Sandy says that drinking Dr. Kelp will be a better cure. SpongeBob decides to test this cure by rubbing Gary with seaweed for 1 week and having him drink Dr. Kelp. After a week of treatment, the slime is gone and Gary’s shell smells better.
What was the initial observation?
The slime is gone.
Spongebob has slimeotosis
Sandy told Spongebob to drink Dr. Kelp.
Gary has slimeotosis.
SpongeBob notices that his pal Gary is suffering from slimotosis, which occurs when the shell develops a nasty slime and gives off a horrible odor. His friend Patrick tells him that rubbing seaweed on the shell is the perfect cure, while Sandy says that drinking Dr. Kelp will be a better cure. SpongeBob decides to test this cure by rubbing Gary with seaweed for 1 week and having him drink Dr. Kelp. After a week of treatment, the slime is gone and Gary’s shell smells better.
What is independent variable?
Gary's shell smells better
Treatments
SpongeBob notices that his pal Gary is suffering from slimotosis, which occurs when the shell develops a nasty slime and gives off a horrible odor. His friend Patrick tells him that rubbing seaweed on the shell is the perfect cure, while Sandy says that drinking Dr. Kelp will be a better cure. SpongeBob decides to test this cure by rubbing Gary with seaweed for 1 week and having him drink Dr. Kelp. After a week of treatment, the slime is gone and Gary’s shell smells better.
What is the dependent variable?
The slime on Gary's shell.
Treatments
SpongeBob notices that his pal Gary is suffering from slimotosis, which occurs when the shell develops a nasty slime and gives off a horrible odor. His friend Patrick tells him that rubbing seaweed on the shell is the perfect cure, while Sandy says that drinking Dr. Kelp will be a better cure. SpongeBob decides to test this cure by rubbing Gary with seaweed for 1 week and having him drink Dr. Kelp. After a week of treatment, the slime is gone and Gary’s shell smells better.
What should Spongebob's conclusion be?
The treatments did not work.
The Dr. Kelp worked.
The seaweed worked.
Even though, the slime is gone. It is unknown which treatment cured Gary?

Patrick believes that fish that eat food exposed to
microwaves will become smarter and would be
able to swim through a maze faster. He decides
to perform an experiment by placing fish food in
a microwave for 20 seconds. He has the fish
swim through a maze and records the time it
takes for each one to make it to the end. He feeds
the special food to 10 fish and gives regular food
to 10 others. After 1 week, he has the fish swim
through the maze again and records the times for
each.
Which fish are in the control group?
Fish that receive regular food.
Fish that receive microwaved food.

Patrick believes that fish that eat food exposed to
microwaves will become smarter and would be
able to swim through a maze faster. He decides
to perform an experiment by placing fish food in
a microwave for 20 seconds. He has the fish
swim through a maze and records the time it
takes for each one to make it to the end. He feeds
the special food to 10 fish and gives regular food
to 10 others. After 1 week, he has the fish swim
through the maze again and records the times for
each.
What is the independent variable?
The times the fish took to complete the maze.
Fish food.

Patrick believes that fish that eat food exposed to
microwaves will become smarter and would be
able to swim through a maze faster. He decides
to perform an experiment by placing fish food in
a microwave for 20 seconds. He has the fish
swim through a maze and records the time it
takes for each one to make it to the end. He feeds
the special food to 10 fish and gives regular food
to 10 others. After 1 week, he has the fish swim
through the maze again and records the times for
each.
Look at the chart. What should Patrick's conclusion be?
Microwaved food makes fish smarter.
Microwaved food does not make fish smarter.
Some fish did improve their times, but there is not enough data to support Patrick's hypothesis. More testing needs to be done.
Jorge wants to know whether music affects plant growth. He puts two identical plants in separate rooms. One room is sunny and has a stereo playing rock music all day. The other room is quiet and dark. He gives both plants the same amount of water. After two weeks he compares the plants. The plant in the room with music is green and growing. Leaves on the plant in the other room are turning yellow. He concludes that music helps plants grow. What makes his scientific explanation weak?
He did not have a testable hypothesis.
He did not use two different plants in each room.
He did not add fertilizer to the plants in either room.
He had more than one variable in his experimental conditions.
Dante loves taking care of the chickens on his farm. He feeds them rice every day. His Grandma told him that he should feed them corn everyday instead of rice because it will make them grow fatter. He decides to do an experiment to test what type of food will make his chickens fatter. Before the experiment, the chickens weigh an average of 5 pounds. David makes two groups of chickens. He feeds Group A rice every day, and feeds Group B corn every day. After one month, David weighs the chickens to see if they gained any weight. Group A weighs an average of 5 pounds and group B weighs an average of 7 pounds.
What is the test variable (independent variable) in this experiment?
The weight of the chickens at the end of the experiment
The type of food given to the chickens
The weight of the chicken is based on the kind of food they're given
The amount of water given to the chickens
Dante loves taking care of the chickens on his farm. He feeds them rice every day. His Grandma told him that he should feed them corn everyday instead of rice because it will make them grow fatter. He decides to do an experiment to test what type of food will make his chickens fatter. Before the experiment, the chickens weigh an average of 5 pounds. David makes two groups of chickens. He feeds Group A rice every day, and feeds Group B corn every day. After one month, David weighs the chickens to see if they gained any weight. Group A weighs an average of 5 pounds and group B weighs an average of 7 pounds.
What is the outcome variable (dependent variable) in this experiment?
The weight of the chickens at the end of the experiment
The type of food given to the chickens
the weight of the chicken is based on the kind of food they're given
The amount of water given to the chickens
Catherine is testing which soil will help grass grow the tallest. The height of the grown grass is the __ variable.
constant variable
independent variable
dependent variable
control group
You are managing a large feed lot. A pharmaceutical company wants you to try a new antibiotic to treat shipping fever in newly arrived cattle. The company claims that it is more effective at a lower cost than your current antibiotic you are using. You will measure the temperature of the cattle to see whether or not it works. WHAT IS THE INDEPENDENT VARIABLE (IV)?
Type of cow
Antibiotic
No Antibiotic
Temperature of Cattle
You are managing a large feed lot. A pharmaceutical company wants you to try a new antibiotic to treat shipping fever in newly arrived cattle. The company claims that it is more effective at a lower cost than your current antibiotic you are using. You will measure the temperature of the cattle to see whether or not it works. WHAT IS THE DEPENDENT VARIABLE (DV)?
Type of cow
Antibiotic
No Antibiotic
Temperature of Cattle
You are managing a large feed lot. A pharmaceutical company wants you to try a new antibiotic to treat shipping fever in newly arrived cattle. The company claims that it is more effective at a lower cost than your current antibiotic you are using. You will measure the temperature of the cattle to see whether or not it works. WHAT IS THE CONTROLGROUP?
Type of cow
Antibiotic
No Antibiotic
Temperature of Cattle
A custodian notices some dirty tables and wants to know which cleaner is the best to use. He tests three different cleaners and looks at how well they clean compared to tap water. What is the independent variable?
type of cleaner
tap water
A custodian notices some dirty tables and wants to know which cleaner is the best to use. He tests three different cleaners and looks at how well they clean compared to tap water. What is the control group?
type of cleaner
tap water
An experiment is being done to determine how light affects the growth of small zinnia plants. One plant is placed in full sunlight, the second in a shaded area, the third in an unlit closet. What is the control group in this experiment?
the amount of light
the plant in the closet
Tiffany was investigating how fast it took Hayden to react to different sounds. Identify the dependent variable.
Mario studied how far water at room temperature would spurt out of a plastic milk carton when 3mm holes were punched at different heights from the bottom of the container. Identify the dependent variable
This variable is the data that is collected during the experiment. It is what is measured. If the independent variable is the cause, this is the effect.
independent variable
dependent variable
control group
data group
Quantitative data includes:
a written description
a color
a number
a smell
Qualitative data includes:
an amount
measurement
a number
a written description like a color
What kind of data is shown in this example?
The girl is 72 inches tall.
Qualitative Data
Quantitative Data
What kind of data is shown in this example?
The flowers have a strong scent and are red.
Qualitative Data
Quantitative Data
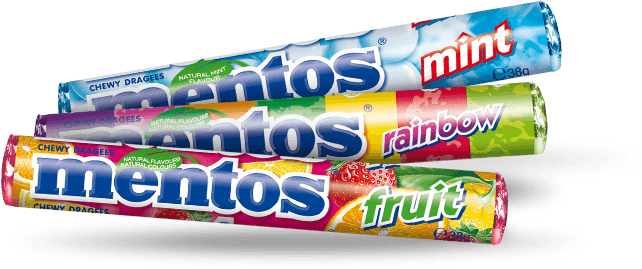
A test is set up to test which brand of soda creates the biggest foam explosion when adding a Mentos candy. Three different sodas were tested. They measured the height of the foam eruption. What is the DEPENDENT variable?
Brand of soda
Number of mentos candies used
Height of foam eruption
Temperature of soda

An experiment is conducted to test how different cleats change an athletes running speed. Six different types of cleats are tested and the 100m run time is recorded. What is the INDEPENDENT variable?
The type of cleat
The run time
The 100 meters
The athlete
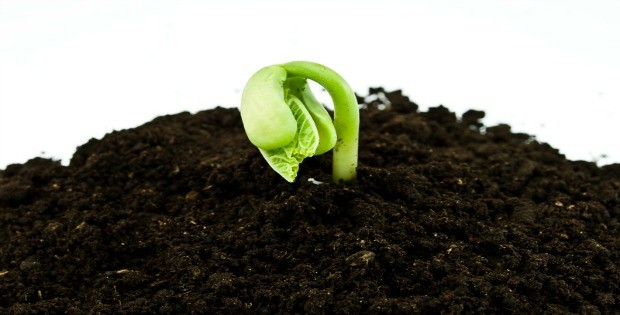
Stephen predicted that seeds would start to grow faster if an electric current traveled through the soil in which they were planted is a(n) example of what step.
Define the Problem
Conduct an Experiment
Form a Hypothesis
Draw a Conclusion

An experiment is conducted to test how different cleats change an athletes running speed. Six different types of cleats are tested and the 100m run time is recorded. Which of the following are CONSTANTS in this experiment?
The type of cleat
The run time
The 100 meters
The athlete
Experiment: Sendel wants to see if taking the backroads to work is faster than taking the highway during rush hour.
In Sendel's driving experiment, what is the control group?
Highway
Backroads
Time she drives to work
Rush hour
Experiment: Sendel wants to see if taking the backroads to work is faster than taking the highway during rush hour.
In Sendel's driving experiment, what is the experimental group?
Highway
Backroads
Time she drives to work
Rush hour

A scientist thinks that flatworms swim faster if they are in salt water. So he drops them in salt water and finds that they do swim very fast. He concludes that salt water makes flatworms swim fast.

The graph shown displays the moose population of New Hampshire. Which of the observations below is supported by the graph?
The moose population grew from 2002-2005.
The moose population was highest in 2005.
The moose population will be extinct by 2025.
The moose population has only declined since 1994.

The bar graph shows energy production over time. Which of the following conclusions is supported by the data shown?
Biofuels are not a valuable energy resource.
Coal is the most efficient form of energy production.
Oil production has a negative impact on the environment.
Nuclear energy production has shown the greatest decline over time.
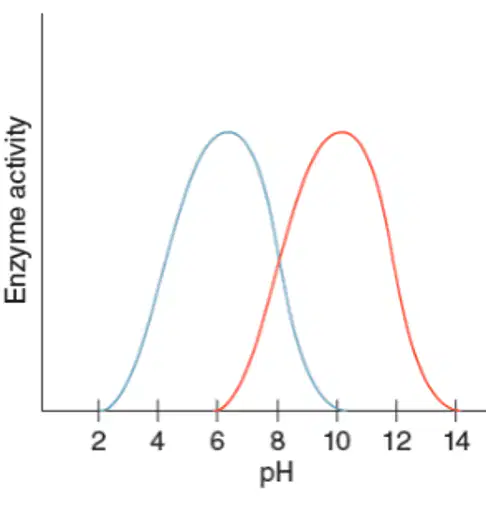
Using only the information provided in the graph, which of the following is a claim that could be made?
Enzyme A will be most active at a pH of 3.
Enzyme B will be most active at a pH of 3.
Enzymes A and B are both inactive at a pH of 8.
Enzymes A and B are impacted by changes in pH.

The disease polio once sickened thousands of children every year. The graph depicts the number of polio cases that occurred between 1952 and 1973, based on information from the U.S. Department of Health, Education, and Welfare and the Centers for Disease Control. The data best support which of these statements?
Introducing a vaccine for polio had no effect on the number of cases of polio diagnosed each year.
The polio vaccine was effective in protecting thousands of people from this disease.
The vaccine proved ineffective because cases of polio rose between 1957 and 1959.
The sources of the data are not reliable and, therefore, the data should be ignored.

Indira tested whether a tomato plant grew faster in part shade or full sun. The table below shows the height of each plant after 0, 10, 20, and 30 days. What is one conclusion Indira can draw from her data?
All plants grow taller in full sun than they do in part shade.
Tomato plants need to be placed in full sun in order to grow.
Tomato plants grown in full sun will produce more tomatoes.
The tomato plants grew taller in full sun than they did in part shade.
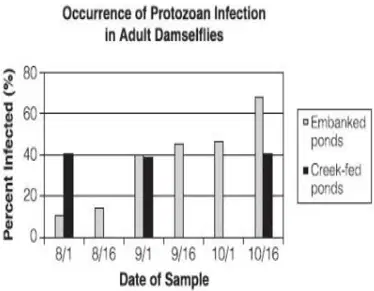
A research group has discovered that damselflies, a type of dragonfly, are being infected by a particular type of aquatic protozoan. Both young and adult damselflies are not directly infected by the protozoan but contract the infection from the prey they eat. The graph shows the percentage of adult damselflies infected by protozoans during the summer and early fall. Which of the following conclusions is supported by the graph?
Infection in embanked ponds increased during the sampling period.
Protozoans were more common in creek-fed ponds than embanked ponds.
Protozoans reproduce more quickly in embanked ponds than creek-fed ponds.
Infection in creek-fed ponds remained constant throughout the sampling period.

Explain why this data is misleading.
The entire week is not shown, so we cannot tell what the person did after Wednesday.
Some people do not wear those shoes for walking.
The walking/running shoes are different sizes.
Wednesday has two rows of shoes.


Which graph correctly shows the information in the data table?
a
b
c


Which table is BEST at showing the data?
a
b
c
d

What does the x-axis measure?
Time (minutes)
Distance in City Blocks
Length of Stride
Speed of Walking
What does the y-axis measure?
Time (minutes)
Distance in City Blocks
Length of Stride
Speed of Walking
At what two points are the girl and the dog standing still?
4 to 20 minutes
6 to 18 minutes
0 to 6 minutes
3 minutes

On a scatter plot, the X axis is the _________ variable.
independent
dependent
controlled
changing
On a scatter plot, the Y axis is the _________ variable.
dependent
independent
controlled
changing

Which of the following is a claim that can be supported by evidence on the graph?
the bee population is decreasing over time
2014 had the lowest bee population
1970 had more bees than 1990
all of these

Which of the following is correct?
Independent variable= time (years)
Dependent variable= amount of bees
Independent variable= amount of bees
Dependent variable= time (years)
Independent variable= amount of time
Dependent variable= bees (years)
none of these

Which of the following claims can be supported by the graph?
roots appear healthier in soil with low amounts of salt
roots appear healthier in soil with high amounts of salt
roots appear healthier in soil with medium amounts of salt
salt concentration in soil has no effect on plant growth

What is the independent variable in the experiment?
amount of salt
plant growth
amount of sunlight
amount of water

What is the dependent variable on the graph?
storage containers
days until bread molded
amount of mold
amount of storage bags

What is the independent variable in the experiment?
amount of water
plant growth
amount of sunlight
plant number

What is the independent variable?
types of school supplies
number of supplies
schools in the area
number of students
What is the dependent variable?
types of school supplies
number of supplies
schools in the area
number of students


They used their results to make the graph below.
Which month had an average daily temperature of around 41 degrees?
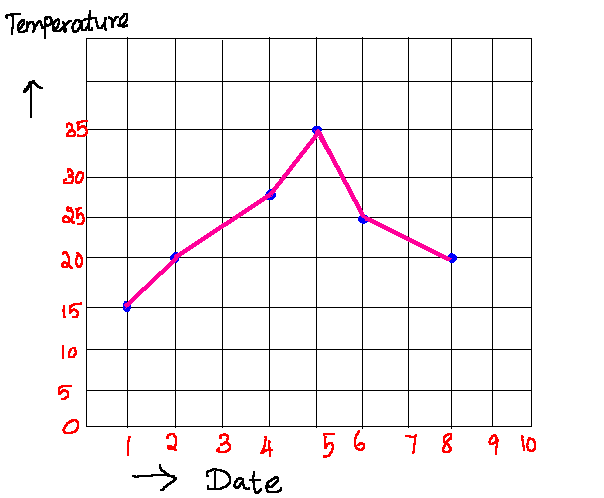


From the graph, how many months show an average precipitation of less than 4 inches?
6
8
9
7

This line graph shows the height of two plants that were grown for four weeks. During which week were the plants the same height?
1
2
3
4

Which data below matches the data presented in the graph?
Jan 4 cm
Mar 5 cm
May 14 cm
Jan 4 cm
Mar 5 cm
May 13 cm
Jan 5 cm
Mar 6 cm
May 14 cm
Jan 4 cm
Mar 5 cm
May 5 cm

Examine the line graph below. If the population of Centerville continues to increase at the same rate, what will the population be in the year 2010?
16,000 people
6500 people
9500 people
8000 people

Joseph counted all of the different trees in the woods near his house. He made a graph showing his results. Which of the following conclusions can Joseph draw from his graph?
There are more elms than oaks in the woods near his house.
Cedars are the tallest trees in the woods near his house.
There are 95 trees in the woods near his house.
Maple trees are not able to grow in the woods near his house.

Examine the graph. What variable is the independent variable?
month
rainfall in centimeters
both

Examine the graph. Which variable is the dependent variable?
population (in thousands)
year

According to the bar graph which breed of dog is there more of in this kennel?
beagle
collie
poodle
bulldog

Algae multiply most rapidly at 35oC.
Algae multiply most slowly at 20oC.
Algae multiply most rapidly at 20oC.
Algae multiply most slowly at 10oC.

The bacteria will be completely killed off if the antibiotics dosage is increased.
The patient should have not taken the antibiotics again after day 5.
The patient has become immune to the bacteria by day 10.
The bacteria developed resistance to the antibiotics.


Based on the data of the scatter plot, what would you expect the sales to be when it is 20 degrees?
400
500
450
350

A new smartphone game deducts points from your account when you purchase tokens within the game. If you purchase a large number of tokens at one time, the game deducts fewer points from your account overall. The scatter plot below displays data for eight users' accounts. The relationship between the number of tokens purchased is displayed on the x-axis and the number of points deducted is displayed on the y-axis.
Which of the following statements correctly describe the scatter plot shown? Select ALL that apply.
There are no outliers.
The scatter plot shows a linear association.
The scatter plot shows a positive association.
The scatter plot shows no association.
The scatter plot show a negative association.

A scatter plot for calories burned and minutes of exercise is drawn. Observe the graph carefully and identify the outliers present.
(140,150)
(150,140)
(180,450)
None of these

The scatter plot shows the sizes and annual rents of some office spaces in the downtown area of a city.
What would the line of best fit reveal about these data?
There is a strong negative relationship between the cost of rent and the size of the office space.
There is a strong positive relationship between the cost of rent and the size of the office space.
There is a weak positive relationship between the cost of rent and the size of the office space.
There is a weak negative relationship between the cost of rent and the size of the office space.

In the scatter plot for calories burned and minutes of exercise (the same one from question six), what is the context of the outliers present?
The person who exercised for 140 minutes burned 150 calories.
The person who exercised for 150 minutes burned 140 calories.
The person who exercised for 180 minutes burned 450 calories.
Not applicable - there is no outlier.

Which of these most closely approximates a line of best fit for the data in the scatter plot?


What is not a reasonable conclusion to be drawn from this graph?
There are about twice as many Sprint customers as there are T-Mobile
Verizon has increased their total number of customers since last year
AT&T has better service coverage than the other cell phone providers
T-Mobile is the least common provider for those who were surveyed
The bar graph shows energy production over time. Which of the following conclusions is supported by the data shown?
Biofuels are not a valuable energy resource.
Coal is the most efficient form of energy production.
Oil production has a negative impact on the environment.
Nuclear energy production has shown the greatest decline over time.
If you run long distances, you will begin to sweat and your heart beats faster to pump more oxygen to your lungs. This is an example of...
all living things containing DNA.
all living things maintaining homeostasis.
all living things evolving.
all living things reproducing.
Identify the characteristic: when you step out into the cold, your body shivers in order to keep its temperature at 98.6oF.
All living things use energy
All living things contain cells
All living things maintain homeostasis
All living things grow and develop
Identify the characteristic: green plants produce their own food through the process of photosynthesis.
All living things use energy
All living things contain cells
All living things maintain homeostasis
All living things grow and develop
Identify the characteristic: a caterpillar hibernates in a cocoon and emerges as a butterfly.
All living things adapt to their environment
All living things use energy
All living things respond to their environment
All living things grow and develop
Which of the following is an example of homeostasis?
adapting to your environment
maintaining an appropriate respiration rate
the sum of all of your chemical reactions
being composed of more than one cell
Which of the following is NOT an example of an adaptation?
birds migrating during the winter months
the total sum of all the chemical reactions in your body
humans evolving the ability to digest lactose (sugar in milk)
the ability of dolphins to communicate in aquatic environments
Which of the following are examples of Homeostasis?
Body Temperature
Blood Sugar
Blood Pressure
All of the above are examples of Homeostasis
Homeostasis is your way of....
Keeping internal balance
Keeping external balance
storing energy
sleeping

