
 Worksheets
AP Statistics Quarter 1 Review
Total questions: 119
Worksheet time: 10hrs 14mins
A zoologist studying adult bears measures a number of different variables. Which of the following possible variables is categorical?
the weight in pounds of an adult bear
the level of aggression (low, moderate, high) displayed by an adult bear
The number of fish an adult bear eats in a particular day.
A zoologist studying adult bears measures a number of different variables. One variable is the body temperature of the bear during hibernation. Which of the following is the best description of the distribution of this variable.
All the values that the zoologist records for body temperature and how many individual bears have each value.
The difference between the highest temperature recorded for a bear’s body temperature and the lowest.
The geographical area in which the adult bears can be found.

A review of voter registration records in a small town yielded this table of the number of males and females registered as Democrat, Republican, or some other party affiliation. Which of the following bar graphs represents the distribution of party affiliation among all voters in this town?


Above is a graphical presentation of information from the World Bank about the percentage of land in four East African countries that is forest. What’s wrong with this method of presenting information?
The vertical scale underrepresents differences between countries.
“Percentage of land area” does not take into account differences on total area among these countries.
Using proportionally-sized trees exaggerates differences between countries.

Above is a dot plot of voter turnout (as a percentage of voting-age population) for the 50 states—plus the District of Columbia—in a recent presidential election. Which of the following best describes this distribution?
Skewed slightly left, centered at about 62%, with a range of 24 percentage points.
Roughly symmetric, centered at about 60%, with a range of 30 percentage points.
Skewed slightly right, centered at about 62%, with a range of 24 percentage points.

The stem-and-leaf diagram gives the distribution of the ages in years of 20 participants at a family reunion. Which of the following statements about the distribution is correct?
The mean is larger than the median.
The distribution is strongly skewed to the left.
It makes the most sense to use the mean and standard deviation as a numerical summary of the center and spread of this distribution.

Independently selected groups of middle-school children were given a poem to memorize. After a certain period of time, they were asked to recall as much of the poem as they could. A back-to-back stem plot of the distribution of the number of words that each group of children could correctly remember is displayed. Which of the following statements about these data is true?
There are more students in Group 1 than in Group 2.
In general, children in Group 2 were able to recall more words than children in Group 1.
The third quartile of the Group 1 distribution is larger than the maximum value of the Group 2 distribution (that is, 25% of the Group 1 values are larger than any Group 2 value).

The box plots show the distribution of test scores in Ms. Williams’s two sections of calculus. Based on these box plots, which one of the following statements must be true?
The first quartile for the two sections is the same.
The lowest score in A period was close to the 15th percentile of the C period class.
The mean score for students in C period was higher than the mean score for students in A period.

Given is a dot plot of voter turnout (as a percentage of voting-age population) for the 50 states—plus the District of Columbia—in a recent presidential election. Approximately what percentage had a turnout above 65%?
27.5%
17.6%
10%
The owner of a convenience store keeps track of how many customer buy lunch food during the “noon rush” each day for four days and calculates that the mean number of customers for those four days is 52. How many customers must come in on the fifth day to make the five-day mean 54?
54
60
62

Which of the distributions displayed in the dot plots has the highest standard deviation?
Distribution A
Distribution B
Distribution C
According to the 1.5 x IQR rule, how many outliers are there in the data set 72, 110, 114, 115, 118, 123, 144, 156?
None
One
Two

The histogram shows the typical travel time to school (self-reported) for 50 high school students. Which of the following statements is true about the mean and median of this distribution?
Mean > Median
Mean < Median
Mean = Median
Jerome’s summer reading list has 8 books, and he is examining the number of pages in each book. After calculating the mean, median, standard deviation, and interquartile range, he realized that the longest book is actually 100 pages longer than he thought it was. Which of his measurements does he need to recalculate?
The mean, standard deviation, and interquartile range.
The mean and standard deviation.
Only the mean.
You record the weight, age, and eye color of a sample of 1560 men at a company. The number and type of variables you have recorded is
3 quantitative, 0 categorical
3 quantitative, 1 categorical
2 quantitative, 1 categorical
1 quantitative, 2 categorical

The principal at an elementary school wanted to do research on which type of pet would be best for the first grade class. She took a sample of 54 first graders and asked which pet they had in their home. The results are displayed in the graph. Which of the following are true about the graph?
Most of the students wanted a dog as a class pet.
None of the students had reptiles at home.
In this sample, more students had dogs and cats than any other type of animal as a pet.
The students want a cat as their class pet.

Which of the following bar charts matches the data represented in the pie chart above?


None of the bar charts match the pie chart.

Temperatures are being measured regularly to fight the spread of COVID 19. A temperature above 100.1F is considered a fever and will be denoted with H. A list of 9 temperatures is shown.
H 99.1 H 98.1 H 98.9 97.9 96.5 97.1
The median temperature of the sample is
Cannot be determined
H
98.1
98.9

Researchers record the weights in pounds of 40 cheetahs in the wild. The histogram shows the data that were collected.
The percentage of cheetahs that weigh more than 200 lbs is closest to
10%
6%
3%
0.75%

Researchers record the weights in pounds of 40 cheetahs in the wild. The histogram shows the data that were collected.
Which of the following statements about the distribution is NOT correct?
The histogram is right-skewed
The median is greater than 120 lbs
The histogram is unimodal
The mean and median are the same.

The first quartile of the score distribution is equal to
3
20
23
43
The mean age of female teachers is 36, the mean age of male teachers is 33. What must be true about the mean age of all teachers?
It must be 34.5
It must be larger than the median age
It could be any age between 33 and 36
It must be larger than 36

What percent of all large companies receiving surveys responded?
12.5%
20%
33%
62.4%

Which of the following conclusions is not supported by the data? (select all that apply)
There are more large companies than small companies in the survey.
Large companies appeared to have a higher response rate than medium or small companies.
Small companies were most likely to respond.
Overall, less than half of companies responded to the survey.
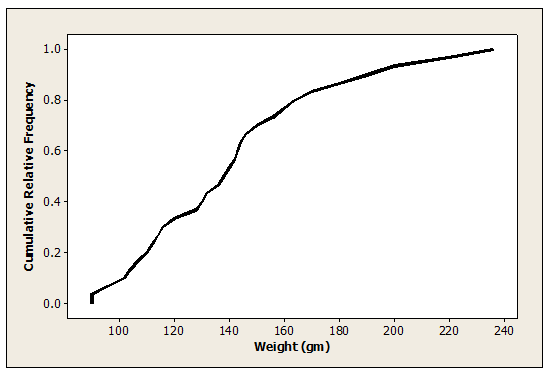
The cumulative relative frequency graph describes the distribution of weights (in grams) of tomatoes grown in a laboratory experiment. Which of the following weights is closest to the median of the distribution?
120 grams
140 grams
170 grams
200 grams
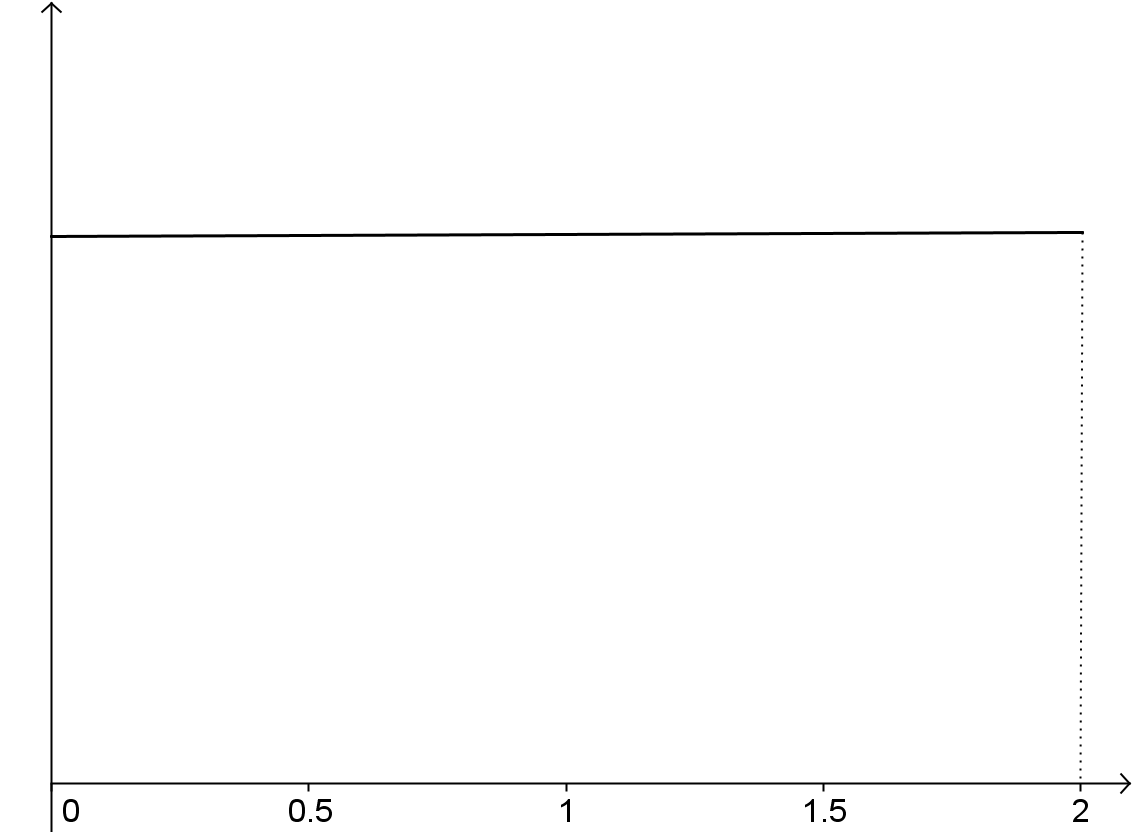
For the density curve shown, which of the following statements is true?
The mean is larger than the median.
The proportion of outcomes between 0.2 and 0.5 is equal to 0.3.
The proportion of outcomes greater than 1.5 is equal to 0.25.
An office uses two brands of fluorescent light bulbs in its overhead light fixtures. From past experience, it is known that Brand A bulbs have a mean life length of 3000 hours and a standard deviation of 200 hours, while Brand B bulbs have a mean life length of 2700 hours and a standard deviation of 250 hours. Which bulb has a longer life relative to all bulbs of its brand, a Brand A bulb that lasts 3150 hours or a Brand B bulb that lasts 2850 hours?
The Brand A bulb has a longer life relative to its brand.
The Brand B bulb has a longer life relative to its brand.
The two bulbs have equally long lives.
Javier’s school bus is always late. Below are data on how many minutes late the bus was for 15 days in February. What is the 60th percentile of this distribution? *
1 2 2 2 3 3 4 4 4 5 6 7 8 10 12
3
4
5
6
The weights of cockroaches living in a university dormitory follow a Normal distribution with mean 80 grams and standard deviation 5 grams. The percentage of cockroaches having weights between 72 grams and 88 grams must be
less than 68%.
between 68% and 95%
between 95% and 99.7%
Scores on the American College Testing (ACT) college entrance exam follow a Normal distribution with mean 18 and standard deviation 6. Lisa’s standardized score on the ACT was z = -0.7. What was her actual ACT score?
4.2
13.8
22.2
What is the 25th percentile of the standard Normal distribution?
1.0000
.5987
-.6700
The lifetime of a 2-volt battery in constant use has a Normal distribution with a mean of 516 hours and a standard deviation of 20 hours. The proportion of batteries with lifetimes that exceed 520 hours is approximately
.2000
0.5793
0.4207
The lifetime of a 9-volt battery in constant use has an approximately Normal distribution with a mean of 516 hours and a standard deviation of 20 hours. Which of the following is the approximate lifetime of a battery that lasts longer than 90% of all batteries?
541.6 hours
517.28 hours
490.4 hours
The lifetime of 9-volt battery in constant use has an approximately Normal distribution with a mean of 516 hours and a standard deviation of 20 hours. Which of the following best describes the distribution of standard scores for the lifetimes of such batteries?
Exactly Normal, with mean 0 and standard deviation 1
Approximately Normal, with mean 0 and standard deviation 1
Approximately Normal, with mean 1 and standard deviation 1.
Fuji apples grown at a certain orchard have a mean weight of 5.2 ounces with a standard deviation of 0.8 ounces. Suppose the scale the orchard owner uses systematically underweighs apples by 0.2 ounces and also weighs the apples in grams, rather than ounces. What would the mean and standard deviation of these apples’ weights be as determined by this scale? (Note: 1 ounce ≈ 28 grams).
Mean 145.6 grams, standard deviation 22.4 grams.
Mean 140 grams, standard deviation 22.4 grams.
Mean 140 grams, standard deviation 16.8 grams.
Then, 68% of all tires will have a life between ___________ km and __________ km.
Which interval shows 99.7% of the data given a mean of 15 and a standard deviation of 3?
9 to 21
12 to 18
6 to 24
13 to 16

What percent of people within 3 standard deviations of the mean?
99.7
34
68
95
What percent of people within 2 standard deviations of the mean?
99.7
34
68
95
What percent of people within 1 standard deviation of the mean?
99.7
34
68
95

A
B
C
D
E

A
B
C
D
E

A
B
C
D
E

A
B
C
D
E

A
B
C
D
E

A
B
C
D
E

A
B
C
D
E

A
B
C
D
E

A
B
C
D
E

A
B
C
D
E
A school guidance counselor examines how many extracurricular activities students participate in and their grade point average. The guidance counselor says, “The evidence indicates that the correlation between the number of extracurricular activities a student participates in and his or her grade point average is close to 0.” Which of the following is the most appropriate conclusion?
Students with good grades tend to be students who are not involved in many extracurricular activities.
Students involved in many extracurricular activities are just as likely to get good grades as bad grades.
No conclusion should be made based on the correlation without looking at a scatterplot of the data.
Students with good grades tend to be students who are involved in many extracurricular activities.
Students involved in many extracurricular activities tend to be students with poor grades.
An AP®® Statistics student designs an experiment to see whether today’s high school students are becoming too calculator-dependent. She prepares two quizzes, both of which contain 40 questions that are best done using paper-and-pencil methods. A random sample of 30 students participates in the experiment. Each student takes both quizzes—one with a calculator and one without—in a random order. To analyze the data, the student constructs a scatterplot that displays a linear association between the number of correct answers with and without a calculator for the 30 students. A least-squares regression yields the equation𝐶𝑎𝑙𝑐𝑢𝑙𝑎𝑡𝑜𝑟ˆ=−1.2+0.865(𝑃𝑒𝑛𝑐𝑖𝑙)Calculator^=−1.2+0.865(Pencil) 𝑟=0.79.
1: If the student had used Calculator as the explanatory variable, the correlation would remain the same.
2: If the student had used Calculator as the explanatory variable, the slope of the least-squares line would remain the same.
3: The standard deviation of the number of correct answers on the paper-and-pencil quizzes was smaller than the standard deviation on the calculator quizzes.
1 and 3 only
1,2, and 3

Scientists examined the activity level of 7 fish at different temperatures. Fish activity was rated on a scale of 0 (no activity) to 100 (maximal activity). The temperature was measured in degrees Celsius. A computer regression printout and a residual plot are provided. Notice that the horizontal axis on the residual plot is labeled “Fitted value,” which means the same thing as “predicted value.” What is the correlation between temperature and fish activity?
–0.95
0.91
0.45
0.95
–0.91
Scientists examined the activity level of 7 fish at different temperatures. Fish activity was rated on a scale of 0 (no activity) to 100 (maximal activity). The temperature was measured in degrees Celsius. A computer regression printout and a residual plot are provided. Notice that the horizontal axis on the residual plot is labeled “Fitted value,” which means the same thing as “predicted value.” What was the actual activity level rating for the fish at a temperature of 20°C?
66
81
87
84
3
Scientists examined the activity level of 7 fish at different temperatures. Fish activity was rated on a scale of 0 (no activity) to 100 (maximal activity). The temperature was measured in degrees Celsius. A computer regression printout and a residual plot are provided. Notice that the horizontal axis on the residual plot is labeled “Fitted value,” which means the same thing as “predicted value.”Which of the following gives a correct interpretation of 𝑠s in this setting?
The typical distance of the temperature readings from their mean is about 4.785°C.
The typical distance of the activity level readings from their mean is about 4.785 units.
At a temperature of 0°C, this model predicts an activity level of 4.785 units.
For every 1°C increase in temperature, fish activity is predicted to increase by 4.785 units.
The typical distance of the activity level ratings from the least-squares line is about 4.785 units.
Which of the following statements is not true of the correlation 𝑟 between the lengths (in inches) and weights (in pounds) of a sample of brook trout?
𝑟 is measured in inches
𝑟 would not change if we measured the weights of the trout in kilograms instead of pounds.
𝑟 would not change if we measured the lengths of the trout in centimeters instead of inches.
𝑟 must be a value between -1 and 1.
If longer trout tend to also be heavier, then
𝑟 > 0.
When we standardize the values of a variable, the distribution of standardized values has mean 0 and standard deviation 1. Suppose we measure two variables 𝑋 and 𝑌 on each of several subjects. We standardize both variables and then compute the least-squares regression line. Suppose the slope of the least-squares regression line is –0.44.
the correlation will also be –0.44.
the intercept will be 1.0.
The correlation will be 1/–0.44.
the intercept will also be –0.44.
the correlation will be 1.0.
There is a linear relationship between the number of chirps made by the striped ground cricket and the air temperature. A least-squares fit of some data collected by a biologist gives the model 𝑦̂ =25.2+3.3𝑥, where 𝑥 is the number of chirps per minute and 𝑦̂ is the estimated temperature in degrees Fahrenheit. What is the predicted increase in temperature for an increase of 5 chirps per minute?
3.3°F
25.2°F
41.7°F
28.5°F
16.5°F

The scatterplot shows the relationship between the number of people per television set and the number of people per physician for 40 countries, along with the least-squares regression line. In Ethiopia, there were 503 people per TV and 36,660 people per doctor. Which of the following is correct?
Ethiopia has more people per doctor than expected, based on how many people it has per TV.
Increasing the number of TVs in a country will attract more doctors.
The correlation is greater than 1.
The slope of the least-squares regression line is less than 1.
The point for Ethiopia is decreasing the slope of the least-squares regression line.

The first scatterplot shows the lean body mass and metabolic rate for a sample of 5 adults. For each person, the lean body mass is the subject’s total weight in kilograms less any weight due to fat. The metabolic rate is the number of calories burned in a 24-hour period. Because a person with no lean body mass should burn no calories, it makes sense to model the relationship with a direct variation function in the form 𝑦=𝑘𝑥. Models were tried using different values of 𝑘(𝑘=25,𝑘=26), and the sum of squared residuals (SSR) was calculated for each value of 𝑘. Given is a second scatterplot, this one showing the relationship between SSR and 𝑘: According to the scatterplot, what is the ideal value of 𝑘 to use for predicting metabolic rate?
24
26
25
31
36
We record data on the population of a particular country from 1960 to 2010. A scatterplot reveals a clear curved relationship between population and year. However, a different scatterplot reveals a strong linear relationship between the logarithm (base 10) of the population and the year. The least-squares regression line for the transformed data is log(population)ˆ=−13.5+0.01(year).
Based on this equation, which of the following is the best estimate for the population of the country in the year 2020?
6,700,000
5,000,000
8,120,000
6.7
812


Which of the following statements is true?
I. The variables x and y also have a correlation close to 1.
II. A scatterplot of (x, y) shows a strong nonlinear pattern.
III. The residual plot of the variables x and y shows a random pattern.

I. Random scatter in the residuals indicates a linear model.
II. If two variables are very strongly associated, then the correlation between them will be near 1 or -1.
III. Changing the units of measurement for x or y changes the correlation coefficient.


Which is the best description of the slope for this regression equation in context of the problem?

A
B
C
D
E

A
B
C
D
E

A
B
C
D
E

A
B
C
D
E

A
B
C
D
E

A
B
C
D
E

A
B
C
D
E

A
B
C
D
E
a controlled study in which the researcher attempts to understand cause-and-effect relationships by assigning subjects to groups and deciding which treatments each group receives
survey
observational study
experiment
A large company wants to conduct a survey to determine the proportion of its male employees who practice yoga on a daily basis. Two of its regional offices are chosen at random and all of the male employees at each office are surveyed. The plan is an example of which type of sampling?
Cluster
Convenience
Simple random
Stratified random
Systematic
Which of the following is a key distinction between well designed experiments and observational studies?
More subjects are available for experiments than for observational studies.
Ethical constraints prevent large-scale observational studies.
Experiments are less costly to conduct than observational studies.
An experiment can show a direct cause-and-effect relationship, whereas an observational study cannot.
Tests of significance cannot be used on data collected from an observational study.
A local TV station is interested in how citizens in a small town feel about the increased sales tax proposed by the city council. The question "Are you in favor of the proposed sales tax increase that will be used to improve the sidewalks and streets in downtown?" was shown on the screen during the evening news broadcast and viewers were instructed to text their answer to the number given on the screen. This survey method could produce biased results for all of the following reasons except:
The wording of the question is biased.
A person could answer the survey multiple times.
It uses a stratified sample rather than a simple random sample.
the survey excludes voters who do not watch the evening news cast.
People who feel strongly about the issue are more likely to respond.
In a certain school, students can choose whether to eat in the school’s cafeteria. A reporter working for the school’s newspaper polled students on their reactions to changes in the menu at the cafeteria. For each student leaving the cafeteria in one 20-minute time period, the reporter used a die to determine whether to stop the student and ask how he or she felt about the new menu. In the reporter’s article it was stated that a random sample of the students showed that 23% of the school’s student population was happy with the new menu. Which of the following statements is true?
Because each student leaving the cafeteria was randomly selected and could choose to answer or not, this is a random sample of the student population, and the 23% is an accurate measurement of the school population’s view of the new menu.
Because students self-selected whether to eat in the cafeteria, the sampling method might be biased and the sample might not be representative of all students in the school.
The survey would have been more effective if the reporter had collected the data in one 10-minute time period rather than in one 20-minute time period.
The survey would have been more effective if students who cared about the food could have called the reporter to tell how they felt about the new menu, so that only students with opinions on the subject would have been surveyed.
Because no treatment was imposed on the students eating in the cafeteria, one cannot make any conclusions about the new menu.
In a certain school, students can choose whether to eat in the school’s cafeteria. A reporter working for the school’s newspaper polled students on their reactions to changes in the menu at the cafeteria. For each student leaving the cafeteria in one 20-minute time period, the reporter used a die to determine whether to stop the student and ask how he or she felt about the new menu. In the reporter’s article it was stated that a random sample of the students showed that 23% of the school’s student population was happy with the new menu. Which of the following statements is true?
Because each student leaving the cafeteria was randomly selected and could choose to answer or not, this is a random sample of the student population, and the 23% is an accurate measurement of the school population’s view of the new menu.
Because students self-selected whether to eat in the cafeteria, the sampling method might be biased and the sample might not be representative of all students in the school.
The survey would have been more effective if the reporter had collected the data in one 10-minute time period rather than in one 20-minute time period.
The survey would have been more effective if students who cared about the food could have called the reporter to tell how they felt about the new menu, so that only students with opinions on the subject would have been surveyed.
Because no treatment was imposed on the students eating in the cafeteria, one cannot make any conclusions about the new menu.
To check the effect of hot temperatures on the elasticity of two brands of rubber bands, one box of Brand A and one box of Brand B rubber bands are tested. Ten bands from the Brand A box are placed in a warm car in the sun for two hours and ten bands from the Brand B box are kept at room temperature. The amount of stretch before the breakage is measured on each rubber band, and the mean for the hot bands is compared to the mean for the others. Is this a good experimental design?
No, because the means are not proper statistics for comparison.
No, because more than two brands should be used.
No, because more temperatures should be used.
No, because temperature is confounded with brand.
Yes

a
b
c
d
e

by blocking on car type
by blocking on oil type
by blocking on engine life
by blocking on engine size
without blocking

The graduates who did not respond caused the assumption of independence to be invalid.
The graduates who did not respond changed the survey from a census to a simple random sample of graduates.
The graduates who did not respond reduced the sample size and smaller samples are more biased than large samples.
The graduates who did not respond may represent a group that is homogeneous with respect to income and differs from the graduates who did respond.
The graduates who did not respond may represent a group that is heterogeneous with respect to income and is similar to the graduates who did respond.
The graduates who did not respond caused the assumption of independence to be invalid.
The graduates who did not respond changed the survey from a census to a simple random sample of graduates.
The graduates who did not respond reduced the sample size and smaller samples are more biased than large samples.
The graduates who did not respond may represent a group that is homogeneous with respect to income and differs from the graduates who did respond.
The graduates who did not respond may represent a group that is heterogeneous with respect to income and is similar to the graduates who did respond.

Have the subjects choose which spray they are willing to use for the 12-hour period.
Assign the sprays to the subjects on the basis of their camping and hiking experience without randomization.
Give the new spray to all subjects for a 12-hour period, then give the DEET spray to all subjects for a second 12-hour period.
Randomly assign the subject to two groups, giving the new spray to one group and the DEET spray to the second group.
Each subject uses a randomization device to select which spray to apply to the right side of their body. The other spray is then applied to the left side of their body.

A random sample of students will be chosen.
Each student in the population belongs to only one stratum.
The population of students will be divided into homogeneous groups by grade level.
Proportional numbers of students could be selected from each grade level.
Every possible subset of the population of students in the district has the same chance of being selected.

No, because there was not a group that received no pesticide.
No, because the experiment was only done with fire ants so the results cannot be generalized to all ants.
Yes, because the ants were randomly selected for the two treatment groups.
Yes, because the difference was statistically significant.
Yes, because there was a control group to reduce the effects of confounding variables.
A restaurant wants to know if customers buy dessert when they eat out. As people leave the restaurant one evening, 20 people are surveyed at random. Eight people say they usually order dessert when they eat out. The restaurant concluded that most customers do not order dessert.
A group of lobbyists has a list of 100 senators. They decide to talk to every 7th senator on the list about their position on farm subsidies.
Convenience
Systematic
Stratified
Simple Random
The president of a college randomly selects 2 students from each department to serve on a student advisory board.
Convenience
Systematic
Stratified
Simple Random
State the type of sample.
In order to determine the average IQ of ninth-grade students, a school psychologist obtains a list of all schools in the local public school system. She randomly selects five of these schools and administers an IQ test to all ninth-grade students at the selected schools.
Stratified Random Sample
Cluster Sample
SRS
Random Sample
The superintendent of a small district has randomly chosen 15 faculty members at a middle school to personally ask if they feel the superintendent is doing a solid job of leading the district. Which sampling design flaw describes this scenario
Voluntary Response
Response Bias
Nonresponse
Undercoverage
The principal of a high school makes an announcement that all students who are interested in planting more trees at the school, should swing by and tell the secretary when they would like to try and plant some trees. Which sampling design best describes the scenario
Voluntary Response Sample
Systematic Random Sample
Cluster Sample
SRS
An opinion poll company in North Dakota sends out their surveyors to knock on doors in Fargo from 10 a.m. to 4 p.m. Which sampling design flaw best describes the scenario
Convenience Sample
Nonresponse
Undercoverage
none of the above
A school newspaper is going to investigate students' perceptions regarding the campus security guards. They plan to survey 100 students at the school. The editor-in-chief tells his staff that he is worried about undercoverage bias created by chronically truant students. His concern is...
unwarranted because some students may refuse to participate and that is inevitable.
justified because chronically truant students will be difficult to survey and will probably have a disproportionately negative view of security guards.
unwarranted because students who cannot be surveyed are not a part of the population of interest.
unwarranted because students who cannot be surveyed are not a part of the sample.
justified because people need to be forced to answer a surey in order for the results to be valid.
Which of the following is a true statement?

a
b
c
d
e
In a Japanese study, "researchers look at 35 people with lower back pain who were enrolled in an aquatic exercise program, which included swimming and walking in a pool. Almost all of the patients showed improvements after six months, but the researchers found that those who participated at least twice weekly showed more significant improvement than those who went only once per week."
This experiment proves that swimming causes a reduction in lower back pain.
The study is a poorly designed experiment since there is no control group and there is no randomization.
Conclusions based on this observational study are suspect since participation in the aquatic program may be confounded with other lifestyle behaviors that may cause the improvement in lower back health.
Conclusions based on this observational study are suspect since a sample size of 35 is too small.
The study is not an observational study since the aquatic program is a treatment.

