
 Worksheets
Heating and Cooling Curves Review
Total questions: 40
Worksheet time: 40mins
During which two processes does a substance release energy?
D) evaporation and melting
C) evaporation and condensation
B) freezing and melting
A) freezing and condensation
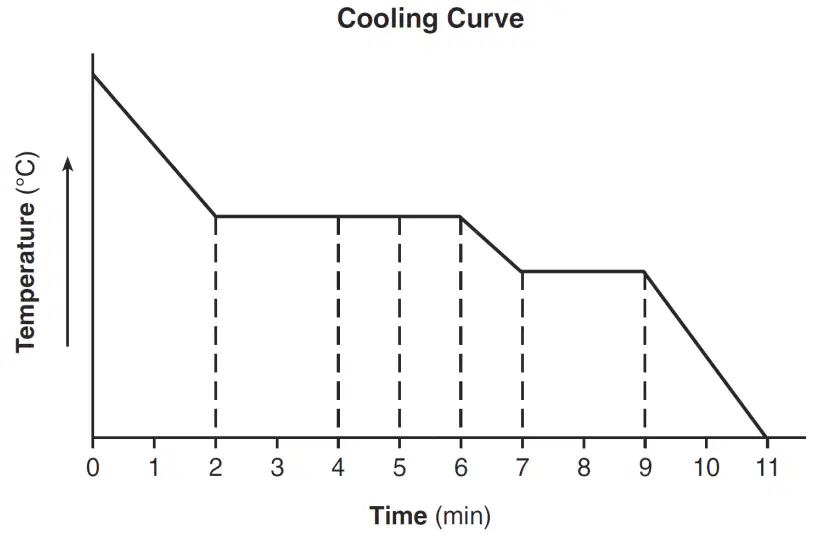
The cooling curve (left) represents the uniform cooling of a substance, starting at a temperature above its boiling point
During which time interval does the substance exist as both a liquid and a solid?
A) min 2 to min 4
B) min 4 to min 5
C) min 5 to min 7
D) min 7 to min 9
At standard pressure, during which physical change does the potential energy decrease?
A) liquid to gas
D) solid to liquid
B) liquid to solid
C) solid to gas
The average kinetic energy of water molecules decreases when
H₂O(s) at 0C changes to H₂O(l) at 0C
H₂O(s) at -73.2C changes to H₂O(s) at -36 C
H₂O(l) at 64C changes to H₂O(l) at 27C
H₂O(l) at 100C changes to H₂O(g) at 100C
A sample of water is boiling as heat is added at a constant rate. Which statement describes the potential energy and the average kinetic energy of the water molecules in this sample?
The potential energy increases and the average kinetic energy increases.
The potential energy increases and the average kinetic energy remains the same.
The potential energy decreases and the average kinetic energy increases.
The potential energy decreases and the average kinetic energy remains the same.
Which process is exothermic?
boiling of water
Condensation of ethanol vapor
melting of copper
Sublimation of iodine
Which phase change is accompanied by the release of heat?
H₂O(s) → H₂O(l)
H₂O(l) → H₂O(s)
H₂O(s) → H₂O(g)
H₂O(l) → H₂O(g)
Which change results in a release of energy?
the evaporation of H₂O(l)
the condensation of H₂O(g)
the melting of H₂O(s)
the boiling of H₂O(l)
State the direction of heat flow between the air in the oven and the muffin batter when the muffin batter is first placed in the preheated oven at 200.°C.
from the air in the oven to the muffin batter
heat flow depends on the specific heat capacity of the muffin batter
from the muffin batter to the air in the oven
no heat flow between the air in the oven and the muffin batter
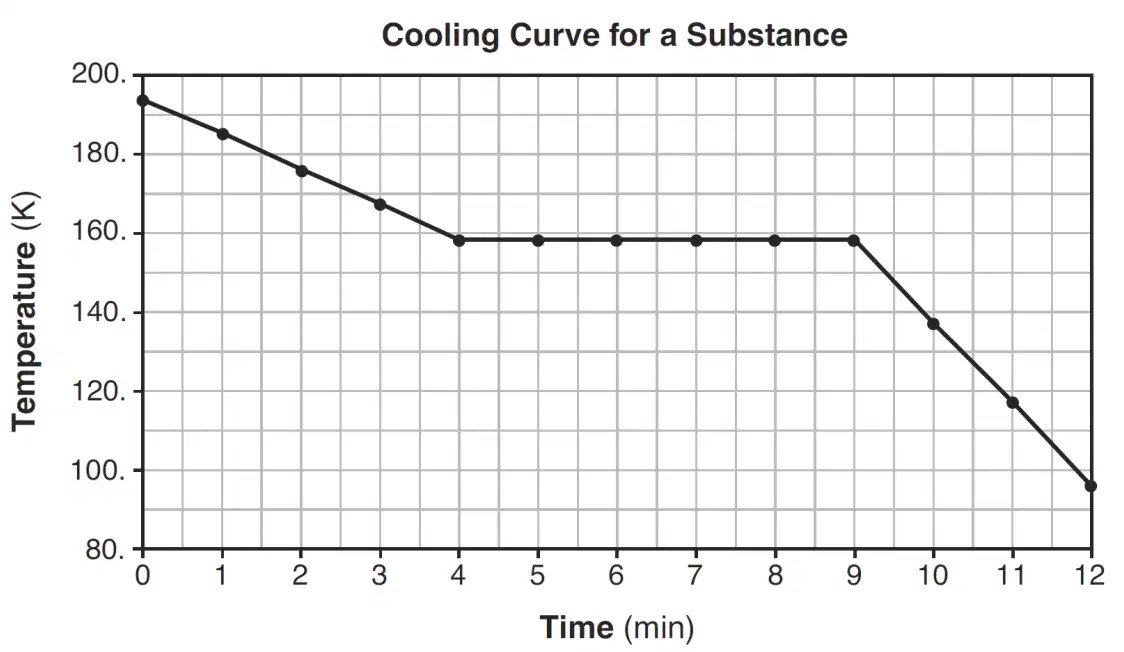
What happens to the average kinetic energy of the molecules in the sample during the first 3 minutes?
It remains the same
It increases
It cannot be determined
It decreases
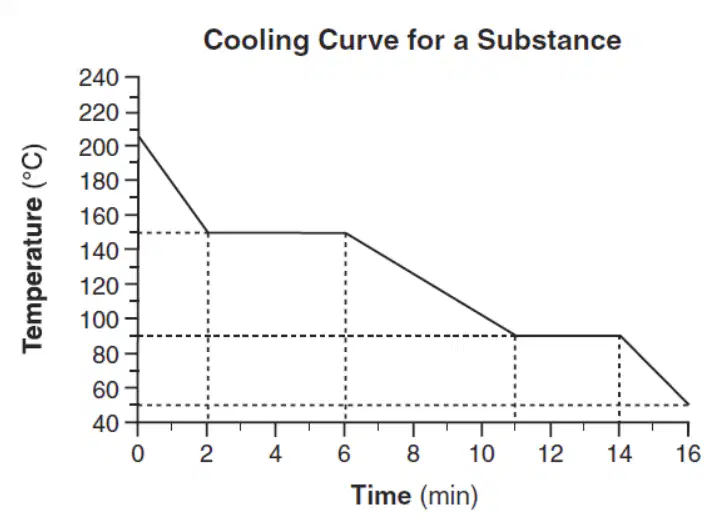
At what time do the particles of this sample have the lowest average kinetic energy?

At what time do the particles of this sample have the lowest average kinetic energy?
50°C and 3 min
50°C and 5 min
110°C and 10 min
110°C and 14 min
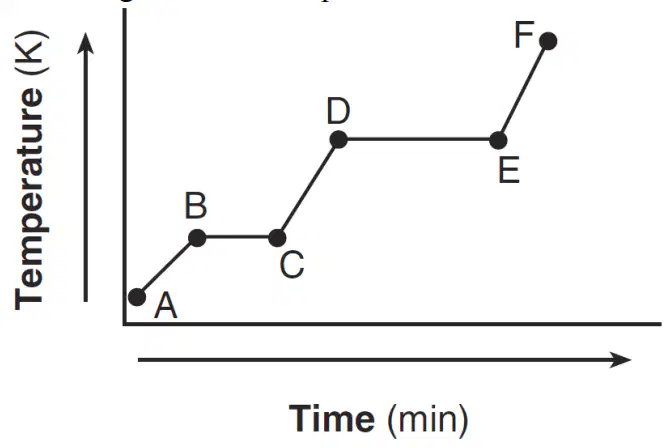
Which statement describes the energy of the particles in this sample during interval DE?
Both potential energy and average kinetic energy increase.
Both potential energy and average kinetic energy decrease.
Potential energy increases and average kinetic energy remains the same.
Potential energy remains the same and average kinetic energy increases.
Which graph could represent the uniform cooling of a substance, starting with the gaseous phase and ending with the solid phase?


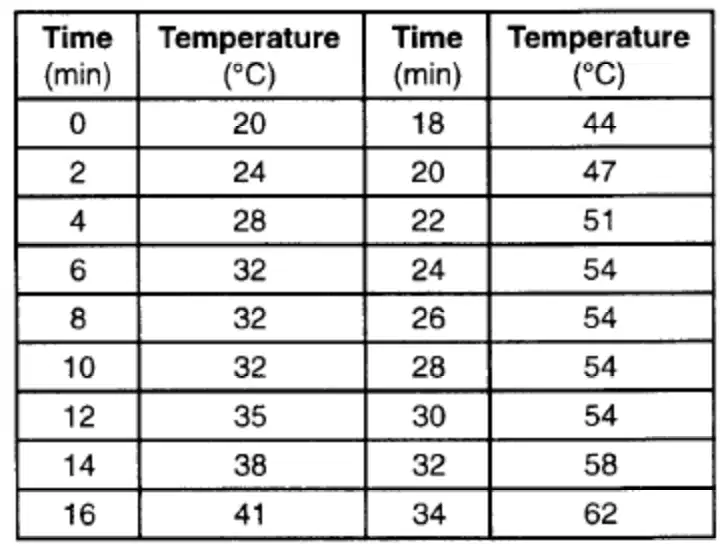
The table left shows the data collected by a student as heat was applied at a constant rate to a solid below its freezing point. What is the boiling point of this substance?
32°C
54°C
62°C
100°C
In the change represented by the equation CO2 (s) --> CO2 (g),
the CO2 (s) is
freezing
melting
condensing
subliming
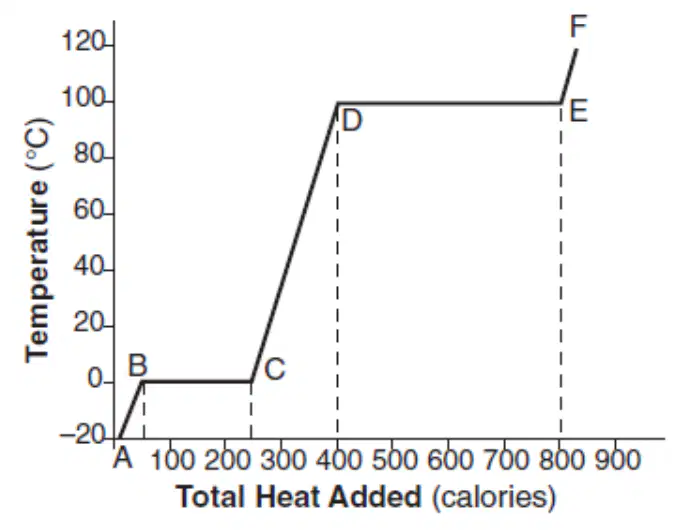
Based on this graph, how many total calories were required to boil the sample?
200 calories, as measured along line BC
250 calories, as measured along line BC
400 calories, as measured along line DE
800 calories, as measured along line DE
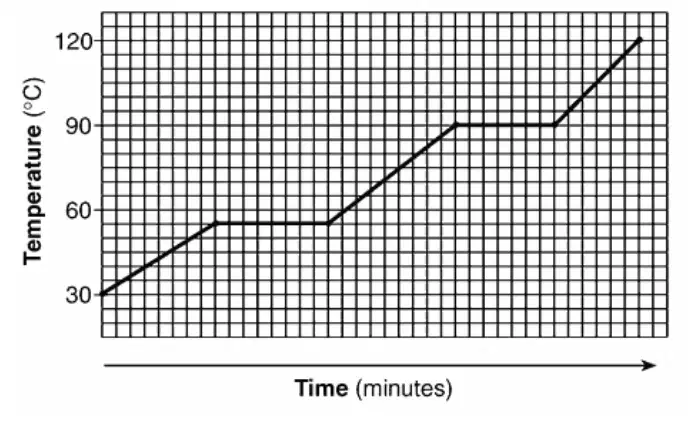
What is the melting point of this substance?
300C
550C
900C
1200C
During a change in kinetic energy, particles are (a) and (b)
During a change in potential energy, particles are (a) and (b)

How much does it cost to have your lawn mowed for 2 hours?

What is the independent variable?

What is the difference between the number of frogs in the pond when the rainfall was 5cm and when the rainfall was 20cm?
20
40
50
60

A scientist wanted to see if the amount of garbage that Americans threw away changed over time. He collected information and then showed his results in the graph below.
Based on this graph, what could the scientist say about the amount of garbage that each person threw away?
It increased over time
it decreased over time
it increased the most in 1980
It decreased the most in 1990


What is the independent variable of this experiment based on this graph?
the length of the gummy bear before it was submerged
the different types of solutions used to submerge the gummy bears.
the length of the gummy bears after they were submerged in different liquids

What is wrong with this graph?
The dependent variable is not labeled.
The data that is graphed is incorrect and a different graph should have been used.
The intervals on the x and y axis are written incorrectly.
The color of the graph is not appropriate or professional

What part of this data table will be graphed on the Y-AXIS?
The food cooked
Type of barbecue
The time
The temperature

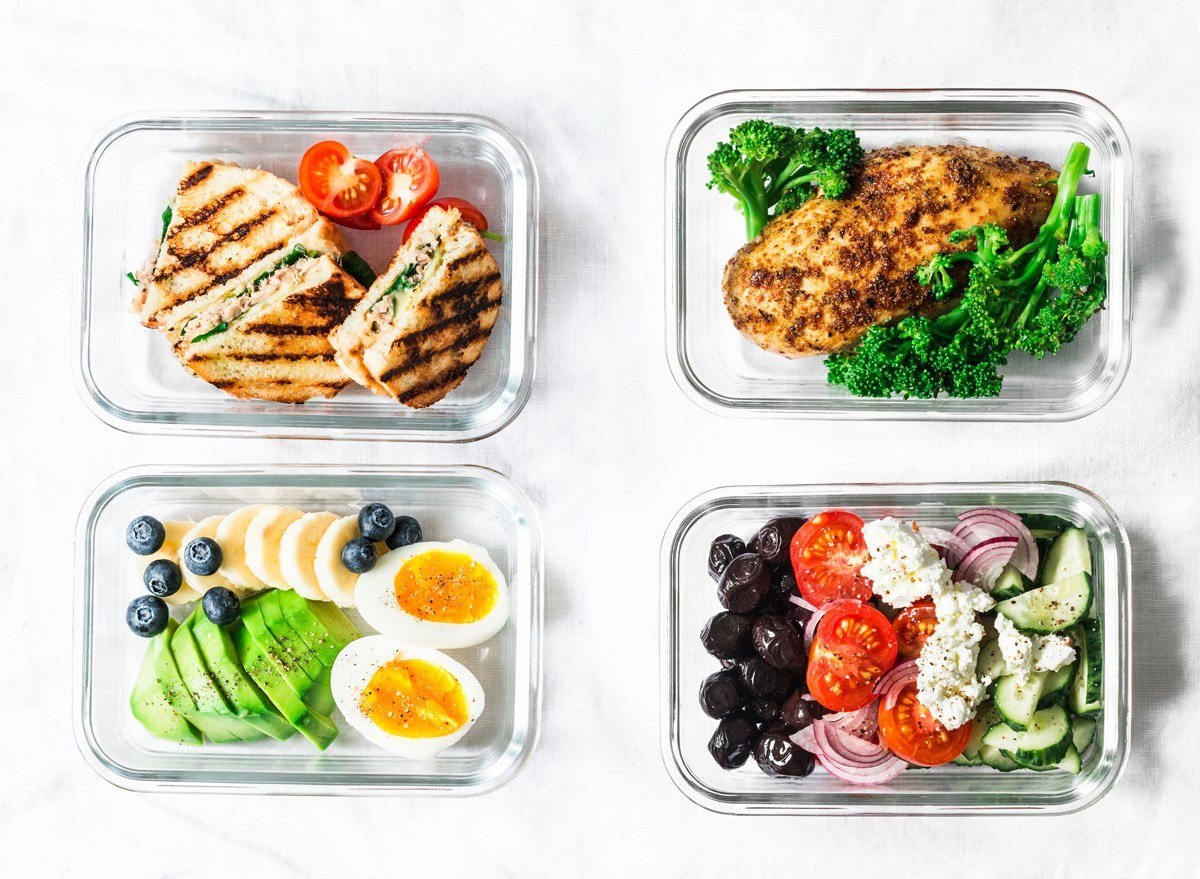
You need to take a survey at school to see which type of lunch food is most preferred by 7th grade students.
Which type of graph would be best to display the data?
Line Graph
Bar Graph or Pie Chart
Scatter Plot
Funnel Chart
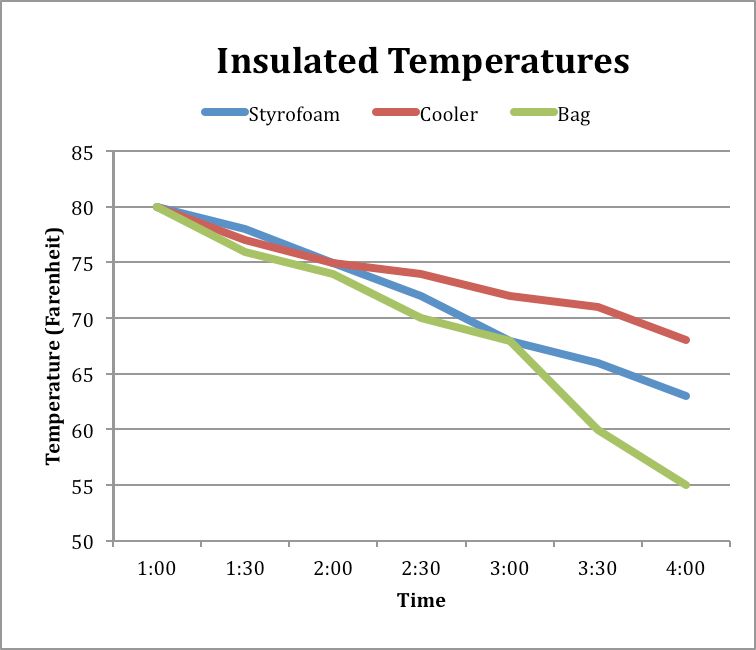
What was the temperature of the liquid in the Styrofoam container at 4:00?
55 degrees
68 degrees
73 degrees
63 degrees
You want to make a graph for an experiment you did about plant growth over a two week period of time. What type of graph would you use?
bar graph
line graph
pictograph
pie chart

The dependent variable in this experiment is -

What part of SULTAN is missing from the above graph?

Refer to the table left. What should be the title of the graph using the data from the table.
What is the best scale for the independent variable? (The x-axis has 20 boxes and the y-axis has 35 boxes)
What is the best scale for the dependent variable? (The x-axis has 20 boxes and the y-axis has 35 boxes)

