
 Worksheets
Graphing
Total questions: 88
Worksheet time: 59mins



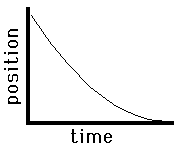
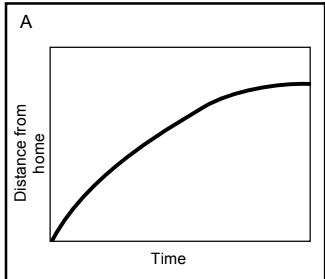
Susie went to the store, when she got there she realized that she forgot her wallet and returned home.
Which graph matches this motion?
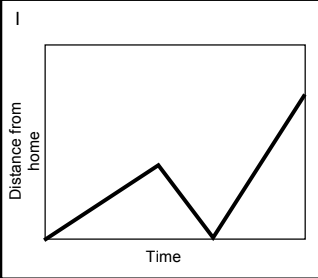
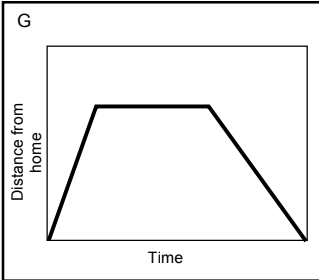
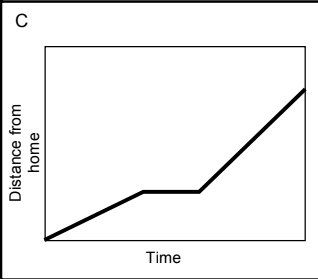
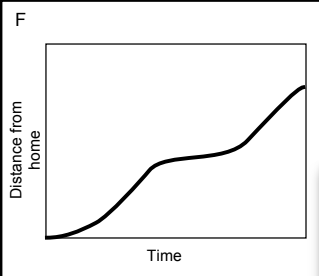
A runner was running the 400 meter dash. They started quickly, then ran at a slower pace, and then sprinted to the finish.
Which graph matches this motion?


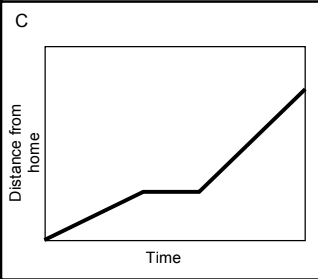
Deb walked to the ice cream shop. Sat and ate her ice cream and then went for a run.
Which graph matches this motion?
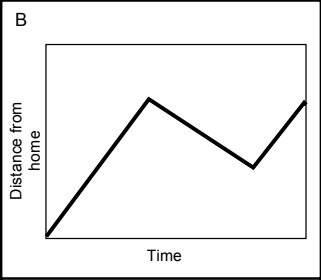
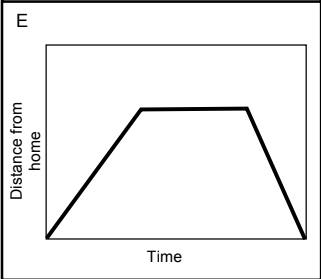
A robber drove away from the bank, then made a U-turn and went back to the bank to pick up his accomplice. Then made another U-turn and speed away from the police.
Which graph matches this motion?


After school, Joe walked home.
Which graph matches this motion?


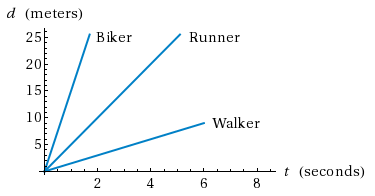
Which person moved the fastest in 3 seconds?
biker
runner
walker
they are all moving equally

Which best describes this graph?
moving forward at a constant speed, increasing speed
moving forward at a constant speed, stopping, returning to the start at a constant speed.
moving quickly, then moving slower
moving forward at a constant speed, stopping, continuing to move forward

Terrance's route to and from his meeting is shown in the graph. When was Terrance traveling the fastest?
On the way home from the meeting
At the meeting
On the way to the meeting
His route there and back was a consistent speed

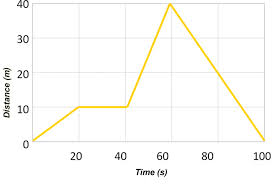

What is the displacement of the object at 45 seconds?
7 m
13 m
.16 m
6.4 m

Segment A-B The bus is _________________.
at rest
returning (to original position)
moving forward

Describe the motion in the graph:
Constant Speed (positive slope)
Stopped (at rest)
Acceleration (increasing speed)
Return Home (negative slope)

Describe the motion in the graph:
Constant Speed (positive slope)
Stopped (at rest)
Acceleration (increasing speed)
Return Home (negative slope)

Describe the motion in the graph:
Constant Speed (positive slope)
Stopped (at rest)
Acceleration (increasing speed)
Return Home (negative slope)

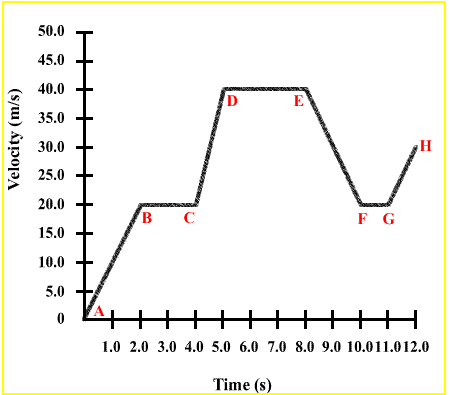
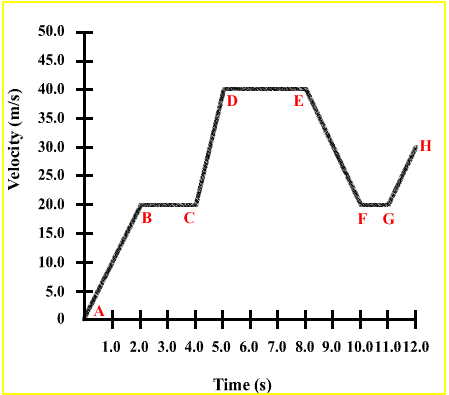
What is happening during point A to B?
not moving
increasing speed at a constant rate
moving at a constant speed
moving at 10 m/s2 acceleration

What is happening during point C to D?
not moving
increasing speed at a constant rate
moving at a constant speed
moving at 0 m/s2 acceleration
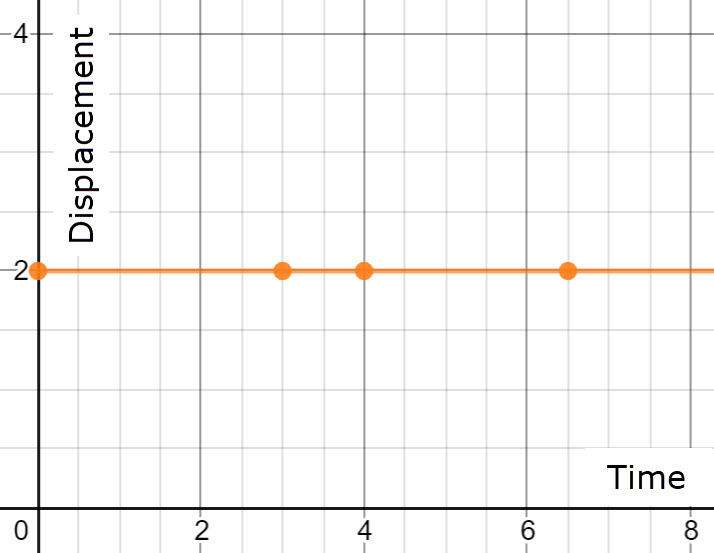
The speed of the object in this graphs is....
Stopped
Constant velocity
Positive velocity
Speeding up
Which of these position vs. time graphs shows an object changing direction?


Which of the following describes the motion of the car?
The car is increasing in speed.
The car is decreasing in speed.
The car has no motion.
The car is moving at a constant speed.




How fast is this object going at 1 second?
20 cm/s
30 cm/s
-40 cm/s
When is this object stopped?
1 second
3 seconds
4 seconds
6 seconds
When does this object change direction?
1 second
2 seconds
3 seconds
4 seconds
Which velocity graph shows towards the origin?


Which velocity graph shows away from the origin?
Which velocity graph shows away from the origin?
Which graph shows an object that doesn't move in the beginning?


What is the shape of a velocity graph for constant velocity?
diagonal line
flat line
parabola
Which side of the graph shows an object coming towards the origin.
positive
negative
zero line
What does Δx mean?
change in position
sum of position
duration
position
Change in position ( Δx ) means:
direction
distance
displacement
How do you find Δx (displacement) on a position graph?
slope
y-intercept
Xf - Xi
area
How do you find Δx (displacement) on a velocity graph?
slope
y-intercept
Xf - Xi
area
How fast is this object going at 1 second?
20 cm/s
30 cm/s
-40 cm/s
When is this object stopped?
1 second
3 seconds
4 seconds
6 seconds
When does this object change direction?
1 second
2 seconds
3 seconds
4 seconds
When is this object going away from the origin?
1 second
3 seconds
4 seconds
4.5 seconds
When does this object change direction?
1 second
2 seconds
4 seconds
6 seconds
Which velocity graph shows towards the origin?
Which velocity graph shows away from the origin?
Which graph shows an object that doesn't move in the beginning?
Which graph shows an object that moves the whole time?


What is the displacement ( Δx ) during the first three seconds?
+2m
+3m
+5m
+6m

What is the total displacement?
+1m
+3m
+5m
-1m
True or False: This object changes direction.
True
False
Can't Tell from graph

This position vs. time graph shows an object...
not moving
moving with constant velocity
moving with changing velocity

This position vs. time graph shows an object...
speeding up
slowing down

This position vs. time graph shows an object...
speeding up
slowing down

A car is moving to the left and speeding up as shown by its velocity versus time graph below. It's acceleration is_____
positive acceleration
negative acceleration
zero acceleration
Which velocity - time graph below would represent a car that is parked at the students' parking lot?


The velocity vs time graph below shows an object that is
moving to the right at a constant velocity
moving to the left at a constant velocity
not moving

The velocity vs time graph below shows an object that is
moving to the left and speeding up
moving to the left and slowing down
moving with a constant velocity
not moving

The velocity vs time graph below shows an object that is
moving to the left and speeding up
moving to the left and slowing down
not moving
moving at a constant velocity

The velocity vs time graph below shows an object that is
speeding up
slowing down
moving at a constant velocity
not moving

The velocity vs time graph below shows an object that is
speeding up
slowing down
moving at a constant velocity
not moving
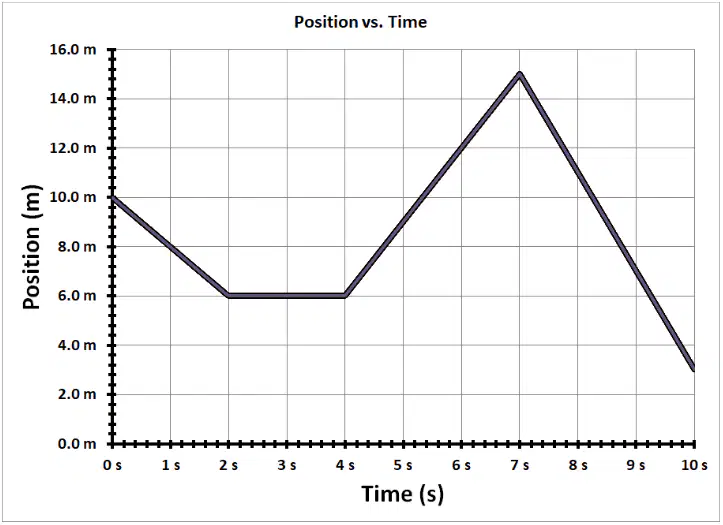
What is the displacement of the object during the 10 second time interval?
-12 m
-7 m
25 m
10 m

Which one is traveling at a constant velocity?
A
B
C
D
E
Which one is traveling with a positive velocity and a negative acceleration?
A
B
C
D
E

On this position vs time graph, describe the motion of A.
constant positive velocity
constant negative velocity
positive acceleration
negative acceleration
velocity is zero
On this position vs time graph, describe the motion of B.
constant positive velocity
constant negative velocity
positive acceleration
negative acceleration
velocity is zero

On this velocity vs time graph, describe the motion of A.
positive velocity
negative velocity
positive acceleration
negative acceleration

What is the acceleration during interval A?
0 m/s/s
2 m/s/s
10 m/s/s
20 m/s/s
What is the displacement from 0-10 seconds?
10 m
10 m
100 m
200 m
What is the displacement from 15-30 seconds?
150 m
-150 m

