
 Worksheets
Unit 1 Review CMU CS Academy
Total questions: 23
Worksheet time: 48mins
Understanding Position and Size in Python Programming
Our first program involves drawing a rectangle by running Python code. By changing the numbers in the code and running it multiple times, you can observe how the rectangle's appearance changes. If the code stops working, simply press the reset button to start over.
The canvas is essential for all drawing activities in this course. It consists of pixels represented by (x,y) coordinates. The canvas is a 400x400 square, with (0, 0) at the left-top corner, (200, 200) at the middle, and (400, 400) at the right-bottom corner.
When using the Rect command to draw a rectangle, you need to provide four values: left, top, width, and height. For example, Rect(10, 20, 30, 40) draws a rectangle with its left-top corner at (10, 20). Can you determine the location of the rectangle's right-bottom corner?
Remember that Python is strict with syntax. Rect is not the same as rect, and the number of arguments must be correct. Comments, indicated by #, can be added to code for clarity. Practice exercises are provided to reinforce the concepts learned.
What are the coordinates of the canvas in a 400x400 square?
(0,0) to (400,400)
(1,1) to (399,399)
(100,100) to (500,500)
(200,200) to (600,600)
What are the four values required to draw a rectangle using the Rect command?
left, top, width, and height
x, y, length, and breadth
start, end, width, and height
radius, diameter, width, and height
Position and Size
The canvas is (a)
(x, y) coordinates refer to points on the canvas
x values (b) as you head right
y values increase as you head (c)
Rect (left, top, width, height) draws a (d)

1.2.1 Fills and Borders
Fills
To change a shape's color, use the optional fill argument, like so:
Rect (50, 50, 100, 100, fill='green')
Run the code, and you should see a green rectangle.
When using fill, here are some rules to follow:
Include fill after the required arguments -- left, top, width, and height.
Always place an equals sign (=) before the color name.
Put quotes around the color name. You can use either single quotes, like 'blue', or double quotes, like "blue".
As we saw before, if any of these rules are not right, you have a syntax error and the code will not run until you fix the error.
Drawing Order
The order in which we draw shapes matters. Each new shape is drawn on top of all the previous shapes.
Rect(0, 0, 100, 100, fill='orange')
Rect(50, 50, 100, 100, fill='lime')

Borders
Rectangles may have an optional border, like so:
Rect(50, 50, 100, 100, fill='yellow', border='blue')

By default, borders are 2 pixels wide. You can change that with borderWidth:
Rect(50, 50, 100, 100, fill='yellow', border='blue', borderWidth=12)

Dashes
Rectangle borders may use dashes.
Rect(50, 50, 100, 100, fill='cyan', border='navy', dashes=True)

Usually, if we use dashes, we use dashes=True, like above. However we can also use a pair of values, (dashWidth, gapWidth).
Rect(50, 50, 100, 100, fill='cyan', border='navy', dashes=(1,4)) # a dotted dash pattern
Empty Fills
We can draw a rectangle with only a border color, and without any fill color. To do this, set the fill to None.
Rect (50, 50, 100, 100, fill=None, border='blue', borderWidth=6)
Hint: Color names like 'blue' need quotes, but None does not, so do not use 'None'. Also, be sure to use None and not none.
Default Values
We just learned that fill, border, and borderWidth are optional arguments. If we do not supply an optional argument, the shape uses the default value for that argument. The default fill is 'black'. The default border is None. And the default borderWidth is 2.
The Inspector
The Inspector is a great way to get useful info about shapes, but it only gives as much info as you need. For example, it tells you the colors of a shape, but it does not say whether the colors are for the fill or for the border. This is left for you to figure out! So the Inspector is super helpful, but it definitely leaves some important problem-solving for you.
Why does the order in which shapes are drawn matter?
To confuse the viewer
To save time
To ensure each new shape is drawn on top of the previous ones
To make the drawing process more difficult
What are some customizable features of the optional border for rectangles?
Color and width
Shape and size
Texture and opacity
Pattern and gradient
How can you change a shape's color?
Use the optional fill argument
Use the optional border argument
Use the optional size argument
Use the optional shape argument
Fills
Rect(left, top, width, height, fill='green') draws a (a) rectangle
The fill argument is (b)
The default fill is ' (c) '
To not have a fill, set fill= (d)
Drawing order:
Shapes drawn first are _________ shapes drawn later
In front of
behind
Borders
To draw a shape with a border, set the border property.
Ex. Draw a rectangle with a green border:
Rect(left, top, width, height, (a) )Now with a border width of 4:
Rect(left, top, width, height, border='green', (b) )
The default border is _____
The default borderWidth is __
None
2
black
5
True
True
Dashes
Dashes can be defined as True or False
Ex. Draw a rectangle with a dashed green border:
Rect(left, top, width, height, border=‘green’, dashes= (a) )Dashes can also be written as a pair of values ( (b) , gapWidth):
Ex. To draw a rectangle with dashes of length 1 pixel and gaps of length 4 pixels:
Rect(left, top, width, height, border='green', dashes=( (c) ))The default dashes is (d)

1.2.3 Colors and Gradients
Named Colors
So far we've seen black, navy, gold, and a few more colors. Are there others? Sure! Check these out:
Rect(100, 100, 100, 100, fill='chartreuse', border='salmon', borderWidth=20)
Rect(250, 100, 100, 100, fill='teal', border='orchid', borderWidth=20)
Rect(100, 250, 100, 100, fill='bisque', border='sienna', borderWidth=20)
Rect(250, 250, 100, 100, fill='coral', border='cadetBlue', borderWidth=20)
All 143 color names you can use are listed in this color table. That's a lot of colors!
Unnamed Colors
After the name seaGreen, the color table includes rgb (46, 139, 87). What is this? We can use this rgb value in place of the color name, like so:
Rect (250, 100, 100, 100, fill = 'seaGreen')
Rect (100, 100, 100, 100, fill = rgb(46, 139, 87)) # same color, only using its rgb value
In general, use a color name if you can. However, while the table contains just 143 names, with rgb values we can use over 16 million different colors!
For example, let's use mint green. There is no such color in the table, so we cannot use it by name. No problem. Do a web search for 'rgb mint green', and among the various results you will see that mint green has an rgb value of 152, 255, 152. We can use that to create a mint green rectangle like so:
Rect(50, 50, 100, 100, fill= rgb (152, 255, 152)) # this works! mint green!
Sidebar: What do rgb values mean? You do not need to know this for the course, but it is interesting. Rgb values include three numbers, each between 0 and 255, which show the amount of red, green, and blue in that color. For example, dark orange is rgb (255, 140, 0). The 255 means that there is lots of red in dark orange (as much as possible). The 140 means there is some green as well (about half as much as possible). And the 0 means there is no blue in dark orange. That's it.
Radial Gradients
In addition to solid colors, we can use gradients, which fade from one color to another color. We'll start with radial gradients, which fade from the center of the shape outwards to its border. For example:
Rect(50, 50, 100, 100, fill = gradient ('red', 'blue'))

Linear Gradients
Besides radial gradients, we can also use linear gradients that fade straight across the shape. To do this, we include the start of the gradient. For example:
Rect (50, 50, 100, 100, fill = gradient ('red', 'blue', start = 'left'))

Run the code and see what happens. Our code includes start = 'left', and the gradient flows from left to right. We also could have started from the 'right', 'top', or 'bottom'. What about the corners? We can also start from them, as such:
Rect (50, 50, 100, 100, fill=gradient ('red', 'blue', start = 'left-top'))

Gradients with More Colors
We can include more than two colors in a gradient. For example:
Rect(50, 50, 100, 100, fill=gradient('red', 'blue', 'green', start='left'))

How many named colors are available for use in the color table?
256
64
143
128
What types of gradients can be used to create color transitions in shapes?
Linear and circular gradients
Diagonal and zigzag gradients
Vertical and horizontal gradients
Radial and linear gradients
How many different color options can be achieved using RGB values?
Over 16 million
100
256
1 billion
Colors: find a list of color names in the (a) page.
To use rgb colors, use rgb ( (b) , (c) , (d) )
This lets you makes custom colors
Ex. rgb(152, 255, 152) is mint green!
The values for red, green, blue must be between (e) inclusive
Gradients
The default gradient is a (a) gradient
This fades from the center of the shape outwards
It uses at least (b) colors
Ex. gradient('red', 'green', 'blue')
linear gradient
This fades starting from one corner or edge of the shape to the other
Ex. gradient('red', 'green', 'blue', start=' (c) ')

1.2.5 Opacity
Ok, we are almost done with the lesson on colors. Just one last topic: opacity. Opacity is the opposite of transparency -- the higher the opacity, the less transparent a shape is.
If the opacity is 100, the largest value, the shape is not at all transparent -- you cannot see through it at all, and it completely hides all the shapes behind it.
If the opacity is 0, the smallest value, the shape is completely transparent, so it looks as though it is not there.
The default opacity is 100, so if you do not specify the opacity, the shape is entirely not transparent. For example:
Rect(125, 100, 150, 100, fill='gold')
Rect( 75, 150, 100, 100, fill='blue')
Rect(225, 150, 100, 100, fill='blue', opacity=50)
What does an opacity of 100 mean for a shape?
Completely non-transparent
Partially transparent
Completely transparent
Semi-transparent
What is the default opacity value?
0
50
100
150
What is the relationship between opacity and transparency?
Higher opacity makes a shape more transparent
Higher opacity makes a shape less transparent
Opacity has no effect on transparency
Higher transparency makes a shape less opaque
Opacity
opacity is the (a) of transparency
The values for opacity are between 0 and 100
The default opacity is (b) (completely opaque, completely hides shapes behind it)
A shape with an opacity of 0 is completely (c)

1.3.1 Rectangles, Ovals, Circles, and Lines
Rectangles
In this section, we will see some more shapes we can use. We have already seen rectangles. For example:
Rect (150, 150, 100, 200, fill = 'green')
That draws a 100x200 green rectangle with its left-top at (150, 150). Fine! Now let's see some more shapes!
Ovals
To draw an oval (also called an ellipse), we use the center instead of the left-top, but then we still use the width and height, like so:
Oval(150, 150, 100, 200, fill='gold')
That draws a 100x200 gold oval centered at (150, 150).
Ovals, like most shapes, can have borders, borderWidths, gradients, and other properties that rectangles have!
Circles
Circles are drawn just like ovals, only instead of a width and a height we just use a radius. So we draw a circle centered at (100, 200) with a radius of 50
Circle (100, 200, 50, fill = 'green') # centered at (100, 200) with a radius of 50

Lines
A line runs from a point (x1, y1) to another point (x2, y2). We include those points when drawing a line. So we draw a line from (50, 100) to (75, 200) like this:
Line(50, 100, 75, 200)

We use fill for the color of a line, like so:
Line (75, 200, 50, 100, fill = 'orange')

Lines do not have a border. It is an error to set the border of a line. Instead, use fill for the line's color.
We set the width of a line using lineWidth, like so:
Line (75, 200, 50, 100, fill = 'orange', lineWidth = 8)

Lines do not have a borderWidth. It is an error to set the borderWidth of a line. Instead, use lineWidth. Like borders, lines can also have dashes by setting dashes=True or dashes=(dashWidth, gapWidth).
What function is used to draw rectangles with specified dimensions and color?
Circle
Line
Rect
Triangle
How are ovals drawn using the Oval function?
With random dimensions and color
With specified dimensions and color
Without specifying a center point
Using the Circle function instead
What function is used to draw lines with specified start and end points, color, and line width?
Circle
Rectangle
Line
Triangle
How are circles drawn using the Circle function?
With a specified radius and color, centered at a specific point
With a random radius and color
With a random radius and centered at a specific point
With a specified radius and color, centered at a random point
Rectangle, Ovals, Circles, and Lines
Rectangles and Ovals
Rect ( (a) , (b) , width , height ) draws a rectangle
Oval ( (c) , (d) , width , height ) draws an oval
Circles
Circle( (a) , (b) , (c) ) draws a circle centered at (x, y)
To the autograder this is the same as an oval with equal width and height
Lines
Line(x1, y1, x2, y2) draws a line from (x1, y1) to (x2, y2)
Line( (d) , (e) lineWidth = 5) draws a thicker line
The default lineWidth is 2
1.3.3 Regular Polygons and Stars
Regular Polygons
We know how to draw a square -- we use Rect and make the width and height the same. But what about a triangle? Or a pentagon (with 5 sides) or a hexagon (with 6 sides), and so on? These are called regular polygons, and we draw these using RegularPolygon.
We draw a regular polygon similarly to a circle -- with an (x,y) center and a radius. We just need one more argument: the number of points (or sides, if you prefer, since there are the same number of points as sides). Here is how we draw a hexagon centered at (200, 100) with a radius of 75:
RegularPolygon(200, 100, 75, 6)

Stars
We draw a star in the same way that we draw a RegularPolygon:
Star(200, 100, 75, 5)

Roundness
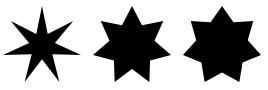
You probably have a clear idea what a 5-sided star should look like -- basically, like it does on any flag. Same goes for a 6-sided star. But a 7-sided star is less obvious. Which of the following is the right shape for a 7-sided star?
We see that there are many different kinds of 7-sided stars, some are more circular or rounder than others. The same is true for all stars. When we create a star, we can set its roundness to any value between 0 and 100. For example:
Star( 80, 130, 35, 7, roundness=20)
Star(160, 130, 35, 7, roundness=40)
Star(240, 130, 35, 7, roundness=60)
Star(320, 130, 35, 7, roundness=80)
# Let's add labels for these, so it's easier to see which is which
Label('20', 80, 180)
Label('40', 160, 180)
Label('60', 240, 180)
Label('80', 320, 180)
Label('Roundness', 200, 200)
Run the code. Look very carefully at the different stars. See how as the roundness increases, the star looks more circular (rounder).

We would not expect you to figure out roundness based on simply looking at a shape. Fortunately, the Inspector tells you the roundness of any star that does not use the default roundness.
That's it for regular polygons and stars!
How does the roundness of stars affect their shape?
It makes them look more triangular
It makes them look more circular
It makes them look more square
It makes them look more hexagonal
What is used to draw regular polygons with a specified number of sides?
RegularTriangle
IrregularPolygon
RegularPolygon
Circle
Regular Polygons and Stars
Regular Polygons
Regular polygons include: triangles, diamonds, pentagons, hexagons, and so on
RegularPolygon( (a) , (b) , (c) , (d) )
Ex: Draw a pentagon at (100, 100) with a radius 50:
RegularPolygon(100, 100, 50, 5)
Stars
Star( (a) , (b) , (c) , (d) ) draws a star
Ex. Star(100, 100, 50, 5) draws a 5-sided star at (100,100) with radius 50
Change the roundness to make the star more or less round
Values for roundness are between 0 ("spiky") and 100 (almost a circle)
1.3.4 Polygons
Last shape! We draw a polygon similarly to a line, by listing the (x,y) points in order, like so:
Polygon(100, 100, 100, 300, 150, 300)
Run the code. Do you see how the polygon connects the points (100, 100), (100, 300), and (150, 300)? See how these values are included in the call to Polygon. Also, note that the polygon clearly is not regular (where all the sides have the same length), so we could not have drawn it using RegularPolygon.

Can RegularPolygons be used to draw irregular shapes like polygons?
Yes
No
Sometimes
Not sure
How are polygons drawn?
By connecting random points
By listing the (x,y) points in order
By using only odd-numbered points
By drawing straight lines between points
What does the Polygon function do?
Connects specified points to create a shape
Calculates the area of a circle
Sorts data in alphabetical order
Plots a scatter plot
Polygons
Create polygons by connecting points in (a)
Polygon(10, 60, 50, 20, 30, 90) connects (b) to (50, 20) to (c)

1.3.5 Labels
We use a label to draw text, like so:
Label('hello', 200, 200)
This draws the value 'hello' centered at (200, 200). In general, Label takes 3 arguments -- the value to draw, and the (x, y) center where to draw it.
For now, we will only use label values that are strings. String values are in quotes ('single-quotes' or "double-quotes"), just like the color names we've been using. Be sure to include quotes, or you will get a syntax error!
Sizes
We can make the label larger or smaller using the optional size argument, like so:
Label('small!', 200, 100, size=10)
Label('medium', 200, 200, size=30)
Label('large!', 200, 300, size=120)

Bold, Italic, and Fonts
We can make a label bold or italic, like so:
Label('This is plain!', 200, 50, size=36) # normal default style
Label('This is bold!', 200, 150, size=36, bold=True)
Label('This is italic!', 200, 250, size=36, italic=True)
Label('This is bold and italic!', 200, 350, size=36, bold=True, italic=True)

We can also change the font, like so:
Label('This is default!', 200, 50, size=36) # default font
Label('This is arial!', 200, 125, size=36, font='arial')
Label('This is cinzel!', 200, 200, size=36, font='cinzel')
Label('This is cursive!', 200, 275, size=36, font='sacramento')
Label('This is monospace!', 200, 350, size=36, font='monospace')
Run that code and look carefully at the canvas to see that the fonts are all different! We have the following options when picking our fonts:
'arial', 'monospace', 'caveat', 'cinzel', 'montserrat', 'grenze', 'sacramento', and 'orbitron'

Fills and Borders
We can use colors with labels, as with other shapes:
Label('This is black!', 200, 50, size=36) # default color
Label('This is blue!', 200, 150, size=36, fill='blue')
Label('This has a red border!', 200, 250, size=36, fill=None, border='red')
Label('This has a gradient!', 200, 350, size=36, fill=gradient('blue', 'orange'))

What can be applied to labels for further customization in visual appearance?
Shapes
Textures
Colors
Sizes
How can labels be customized in terms of design?
By changing the color only
By adjusting the size, boldness, italics, and font style
By adding animations
By changing the background image
What can labels be used for in programming?
Drawing shapes
Storing data
Drawing text
Executing functions
Labels
Label('hello', x, y) draws a label (a) at (x,y)
Label('hello', x, y, size=20) use size to draw a (b) label
Label('hello', x, y, bold=True, italic=True) draw a (c) label
Label('hello', x, y, font='monospace') use font to change the label's (d)
The currently available fonts : 'arial', 'monospace' , 'caveat' , 'cinzel' , 'montserrat' , 'grenze' , 'sacramento' , 'orbitron' , 'symbols'
Label(‘hello’, x, y, fill=None, border=‘red’) use (e) as with other shapes

