
 Worksheets
Speed=Dist-Time and Dist-Time Graphs
Total questions: 80
Worksheet time: 2hrs 38mins


A runner races in the 100 meter dash. It takes her 10 seconds to finish. What is her average speed?
10 m/s
1000 m/s
100 seconds
10 seconds


Time formula
T= D/S
T= S X T
T = D/ T
T= T/ T


Car A- distance: 4 meters, time: 2 sec
Car B- distance: 2 meters, time: 2 sec
Car C- distance: 8 meters, time: 2 sec
Car B= 2
Car C = 3
Car B= 1
Car C= 3
Car B= 1
Car C = 2
Car B= 2
Car C= 1

Avery rides her bike 15 miles in 5 hours. Which girl rides her bike faster?

The formula for Speed is...
Speed = distance/ time
Speed = time/ distance

If you are solving for the distance, you would calculate the...
time divided by speed
speed divided by time
speed multiplied by time
distance multiplied by speed

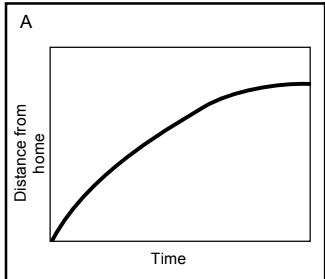
Which of the graphs shows that one of runners started in the same place?


In which of the following graphs below did one runner overtake (run past) the other?


Which is faster?
walking
skating
biking



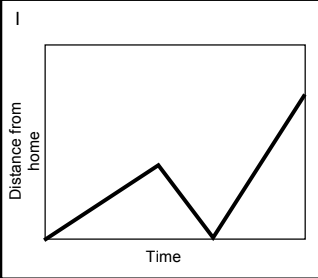
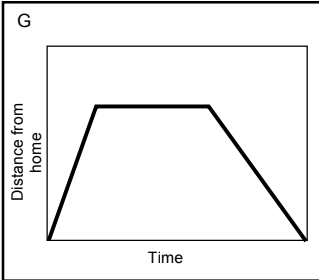
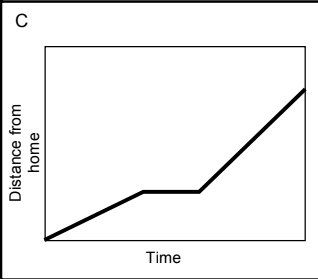


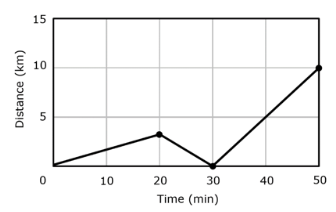
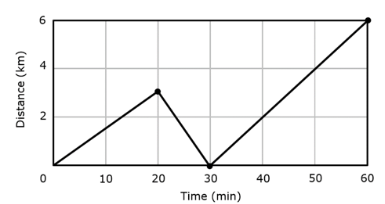
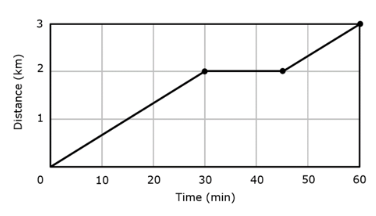
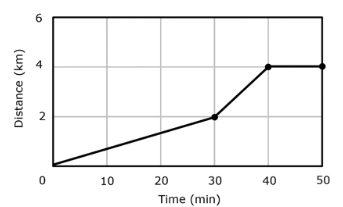
A student walks 2.0 km in a time of 30 minutes. The student then stop for 15 minutes to eat a snack then travels 1.0 km in 15 minutes.
Which graph shows the journey described?

Edward drove 80 miles from his home to London.
He stopped and visited his friend Nicola on the way. Here is the distance-time graph for the journey.
How far was Edward from home when he visited Nicola?
30 miles
40 miles
10 miles
45 miles

Edward drove 80 miles from his home to London.
He stopped and visited his friend Nicola on the way.
Here is the distance-time graph for the journey.
How long did Edward stop for?
2 hours
1 hour
1.2 hours
1.5 hours

Anne cycles from Bristol to Salisbury.
The diagram shows the distance-time graph of her journey.
How far from Bristol is Anne at 8:00?
15 miles
20 miles
10 miles
40 miles


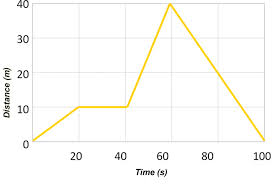
In the graph shown above how long does it take for the runner to get to the 30 yard mark?
1 second
2 seconds
3 seconds
4 seconds

Which sentence best describes the runner whose distance-time graph is shown?
The runner ran forward for 2 seconds, and then ran backward for 2 more seconds.
The runner ran forward for 2 seconds, and then stood still for 2 more seconds.
The runner ran forward for 2 seconds, and then ran forward more slowly for 2 more seconds.
The runner ran forward for 2 seconds, and then turned right and continued forward at the same speed for 2 more seconds.
Match the graph to the description:
"The car is slowing down."
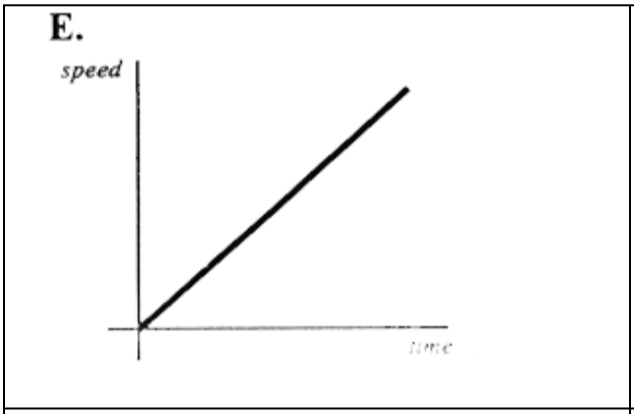
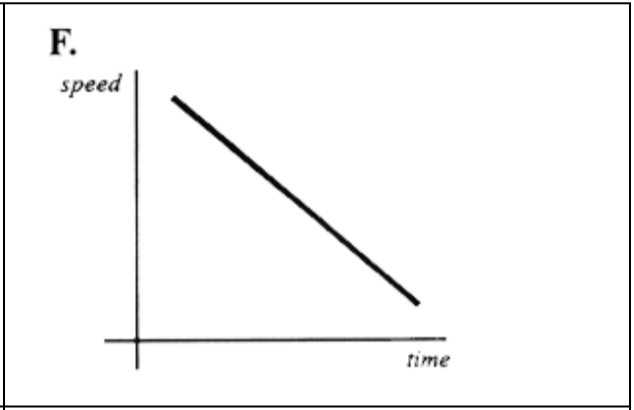
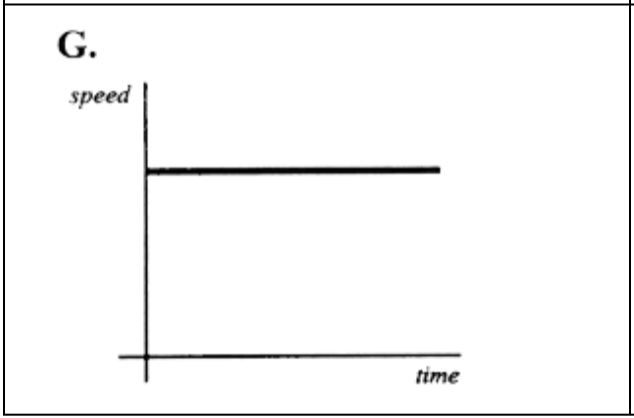
Match the graph to the description:
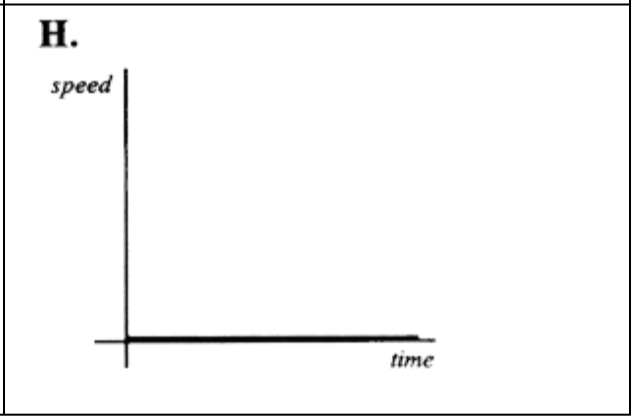
"The car is stopped."
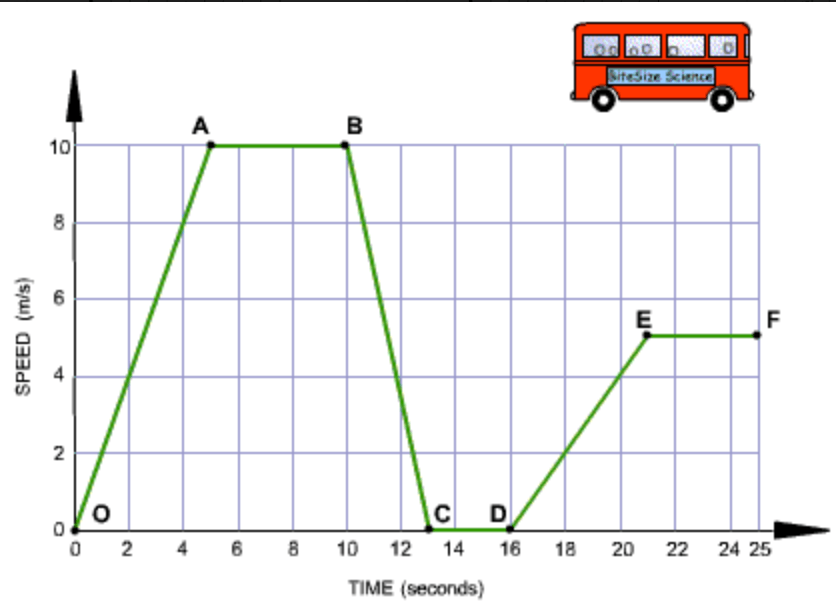
Segment C-D: The bus is _________________. It has stopped.
accelerating
decelerating
constant speed
at rest
Match the graph to the description:
"The car is accelerating speeding up (positive acceleration)."
Segment D-E: The bus is _________________. It is gradually increasing it's speed.
accelerating
decelerating
constant speed
at rest

A
B
C

A
B
C

What is this graph showing?
At rest
Acceleration
Constant speed of 1 m/s
Gradually speeding up
A negative acceleration means that your object is _____.
doing nothing
moving in circles
speeding up
slowing down
Segment B-C: The bus is _________________. It is slowing down from 10 m/s rest in 3 seconds.
accelerating
decelerating
constant speed
at rest
Segment A-B: The bus is moving at a _________________ of 10 m/s for 5 seconds.
accelerating
decelerating
constant speed
at rest
Segment C-D: The bus is _________________. It has stopped.
accelerating
decelerating
constant speed
at rest

Which time interval shows a constant velocity and no acceleration?
18 s to 24 s
4 s to 18 s
0 s to 24 s
0 s to 3 s

A car accelerates from rest (zero speed) up to a speed of 30 m/s in 12 seconds. Its acceleration is...
2.5 m/s2
360 m/s2
0.4 m/s2
0.4 m/s

What is the acceleration in the first ten seconds?
(15m/s - 0m/s) / 10s =
4 m/s2
1.5 m/s2
10 m/s2
0 m/s2
Karina is slowing down on her skateboard. She starts at a speed of 5.5m/s and slows to 1.0 m/s over a time of 3.0 seconds. What is Karina's acceleration?
-1.5 s2m
8.5 m/s
-2.5 m/s
4.5 km/s
0.7 m/s2
7 m/s2
14 m/s2


