wayground logo

Free Printable Worksheets

Font size

S
M
L
XL
Worksheets

Stats: Chapter 1 Test Review

Total questions: 65

Worksheet time: 4hrs 56mins

Name
Class
Date
1.
Categorical or Quantitative?
Years of schooling completed
a)
Categorical
b)
Quantitative
2.
Categorical or Quantitative?
College Major
a)
Categorical
b)
Quantitative
3.

Age of each student in Algebra class

a)

Categorical

b)

Quantitative

4.

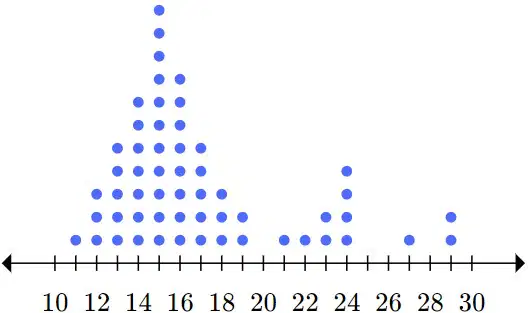
The data in the dot plot is ​ (a)   (normal or skewed).

The ​ (b)   should be used to represent the center.

Choose from the below words
skewed
Approx. Symmetric
median
mean
mode
range
5.

The data in the dot plot is ​ (a)   (normal or skewed).

The ​​ (b)   should be used to measure the variability.

Choose from the below words
skewed
approx. symmetric
Range
Standard Deviation
Interquartile Range (IQR)
6.

The data in the dot plot is ​ (a)   (normal or skewed).

The ​ (b)   should be used to represent the center.

Choose from the below words
skewed
approx. symmetric
median
mean
mode
range
7.

The data in the dot plot is ​ (a)   (normal or skewed).

The ​ (b)   should be used to represent the center.

Choose from the below words
skewed
approx. symmetric
median
mean
mode
range
8.

The data in the dot plot is ​ (a)   (normal or skewed).

The ​ (b)   should be used to measure the variability.

Choose from the below words
skewed
approx. symmetric
Interquartile Range (IQR)
Standard Deviation
Mode
Range
9.

When using IQR to find outliers, which formula will identify the upper limit?

a)

Q3 - 1.5(IQR)

b)

Q1 + 1.5(IQR)

c)

Q1 - 1.5(IQR)

d)

Q3 + 1.5(IQR)

10.

When using IQR to find outliers, which formula will identify the lower limit?

a)

Q3 - 1.5(IQR)

b)

Q1 + 1.5(IQR)

c)

Q1 - 1.5(IQR)

d)

Q3 + 1.5(IQR)

11.
Which of the following best describes the process of finding the interquartile range for a set of data?
a)
Add the biggest and smallest numbers.
b)
Place the numbers in order from least to greatest and find the middle.
c)
Find the difference between the maximum and the minimum.
d)
Subtract Q1 from Q3.
12.

Identify the outlier for the given data?

23, 34, 27, 12, 30, 26, 28, 31, 34

a)

12

b)

23

c)

34

d)

None

13.

Find the outlier of the data set.


15, 20, 18, 35, 17, 35, 13

a)

None

b)

35

c)

13

d)

15

14.
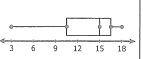
Which box and whisker plot has the highest median?
a)
Top plot
b)
Bottom plot
15.
What is the range of the data shown?
a)
85
b)
90
c)
80
d)
70
16.
a)

A

b)

B

c)

C

d)

D

17.
a)

F

b)

G

c)

H

d)

J

18.

Which is a true statement based on the box plots above

a)

The data for Team B have the greater range.

b)

The data for Team A are more symmetric.

c)

The data for Team B have the greater interquartile range.

d)

The data for Team A have the greater median.

19.

Which is a true statement based on the dot plots above?

a)

Set B has the greater range

b)

Set B has the greater median

c)

Set B has the greater mean

d)

Set A is less symmetric that Set B

20.
Compare the centers and spreads. 
a)
 Math has a higher median (center) and a wider spread.
b)
 Math has a higher median (center) and a smaller spread.
c)
Math has a lower median (center) and a smaller spread.
d)
Math has a lower median (center) and a wider spread.
21.
Which dot plot has the greatest variability?
a)
A
b)
B
c)
C
d)
D
22.
Is the Cars dot plot skewed left or right?
a)
left
b)
right
23.

What is the shape of the distribution?

a)

The distribution is approximately symmetrical.

b)

The distribution is skewed to the right.

c)

The distribution is skewed to the left.

d)

The distribution is approximately uniform.

24.
What was the day with the least amount of cars sold? 
a)
Monday
b)
Tuesday
c)
Wednesday
d)
Thursday
25.
How many students had more than 6 candy bars?
a)
5
b)
2
c)
3
d)
1
26.

What is the Maximum data item on this stem and leaf plot?

a)

56%

b)

88%

c)

94%

d)

8122348%

27.
How many students scored more than 80%?
a)
10
b)
13
c)
7
d)
15
28.
What is wrong with this stem and leaf diagram?
a)
Nothing- it's all correct.
b)
The order.
c)
It's missing a key.
d)
The title.
29.

Tom asked people in a survey how much money they could find under their sofa cushions. The stem-and-leaf plot shows the amounts of money. What is the least amount of money a person said they could find?

a)

4 cents

b)

45 cents

c)

46 cents

d)

456 cents

30.

Which statement about the data is true?

a)

Two people each found 70 cents.

b)

Two people each found 7 cents.

c)

One person found 56 cents.

d)

Eight people found 37 cents.

31.

What is the median of the data shown?

a)

9

b)

9.5

c)

10

d)

There is no median

32.

What is the median of the data shown?

a)

81.5

b)

83

c)

80.3

d)

82

33.
What type of graph is this?
a)
Bar Graph
b)
Histogram
c)
Line Plot
34.
Which interval has 400 employees?
a)
33-43
b)
0-10
c)
77-87
d)
66-76
35.
Which interval has the greatest number of employees?
a)
11-21
b)
33-43
c)
77-87
d)
44-54
36.
How many employees have a salary less than $22,000?
a)
50
b)
350
c)
0
d)
10
37.
The graph shows the results of a survey to determine student's favorite pets. Why is this graph misleading?
a)
The slices are the wrong color
b)
The slices are not the correct size
c)
The percents do not add up to 100
d)
Not misleading
38.
What is misleading about this graph?
**choose the best answer
a)
Nothing is misleading about this graph.
b)
The democrats are too high.
c)
The y-axis does not start at zero, so it makes the democrats look much higher than the other two parties.
39.

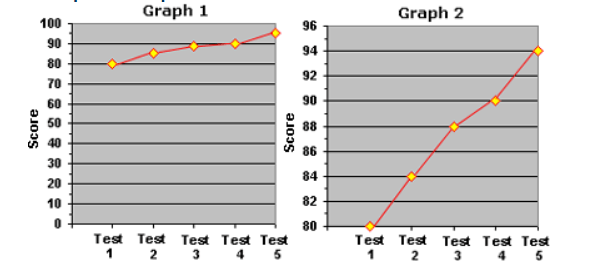
Alden wanted to impress his parents by showing the rapid increase in his score on 5 tests. Which graph should he use to impress them?

a)

Graph 1

b)

Graph 2

c)

Neither

d)

Both

40.

What is wrong with this graph?

a)

Not enough information.

b)

The basketball ticket prices in 2001 were approximately 2 times as much as 1991, yet the size of the basketballs are about 4 times as big.

c)

y axis scale is not uniform

41.

What type of shape distribution would you say this graph has?

a)

Right Skewed

b)

Approximately Symmetrical

c)

Left Skewed

d)

No skew

42.

What type of shape distribution would you say this graph has?

a)

Right Skewed

b)

Left Skewed

c)

Approximately Symmetrical

d)

Evenly spread out

43.

What is the best description of the given data?

a)

Mode = Median

b)

mean is lower than median

c)

mean is higher than median

d)

mean =median

44.
What is the shape of the data for Lucy's Steakhouse?
a)
Symmetrical
b)
Skewed Left
c)
Skewed Right
45.
Which of the following best describes the shape of the distribution?
a)
SKEWED LEFT
b)
SKEWED RIGHT
c)
UNIFORM
d)
SYMMETRICAL
46.

How would you describe this data?

a)

mean=median

b)

mean is higher than median

c)

mean is lower than median

d)

mode =median

47.
Which of the following lists all parts of the five number summary?
a)
Mean, Median, Mode, Range, and Total
b)
Minimum, Quartile 1, Median, Quartile 3, and Maximum 
c)
Smallest, Q1, Q2, Q3, and Q4
d)
Minimum, Maximum, Range, Mean, and Median
48.

Find the Q1 (median of the lower half) of the following numbers: 84, 88, 72, 74, 98, 16, 94 

a)
72
b)
88
c)
94
d)
There is no Lower Quartile.
49.

Find the Q3 (median of upper half) of the following numbers: 84, 88, 72, 74, 98, 16, 94 

a)
72
b)
88
c)
94
d)
There is no Upper Quartile.
50.

Find the Median (Q2) of the following numbers: 84, 88, 72, 74, 98, 16, 94 

a)
16
b)
98
c)
84
d)
There is no median.
51.
When finding median and the middle has two numbers instead of one, what do you do?
a)
Take the higher number
b)
Take the lower number
c)
Take both
d)
Take the average
52.
What data value is the upper quartile (Q3)?
a)
64
b)
62
c)
66
d)
58
53.
What is the median?
a)
35
b)
30
c)
25
d)
50
54.
50% of the Cruisers attended between 7 and 16 car shows.  True or False?
a)
True
b)
False
55.
Which city has a minimum value that is lower?

a)
Millersburg
b)
Arcandia
56.
Which car club has the higher median?
a)
Cruisers
b)
Car Hops
57.
What is the IQR of the Car Hops?
a)
4
b)
6
58.

The two measures of center we've study this unit are...

a)

Interquartile Range

b)

Mean Absolute Deviation

c)

Mean

d)

Median

e)

Standard Deviation

59.

Interquartile Range or IQR is a measure of variability and helps determine the spread of the data.

a)

True

b)

False

60.

If our data set is skewed to the right or left we would measure the center by calculating the...

a)

Mode

b)

Mean

c)

Median

d)

Range

61.

The mean gets pulled away from the center of data or the typical value when the data is skewed to the right or left.

a)

True

b)

False

62.

If we use the mean to measure the typical value or center of the data, we would use the _________ to measure the variability.

a)

IQR

b)

Median

c)

Mean

d)

Standard Deviation

63.

If we use the median to measure the typical value or center of the data, we would use the _________ to measure the variability.

a)

Mode

b)

MAD

c)

Standard Deviation

d)

IQR or Interquartile Range

64.

A histogram shows each value in a data set.

a)

True

b)

False

65.

A box plot divides the data into quarters or 25% increments.

a)

True

b)

False