
 Worksheets
Brechko Science
Total questions: 85
Worksheet time: 8hrs 34mins
Name
Class
Date
1.
What two measurements are necessary for calculating speed?
a)
Mass and time
b)
Temperature and mass
c)
Mass and distance
d)
Distance and time
2.
Can be measured in seconds (s)
a)
Distance
b)
Time
c)
Speed
d)
Acceleration
3.
Can be measured in meters per second (m/s)
a)
Distance
b)
Time
c)
Speed
d)
Acceleration
4.
Can be measured in meters (m)
a)
Distance
b)
Time
c)
Speed
d)
Acceleration
5.

What does this graph represent?
a)
Constant speed
b)
Acceleration
c)
Not moving
6.

What is happening at C?
a)
Stationary
b)
Accelerating
c)
Fast steady speed; moving away from the starting position
d)
Slower steady speed; moving away from the starting position
7.

What is happening at D?
a)
Stationary
b)
Accelerating
c)
Fast steady speed; moving away from the starting position
d)
Slower steady speed; moving away from the starting position
8.

What is happening at A?
a)
No motion
b)
Accelerating
c)
Slower steady speed; moving away from the starting position
d)
Steady speed; returning to start position
9.

What is happening at B?
a)
Stationary
b)
Accelerating
c)
Slower steady speed; moving away from the starting position
d)
Steady speed; returning to start position
10.

Which runner won the race?
a)
A
b)
B
c)
C
11.

Which runner had a head start?
a)
A
b)
B
c)
C
12.

At what time did runner A pass runner B?
a)
0 seconds
b)
1 second
c)
2 seconds
d)
3 seconds
13.
What is the formula to calculate speed?
a)
v = t/d
b)
v = d/t
c)
v = d x t
d)
v = t x d
14.
What is the speed of an object that travels 60.0 meters in 4.0 seconds?
a)
240 m/s
b)
15 m/s
c)
0.067 m/s
d)
15 mph
15.

What is this graph representing?
a)
Constant Speed
b)
Acceleration (speeding up)
c)
Deceleration (slowing down)
d)
No motion
16.

In which of the following graphs (click the image) are both runners moving at the same speed (note that graph c is the bottom right graph, and graph d is the bottom left graph)?
a)
Graph A
b)
Graph B
c)
Graph C
d)
Graph D
17.

Which of the graphs shows that one of runners started 10 yards further ahead of the other (note that graph c is the bottom left and graph d is the bottom right)?
a)
Graph A
b)
Graph B
c)
Graph C
d)
Graph D
18.

The distance-time graphs shown represent the motion of a car. Which of the following graphs represents the car at constant speed moving in the positive direction?
a)
graph A
b)
graph B
c)
graph C
d)
graph D
19.

At 60 seconds, how far had this object traveled?
a)
0 m
b)
10 m
c)
20 m
d)
40 m
20.

How long did it take this object to travel back to its reference/starting point?
a)
20 s
b)
30 s
c)
60 s
d)
100 s
21.

How long did it take this object to travel 10 m?
a)
0 s
b)
10 s
c)
15 s
d)
20 s
22.

How many times does this object STOP moving?
a)
None
b)
Once
c)
Twice
d)
Three times
23.

What does this graph represent?
a)
Constant speed
b)
Acceleration
c)
Not moving
24.

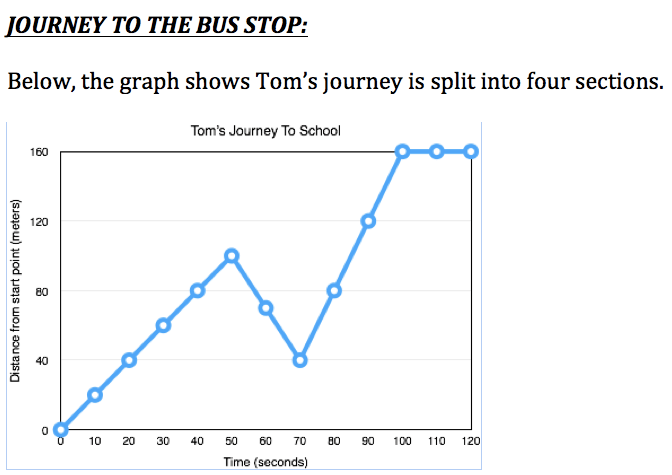
Every morning, Tom walks along a straight road from his home to the bus stop. Below, is a graph representing Tom’s trip to school.
What is the distance covered through the first segment if the first segment is between 0 seconds and 50 seconds?
What is the distance covered through the first segment if the first segment is between 0 seconds and 50 seconds?
a)
100 meters
b)
80 meters
c)
60 meters
d)
120 meters
25.
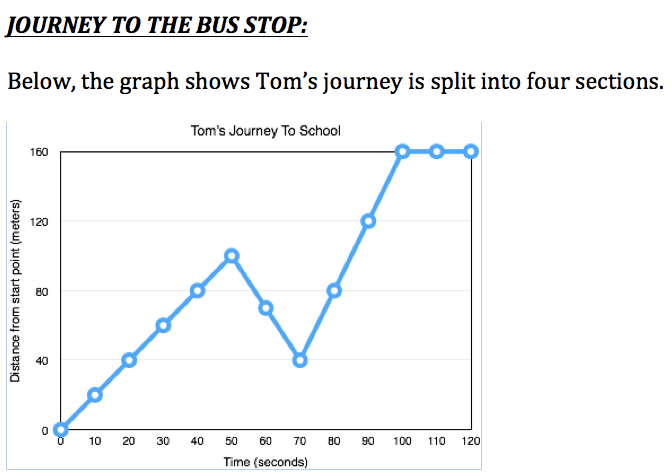
Every morning, Tom walks along a straight road from his home to the bus stop. Below, is a graph representing Tom’s trip to school.
What is the average speed of Tom’s journey throughout the first segment, which is between 0 seconds, and 50 seconds?
What is the average speed of Tom’s journey throughout the first segment, which is between 0 seconds, and 50 seconds?
a)
3 m/s
b)
5 m/s
c)
2 m/s
d)
2 miles per second
26.
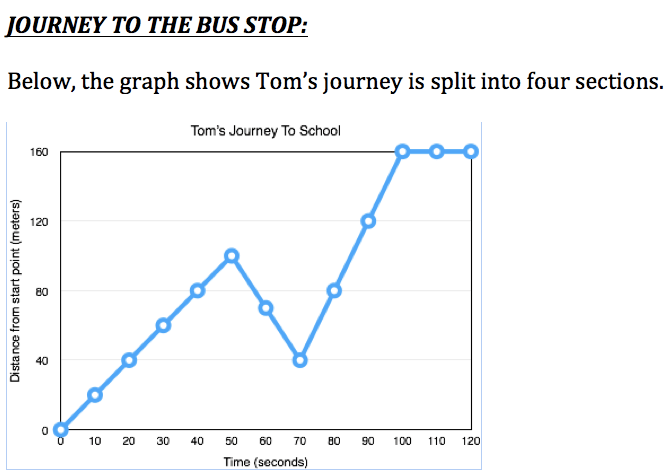
Every morning, Tom walks along a straight road from his home to the bus stop. Below, is a graph representing Tom’s trip to school.
Was Tom walking, jogging, or sprinting during segment 1, which is between 0 seconds and 50 seconds?
Was Tom walking, jogging, or sprinting during segment 1, which is between 0 seconds and 50 seconds?
a)
walking
b)
jogging
c)
sprinting
27.
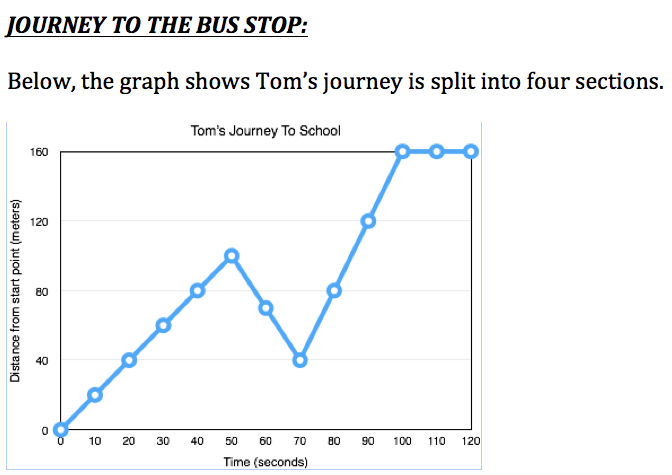
Every morning, Tom walks along a straight road from his home to the bus stop. Below, is a graph representing Tom’s trip to school.
What is the distance covered through the second segment, which is between 50 seconds, and 70 seconds?
What is the distance covered through the second segment, which is between 50 seconds, and 70 seconds?
a)
40 meters
b)
60 meters
c)
80 meters
d)
20 meters
28.
. Every morning, Tom walks along a straight road from his home to the bus stop. Below, is a graph representing Tom’s trip to school.What is the average speed of Tom’s Journey throughout the second segment, which is between 50 seconds and 70 seconds?
a)
5 m/s
b)
4 m/s
c)
3 m/s
d)
2 m/s
29.

During the second segment, which is between 50 seconds and 70 seconds, which direction is Tom moving?
a)
Tom was moving back towards his house
b)
Tom was moving down a hill
c)
Tom was moving towards the bus stop
d)
Tom was not moving
30.
On a distance vs time graph, a straight line ALWAYS indicates that an object’s speed is _____.
a)
constant
b)
zero
c)
increasing
d)
decreasing
31.
The slope of a distance vs. time graph shows an object's
a)
frame of reference
b)
speed
c)
acceleration
d)
favorite food
32.
The speed at any single instant of time?
a)
speed
b)
average speed
c)
instantaneous speed
d)
velocity
33.
When something has speed in a certain direction it is called ___________.
a)
motion
b)
position
c)
velocity
d)
speed
34.
100 km/hr is an example of
a)
speed
b)
velocity
35.
2,560 m/s west is an example of
a)
speed
b)
velocity
36.
What is speed?
a)
how far you go
b)
how much distance is covered over a period of time
c)
how fast you accelerate
d)
the change in the location of a object
37.
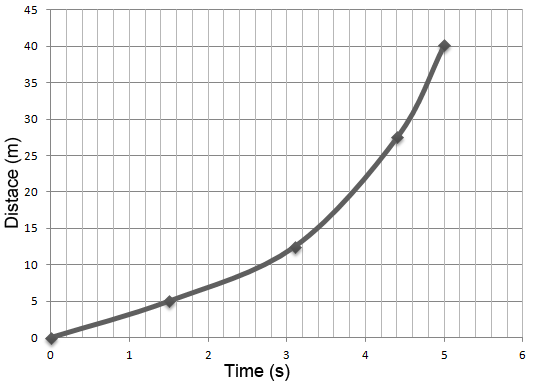
What is the average speed of this object?
a)
8 s/m
b)
0 m/s
c)
8 m/s
d)
0 s/m
38.
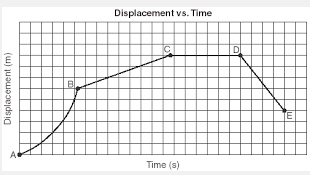
In which segment does the object have the fastest constant speed?
a)
A to B
b)
B to C
c)
C to D
d)
D to E
39.
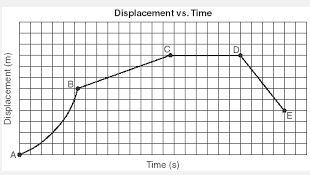
In which segment is the object returning to the reference point?
a)
A to B
b)
B to C
c)
C to D
d)
D to E
40.
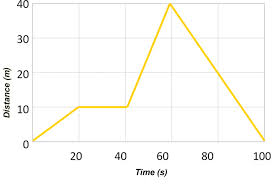
At 60 seconds, how far had this object traveled?
a)
0 m
b)
10 m
c)
20 m
d)
40 m
41.

What is happening in the graph from point A to B?
a)
The object is moving away from the reference point at a constant speed.
b)
The object is moving toward the reference point at a constant speed
c)
The object is NOT moving
d)
The object is speeding up
42.

What is this graph showing?
a)
Constant Speed
b)
Acceleration (speeding up)
c)
Deceleration (slowing down)
d)
No motion
43.

What is this graph showing?
a)
Constant Speed
b)
Acceleration (speeding up)
c)
Deceleration (slowing down)
d)
No motion
44.

A golf ball accelerates off a tee at 15 m/s2, changing its velocity from 0 m/s to 50.0 m/s down the fairway. How long did it take the golf ball to accelerate?
a)
750 seconds
b)
35 seconds
c)
0.3 seconds
d)
3.3 seconds
45.

A ball of clay is thrown at a wall at a velocity of 28.0 m/s. After it hits the wall, it takes 0.020 s to stop. What is the acceleration of the clay when it hits the wall?
a)
1400 m/s2
b)
-1400 m/s2
c)
0.56 m/s2
d)
-0.56 m/s2
46.

A roller coasters accelerates from an initial velocity of of 6.0 m/s to a final velocity of 70.0 m/s over 4.0 seconds. What is the roller coaster's acceleration?
a)
24 m/s2
b)
18 m/s2
c)
16 m/s2
d)
16 m/s
47.
A dog runs with an initial speed of 7.5 m/s on a waxed floor. It slides to a stop in 15 seconds. What is the acceleration?
a)
-7.5 m/s
b)
0.50 m/s2
c)
-0.50 m/s2
d)
7.5 mi//hr
48.

How fast is the car traveling at 30 seconds?
a)
5 m/s
b)
10 m/s
c)
20 m/s
d)
30 m/s
49.
A car starts from rest at a stop light and reaches 20.0 m/s in 3.5 s. Determine the acceleration of the car.
a)
2.2 m/s2
b)
7.0 m/s2
c)
5.7 m/s2
d)
70 m/s2
50.

The picture of the position vs. time graph shows an object that is...
a)
accelerating/speeding up
b)
moving at a constant speed
c)
not moving
d)
accelerating/slowing down.
51.
Acceleration is defined as the CHANGE in
a)
time it takes for one place to move to another place.
b)
velocity of an object.
c)
distance divided by the time interval
d)
velocity divided by the time interval
52.
Why does a car accelerate as it rounds a corner at a constant speed?
a)
Its direction changes
b)
It doesn't
c)
It slows down
d)
Its speeds up
53.
Acceleration only takes place when things speed up.
a)
True
b)
False
54.
In the following cases, determine where the car has no acceleration?
a)
A car shortly after a stoplight turns green.
b)
A car approaching a red light
c)
A car with the cruise control set at 80 km/h
d)
A car turning a curve at a constant speed
55.

Which graph shows the object standing still?
a)
A
b)
B
c)
C
d)
D
56.

Which graph represents zero acceleration (constant velocity)?
a)
A
b)
B
c)
C
d)
D
57.

Which graph demonstrates the greatest positive speed?
a)
A
b)
B
c)
C
d)
D
58.

Which graph represents the greatest acceleration?
a)
A
b)
B
c)
C
d)
D
59.
Changes in our speed, direction, or both are called _________.
a)
gravity
b)
changes
c)
acceleration
d)
deceleration
60.
When are you undergoing an acceleration in a car?
a)
speed up
b)
slow down
c)
make turns
d)
All of the above
61.
The SI unit for acceleration is
a)
mph
b)
ft/sec2
c)
m/s2
62.
A ball rolling up the hill has a positive velocity, what is the sign of the ball's velocity going down the hill?
a)
Positive
b)
Negative
63.
Velocity describes both speed and _____________
a)
time
b)
direction
c)
momentum
d)
acceleration
64.
In order to determine speed, you must know ____________
a)
time
b)
distance
c)
both time and distance
d)
neither time nor distance
65.
Total distance divided by total time is
a)
average speed
b)
constant speed
c)
instantaneous speed
d)
acceleration
66.

Rihanna cycles at an average speed of 8.0 km/hr. How far has she traveled if she cycles for 4.0 hours?
a)
55 km
b)
32 km
c)
43 km
d)
32 miles
67.

The Beatles travels 100 km in 5 hr Find their average speed in km/hr
a)
5 km/hr
b)
10 km/hr
c)
50 km/hr
d)
20 km/hr
68.
When an object's position is changing, that means it is in ________.
a)
motion
b)
speed
c)
direction
d)
position
69.

Joanna drives for 400 km at an average speed of 80 km/h. How long was her journey?
a)
Joanna's journey was 5 hrs long
b)
Joanna's journey was 10 hrs long
c)
Joanna's journey was 20 hrs long
d)
Joanna's journey was 15 hrs long
70.

What is the objects average speed from 0-20 seconds?
a)
0.5m/s
b)
10m/s
c)
2m/s
d)
10m
71.
A place or object used for comparison to determine if another object is in motion is called a
a)
comparison point
b)
reference point
c)
point of view
d)
motion detector
72.
A distance vs time graph shows an object's
a)
frame of reference
b)
speed
c)
acceleration
d)
favorite food
73.
The SI unit for length or distance is
a)
foot (ft)
b)
inch (in)
c)
mile (mi)
d)
meter (m)
74.
A flat (horizontal) line on a distance vs. time graph means the object's speed is
a)
increasing
b)
decreasing
c)
zero
75.
A ceiling fan rotating in a circle at a constant speed of 1 m/s is accelerating. True or False?
a)
True
b)
False
76.
On a distance vs time graph, the steeper the slope _____
a)
the slower the speed
b)
the faster the speed
c)
less acceleration
d)
greater acceleration
77.
The rate at which velocity changes is called
a)
motion
b)
average speed
c)
instantaneous speed
d)
acceleration
78.
Which of these is an example of negative acceleration, or deceleration?
a)
a bird taking off for flight
b)
a roller coaster moving down a steep hill
c)
a car approaching a red light
d)
an airplane following a straight flight path
79.

This is a velocity vs time graph. What is the object doing in segment C?
a)
Positive acceleration
b)
Negative acceleration
c)
Constant Velocity
d)
Not moving
80.

This is a velocity vs time graph. What is the object doing in segment B?
a)
Positive acceleration
b)
Negative acceleration
c)
Constant velocity
d)
Not moving
81.

What is happening in this graph from point B to C?
a)
The object is going down a hill.
b)
The object is returning to its starting location.
c)
The object is slowing down.
d)
The object is staying still.
82.

What is happening in the graph from point O to A?
a)
The object is moving SLOWLY
b)
The object is moving FAST
c)
The object is NOT moving
d)
The object is accelerating
83.

What is happening in this graph from point A to B?
a)
The object is accelerating.
b)
The object is not moving.
c)
The object is decelerating.
d)
The object is moving at a constant speed.
84.

What is happening between 4 and 5 seconds?
a)
The object is slowing down in a negative direction.
b)
The object is slowing down in a positive direction.
c)
The object is slowing down in a negative direction.
d)
The object is speeding up in a negative direction.
85.
In a distance versus time graph where does the time go?
a)
y axis
b)
x axis
100 %

