
NEW
Font size
 Worksheets
Motion Graph Review
Total questions: 67
Worksheet time: 1hrs 9mins




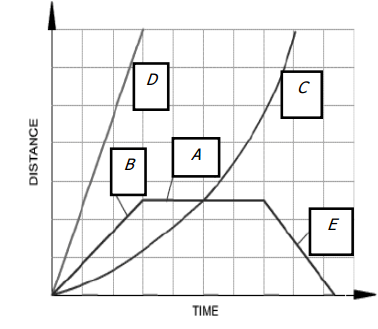


- What is the distance covered through the second segment, which is between 50 seconds, and 70 seconds?
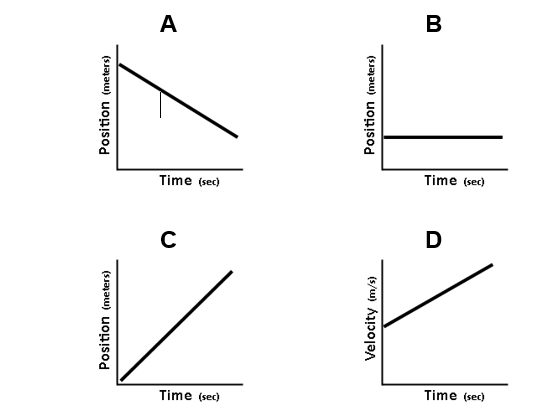
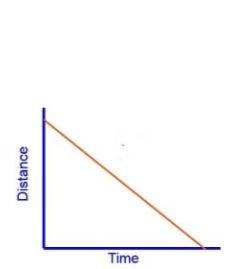
What is this line of this graph showing?
moving away from starting point at a constant speed
moving back towards the starting point at a constant speed
acceleration (getting faster)
deceleration (getting slower)
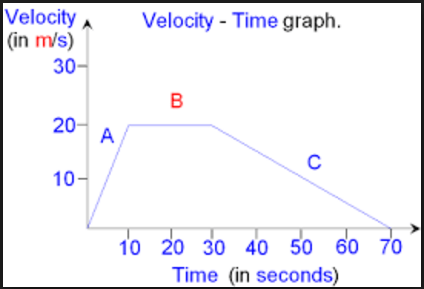
This is a velocity-time graph. What is the object doing in segment A?
Speeding up
Slowing down
Constant Velocity
Not moving

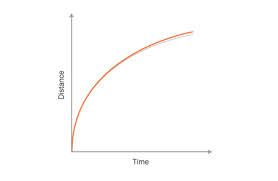


What is occurring on this graph?
Negative acceleration
moving at a constant speed in the positive direction
positive acceleration
negative net force
An object is __________ when its distance from a reference point is changing.
in motion
speeding
not moving
at rest
________ can be calculated if you know the distance an object traveled and the unit of time. (distance ÷ time)
Speed
Motion
Opportunity
Velocity
What is the formula for speed?
speed = distance · time
speed = distance ÷ time
speed = time - distance
speed = distance + time


The graph represents the motion of a car over 10 seconds. What is the average speed of the car during the first 4 seconds? (Hint: distance 10 meters and time 4 seconds)
.4 m/s
2.5 m/s
10 m/s
40 m/s
What is this line of this graph showing?
moving away from starting point at a constant speed
moving back towards the starting point at a constant speed
acceleration (getting faster)
deceleration (getting slower)

What happened during E to F point?
not moving
increasing speed at a constant rate
constant speed
acceleration

The graph shows
positive velocity that's getting faster
negative velocity that's getting faster
negative velocity that's getting slower
positive velocity that's getting slower

The graph shows
positive velocity that's getting faster
negative velocity that's getting faster
negative velocity that's getting slower
positive velocity that's getting slower

The graph shows
positive velocity that's getting faster
negative velocity that's getting faster
negative velocity that's getting slower
positive velocity that's getting slower

The graph shows
positive velocity that's getting faster
negative velocity that's getting faster
negative velocity that's getting slower
positive velocity that's getting slower

The graph shows
positive velocity that's getting faster
negative velocity that's getting faster
negative velocity that's getting slower
positive velocity that's getting slower

The graph shows
positive velocity that's getting faster
negative velocity that's getting faster
negative velocity that's getting slower
positive velocity that's getting slower

Select the description of motion from A - B.
Slowing down away from the origin
Speeding up away from the origin
Constant velocity away from the origin
Constant velocity towards the origin

What segment of the graph shows no motion, or standing still?
A - B
B - C
C - D
None

Describe the motion from B - C.
Standing still
Constant velocity of 60 m/min
Constant velocity of 0 m/min
Accelerating

Describe motion of C - D.
Constant velocity away from the origin
Slowing down away from the origin
Slowing down away from the origin and then slowing down towards the origin
Slowing down away from the origin and then speeding up towards from the origin

These toy cars are designed to keep a constant speed. Are the toy cars in the picture accelerating during a race on this track? If so, why?
Yes, they are accelerating every time they go around a turn. A change in direction is acceleration.
Yes, they are accelerating because the speed will change.
No, their speed did not change so they did not accelerate.
No, their direction changed which is not an acceleration.
A car travels 300 km in 6 hours. What is the average speed of the car?
0.02 km/hr
1,800 km/hr
50 km/hr
50 km
A storm is moving toward your house at a speed of 20 km/hr. It is now 60 km away from your house. What time will the storm reach your house?
0.3 hours
1200 hours
3 km
3 hours
A hot air balloon traveled 2.5 hours at a speed of 450 km/hr. What distance did it travel?
87 m/s
1300 m/s
180 km
1,125 km

What happened during point D to point E?
increasing speed
decreasing speed
moving at a constant speed
not moving
What happened during point B to point C?
increasing speed
decreasing speed
moving at a constant speed
not moving

What is happening between point B to point D
increasing speed
decreasing speed
constant speed
no motion

What is the net force acting on the rope?
20N to the left
1,080N to the right
0N
20 N to the right

What can you determine using the information in the table?
The velocity of each car
The acceleration of each car
The average speed of each car
The direction traveled by each car
The geese fly 22 mph south when they migrate for winter.
Speed
Velocity
Acceleration
If a cyclist travels 120 km in 4 hours, what is their average speed?
30 km/hr
480 km/hr
96 km/hr
24 km/hr
A train moves with a speed of 80 km/hr for 0.5 hours. How far does it travel in that time?
40 km
160 km
80 km
20 km
What does a flat section on a distance-time graph indicate?
Increasing speed
Decreasing speed
Constant speed
No motion
If a bird flies 150 km west in 3 hours, what is its average speed?
50 km/hr
100 km/hr
45 km/hr
30 km/hr

What is the average speed between point C and point D
10
20
8.33
0
What is the average speed between point B and point C
10
20
8.33
0
What is the average speed between point A and point B
10
20
8.33
0
What is the average speed for the entire trip
10
20
8.33
0

All vehicles are moving at 70 km/hr. Which vehicle has a changing velocity?
G
H
J
X

The table shows information about a student training for the track team. If the student had the same average speed in both trials, how many km did the student run in trial 2?
.16
6.25
16
62.5

