
 Worksheets
QUIZ for MS
Total questions: 20
Worksheet time: 30mins
What is the difference between parametric and non parametric tests?
Why does normality really matter? when it somes to data analysis could you explain why?
Draw what a kurtosis looks like?

In how many ways we can do the normality assessment in SPSS?
1
2
3
4
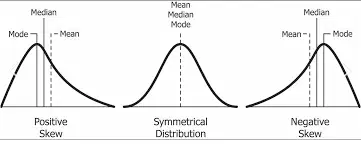
Considering this photo, The following statements are true
Shapiro–Wilk Test
Recommended for small samples (n < 50).
Recommended for small samples (n > 50).
Recommended for small samples (n = 50).
Recommended for small samples (n = 50).
What is the primary assumption of parametric tests regarding data distribution?
Data must be uniformly distributed.
Data must be skewed.
Data can be any distribution.
Data must be normally distributed.
Which of the following tests is commonly used to assess normality?
Kolmogorov-Smirnov Test
ANOVA Test
Chi-Square Test
T-Test
What does a p-value less than 0.05 typically indicate in hypothesis testing?
Evidence in favor of the null hypothesis.
Weak evidence against the null hypothesis.
No evidence against the null hypothesis.
Strong evidence against the null hypothesis.
Write down the steps of SPSS Procedure for Normality Testing
If skewness and kurtosis z-values fall between −1.96 and +1.96, distribution is

Briefly explain this figure
Which of the following is a characteristic of non-parametric tests?
They assume equal variances across groups.
They are always more powerful than parametric tests.
They can be used with ordinal data.
They require normally distributed data.
What does a high kurtosis value indicate about a distribution?
The distribution is flat and wide.
The distribution has heavy tails and a sharp peak.
The distribution is uniform.
The distribution is symmetrical.
The homogenity of variance is measured by
Outliers can ( ) a parameter estimate
(a)
Define outliers
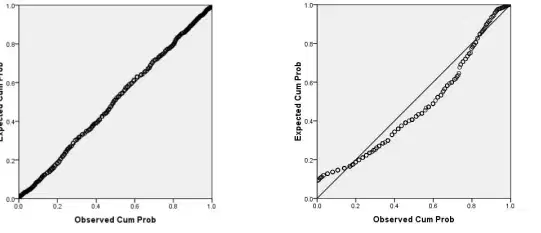
Which of the both resembles a Normal Distribution?
Which of the following is NOT a non parametric test?
Explain the importance of data cleaning and reducing bias. Alos explain the importance of reducing bias and the methods used.

