


10th Grade Phase Diagram Quizzes
Test your understanding of phase diagrams with this comprehensive Grade 10 chemistry quiz designed to assess your knowledge of solid, liquid, and gas transitions. Practice interpreting phase diagram components, critical points, and state changes with instant feedback to strengthen your grasp of this fundamental chemistry concept.

10 questions
PHASE DIAGRAM

Quiz
•
10th Grade

21 questions
PHASE DIAGRAMS
Quiz
•
10th Grade

25 questions
Phase Diagram
Quiz
•
10th Grade
15 questions
Phase Diagram
Quiz
•
10th Grade

15 questions
Phase Diagram
Quiz
•
10th Grade

15 questions
Phase Diagram
Quiz
•
10th Grade
20 questions
Phase Diagrams Practice
Quiz
•
10th Grade
16 questions
Unit 3A Phase diagram & Molar Enthalpy problems
Quiz
•
10th Grade
31 questions
Vapor pressure and Phase diagrams
Quiz
•
10th Grade
13 questions
Intermolecular Forces and Phase Diagrams
Quiz
•
10th Grade
10 questions
Types of phase diagram
Quiz
•
9th - 12th Grade
14 questions
Phase Diagrams
Quiz
•
9th - 12th Grade
Browse by grade
Explore 10th Grade Phase Diagram Quizzes
Phase diagrams represent a fundamental concept in Grade 10 chemistry that illustrates the relationships between different states of matter under varying temperature and pressure conditions. Wayground's comprehensive collection of phase diagram quizzes provides students with targeted assessment opportunities to master this complex topic through interactive practice questions that test their understanding of phase boundaries, triple points, and critical points. These carefully designed quizzes offer immediate feedback to help students identify areas where they need additional study while reinforcing their comprehension of how substances transition between solid, liquid, and gas phases under different environmental conditions. Wayground's platform supports chemistry educators with access to millions of teacher-created quiz resources specifically focused on phase diagrams and related thermodynamic concepts. The robust search and filtering capabilities allow teachers to quickly locate assessments that align with curriculum standards and match their students' specific learning needs. Teachers can customize existing quizzes or create new ones using the platform's differentiation tools, ensuring that both struggling learners and advanced students receive appropriate challenges. The flexible digital delivery format enables seamless integration into classroom instruction, homework assignments, and review sessions, making it an invaluable resource for lesson planning, targeted remediation, and skill reinforcement throughout the chemistry curriculum.
FAQs
How do I teach students to read a phase diagram?
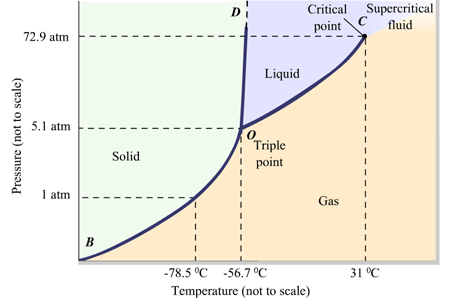
Start by orienting students to the axes — temperature on the x-axis and pressure on the y-axis — before introducing the regions representing solid, liquid, and gas phases. Walk students through identifying the triple point, where all three phases coexist, and the critical point, beyond which liquid and gas phases become indistinguishable. Annotating a diagram together as a class before moving to independent practice helps students build the visual literacy needed to interpret phase boundaries and transition curves accurately.
What are common mistakes students make when interpreting phase diagrams?
Students frequently confuse the direction of phase transitions, assuming that increasing temperature always moves a substance from solid to gas without recognizing the role pressure plays. Another common error is misidentifying the triple point as the melting point, rather than understanding it as the unique condition where all three phases are in equilibrium. Students also struggle to read vapor pressure curves accurately, often misinterpreting which side of a boundary represents which phase.
What practice problems are most effective for reinforcing phase diagram concepts?
Problems that require students to trace a path across a phase diagram — for example, starting at a given temperature and pressure and then changing one variable — are highly effective because they force active engagement with phase boundaries rather than passive recognition. Questions that ask students to compare water's phase diagram to that of carbon dioxide, particularly around the solid-liquid boundary slope, help deepen understanding of how molecular properties influence phase behavior. Including problems on vapor pressure curves and the conditions required to reach the critical point rounds out comprehensive phase diagram practice.
How can I differentiate phase diagram instruction for students at different skill levels?
For students who are still developing graph-reading skills, begin with simplified diagrams that label only one or two features, such as the triple point or a single phase boundary, before introducing the full complexity of a standard phase diagram. More advanced students can be challenged with problems involving substances like carbon dioxide or helium, whose phase diagrams differ meaningfully from water's, requiring deeper analysis of thermodynamic principles. On Wayground, teachers can filter quizzes by difficulty and apply accommodations such as reduced answer choices or read-aloud support for individual students who need additional scaffolding.
How do I use Wayground's phase diagram quizzes in my classroom?
Wayground's phase diagram quizzes are available as printable PDFs for traditional classroom use and in digital formats for technology-integrated learning environments, making them suitable for in-class practice, homework, or independent study. Teachers can also host digital quizzes as a quiz directly on Wayground, allowing for real-time student interaction and streamlined assessment. Each quiz includes a detailed answer key, supporting self-paced learning and reducing teacher grading time.
How do phase diagrams connect to real-world chemistry applications?
Phase diagrams have direct applications in fields like materials science, food preservation, and chemical engineering, where controlling temperature and pressure determines the physical state of a substance. The phase diagram of water, for example, explains why pressure cookers raise the boiling point of water and why ice can melt under pressure — phenomena students can connect to everyday experience. Grounding phase diagram instruction in these real-world contexts increases student engagement and helps learners see the relevance of thermodynamic principles beyond the classroom.

Accessibility
Features
Wayground Super
School & District
Wayground for Business
Create a quiz
Create a presentation
Wayground AI
Subjects
Mathematics
Social Studies
Science
Physics
Chemistry
Biology
About
Our Story
Wayground Blog
Media Kit
Careers
Support
F.A.Q.
Help & Support
Privacy Policy
Terms of Service
Teacher Resources
2026 Wayground


Get our app

