
20 Q
6th - 8th
10 Q
8th
14 Q
8th
10 Q
8th
10 Q
8th
10 Q
6th - 8th
20 Q
6th - Uni
20 Q
7th - 10th
21 Q
7th - 8th
20 Q
6th - 8th
22 Q
7th - 9th
10 Q
8th
10 Q
6th - 8th
22 Q
8th
16 Q
6th - 8th
10 Q
8th

6 Q
8th
16 Q
6th - 8th
12 Q
6th - 9th
20 Q
6th - Uni
18 Q
8th - Uni
15 Q
6th - 8th
20 Q
6th - 8th
13 Q
6th - 8th
Explore Other Subject Worksheets for year 8
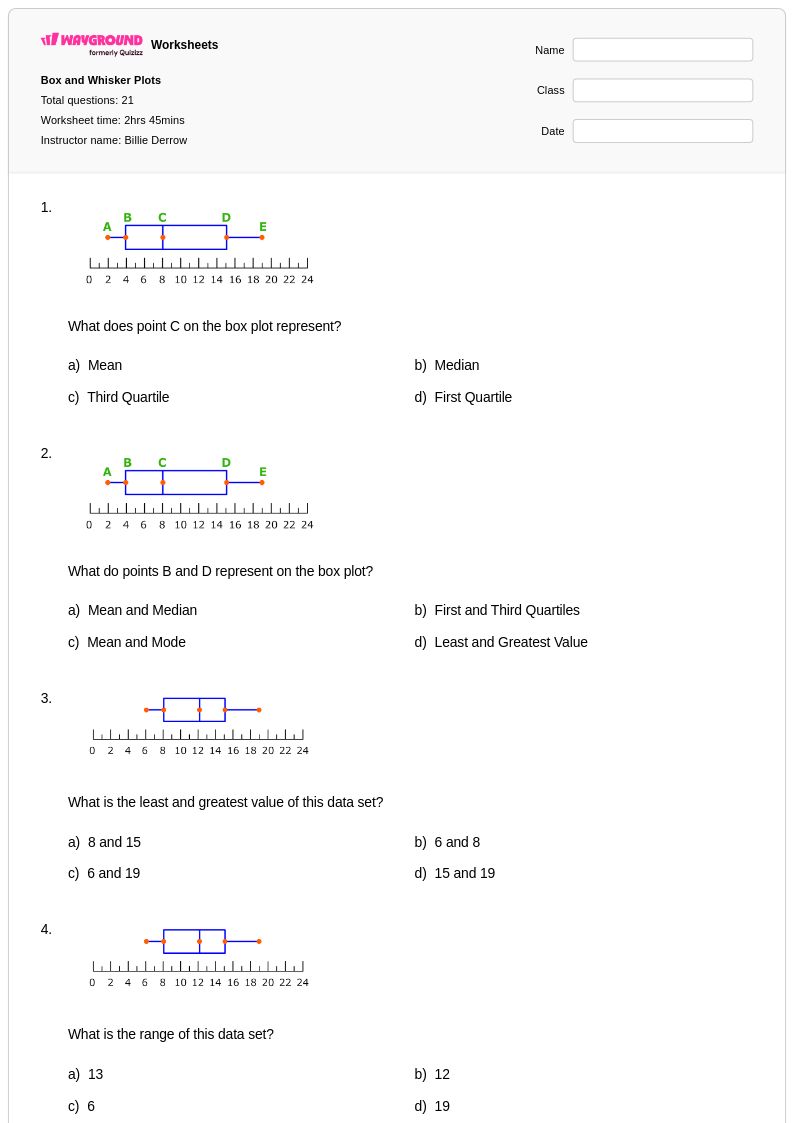
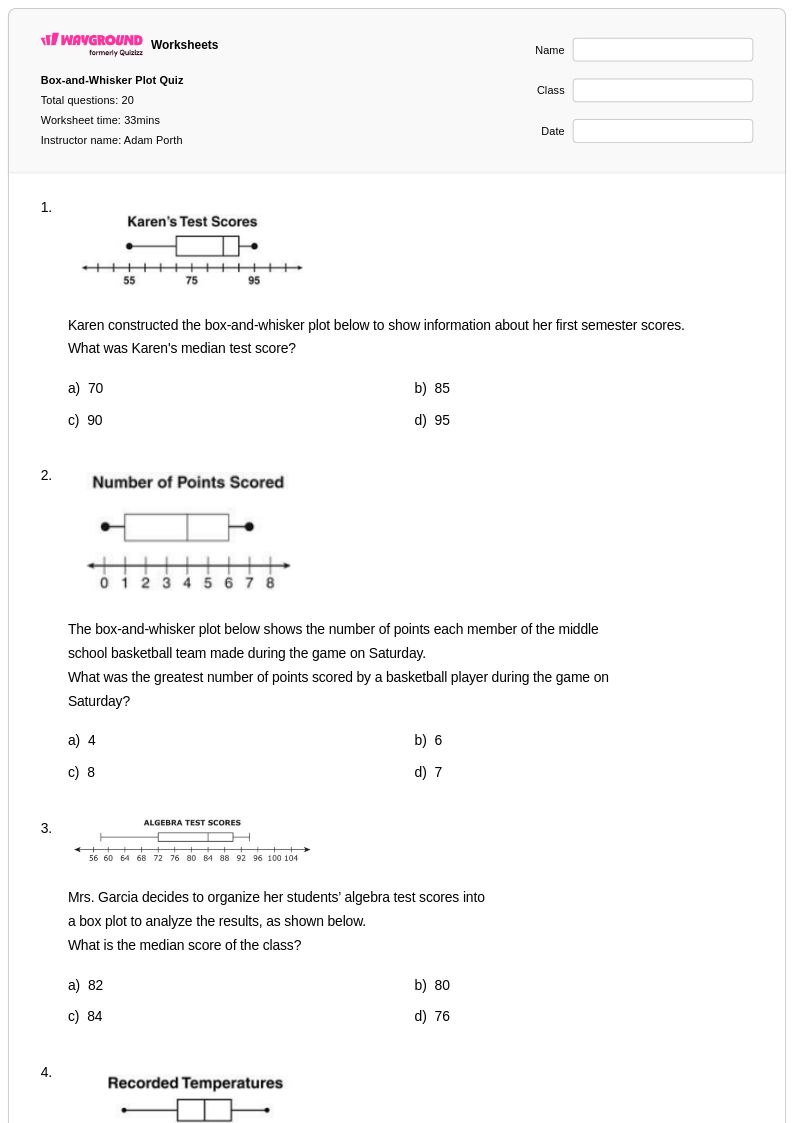
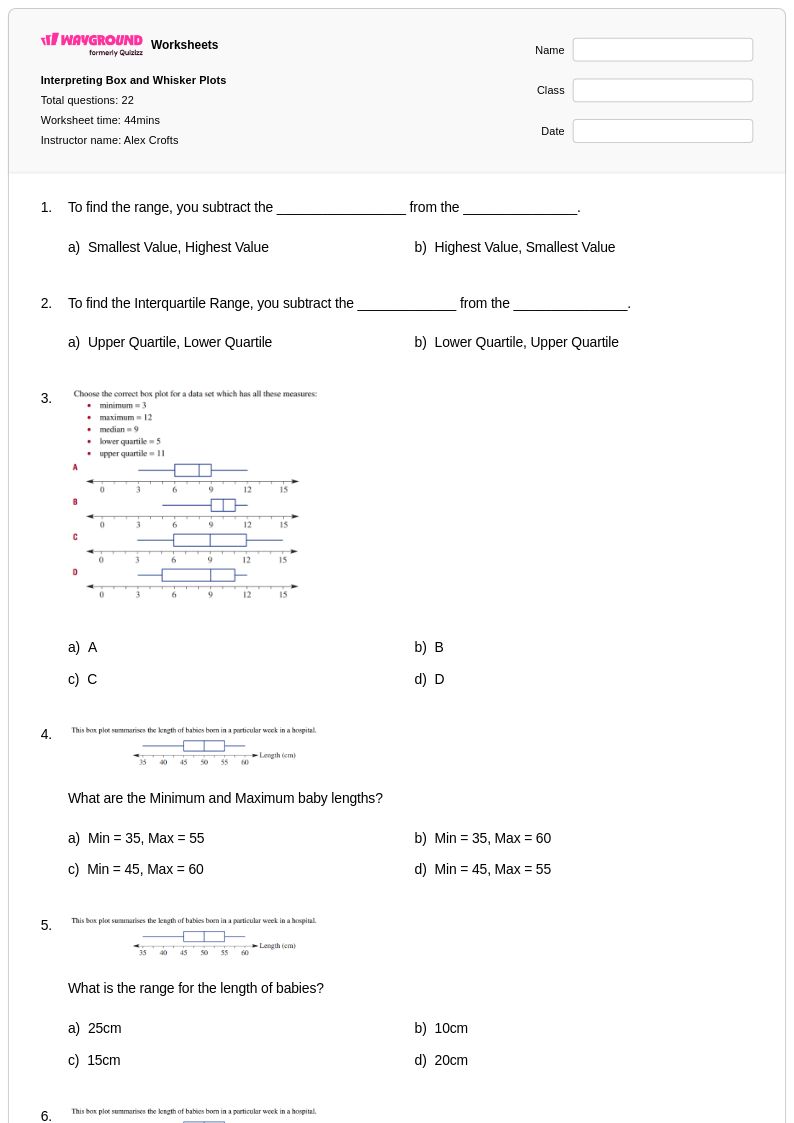
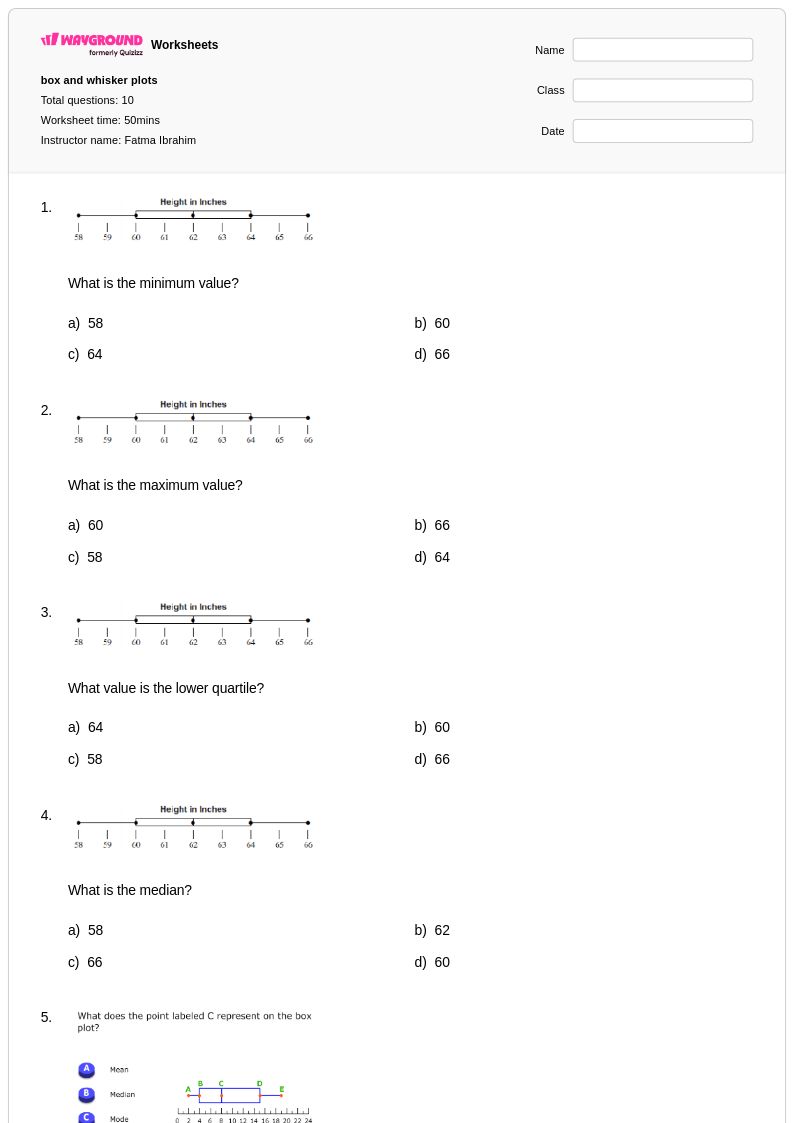
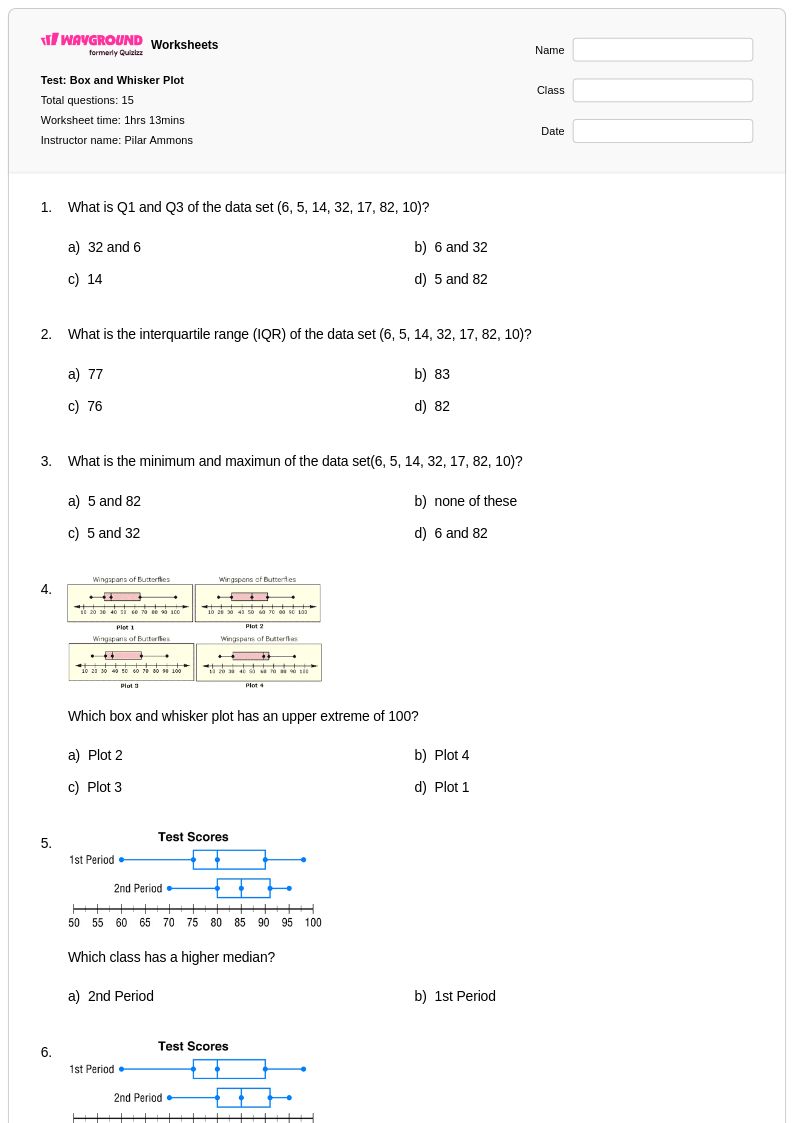
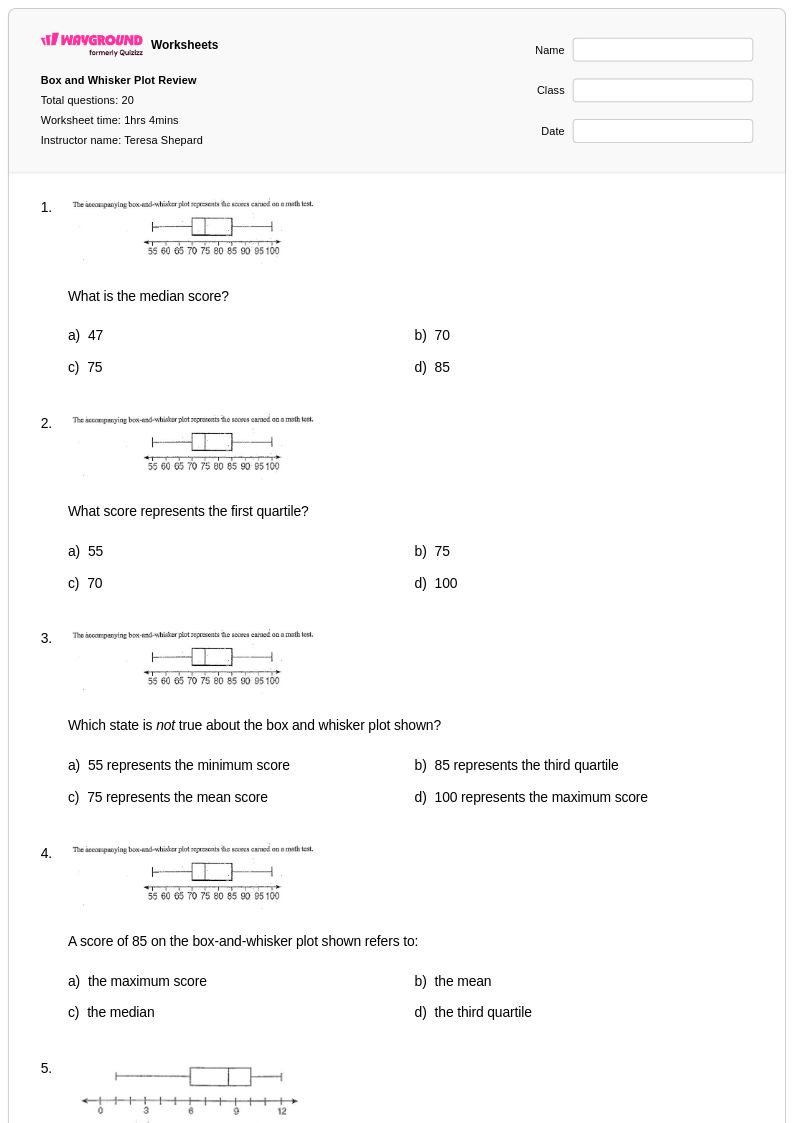
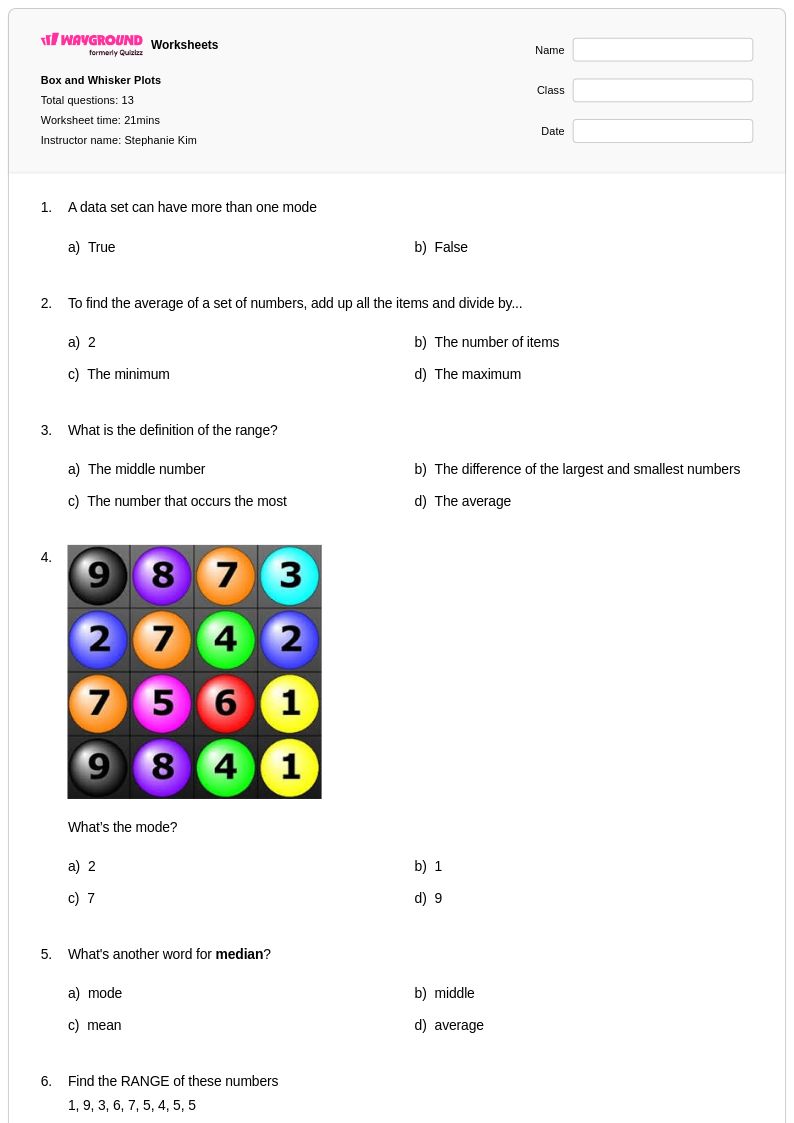
Explore printable Box and Whisker Plot worksheets for Year 8
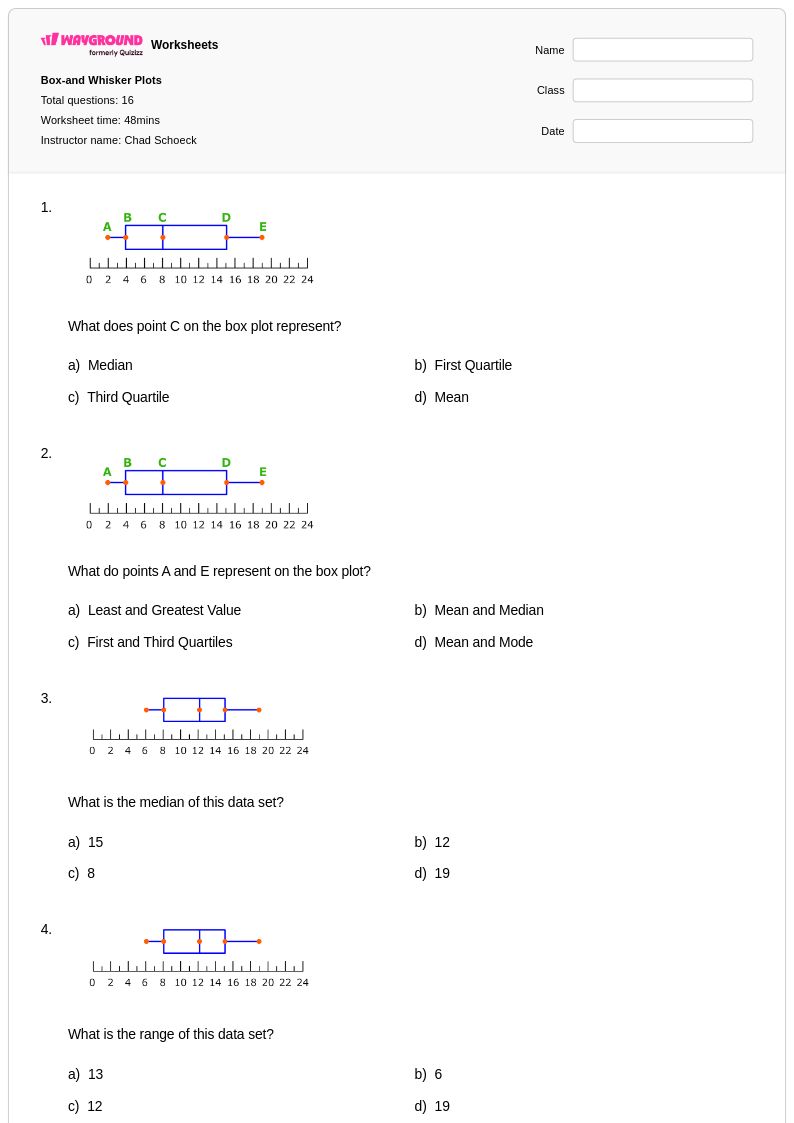
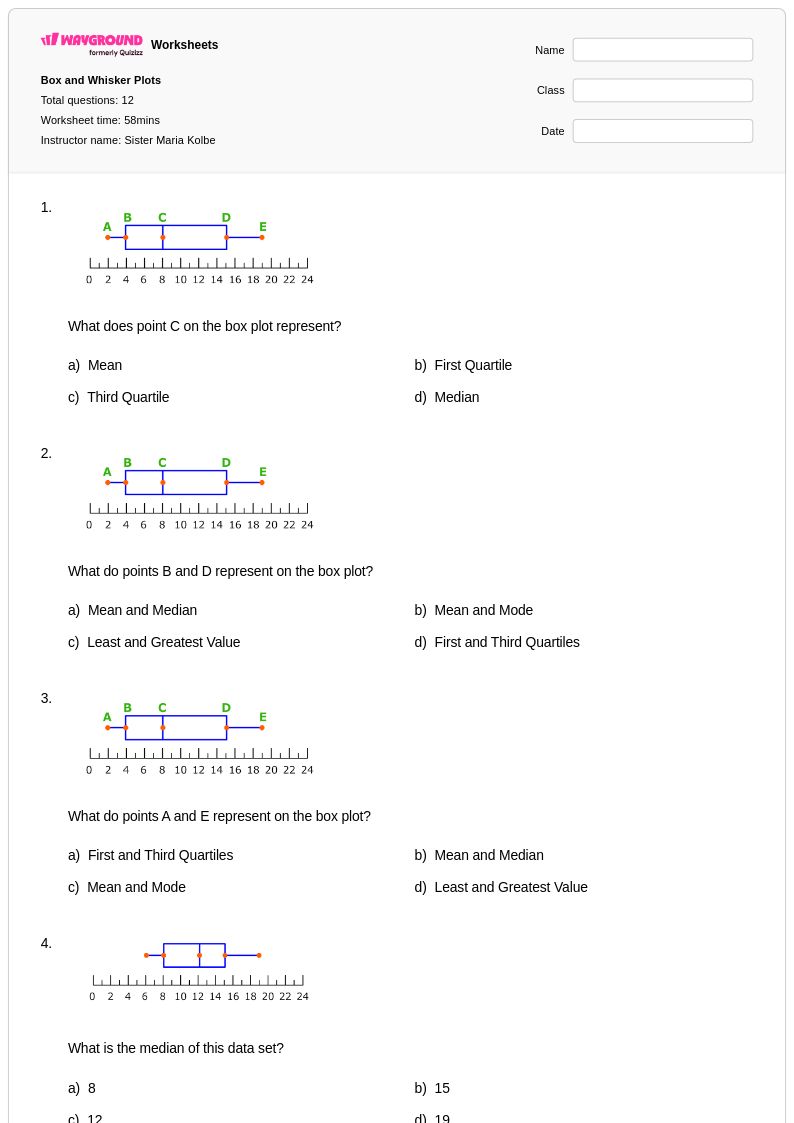
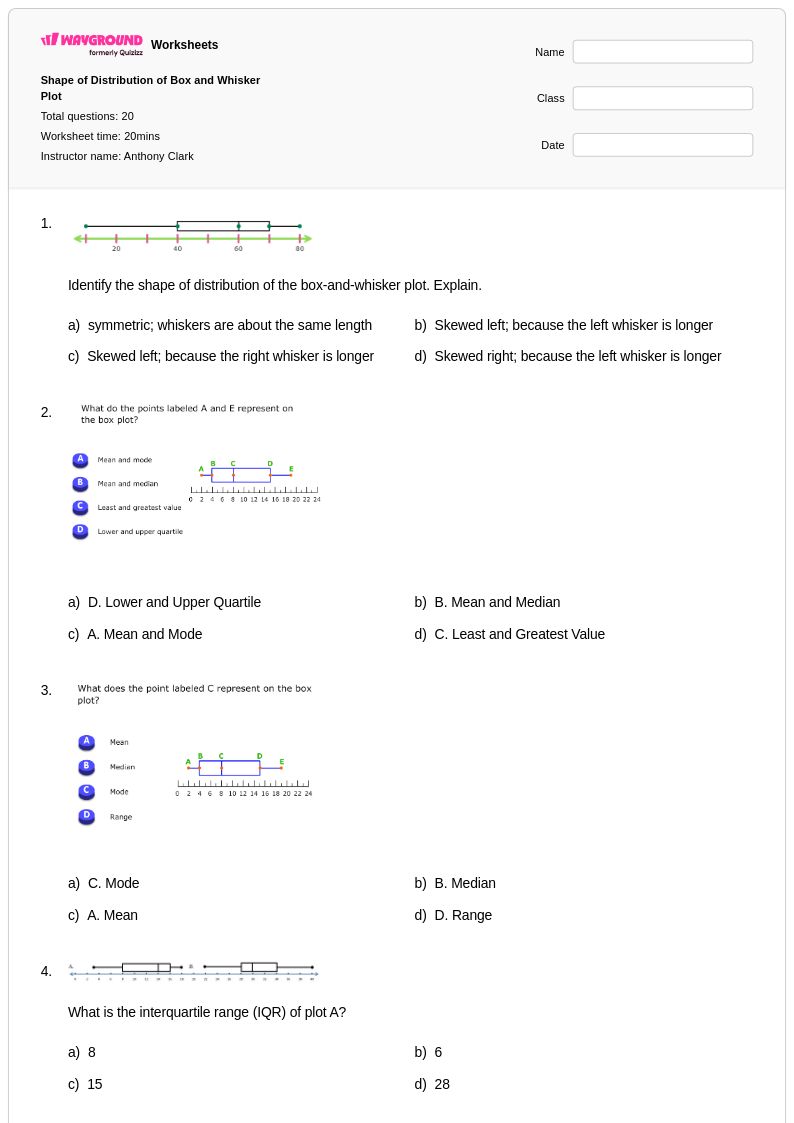
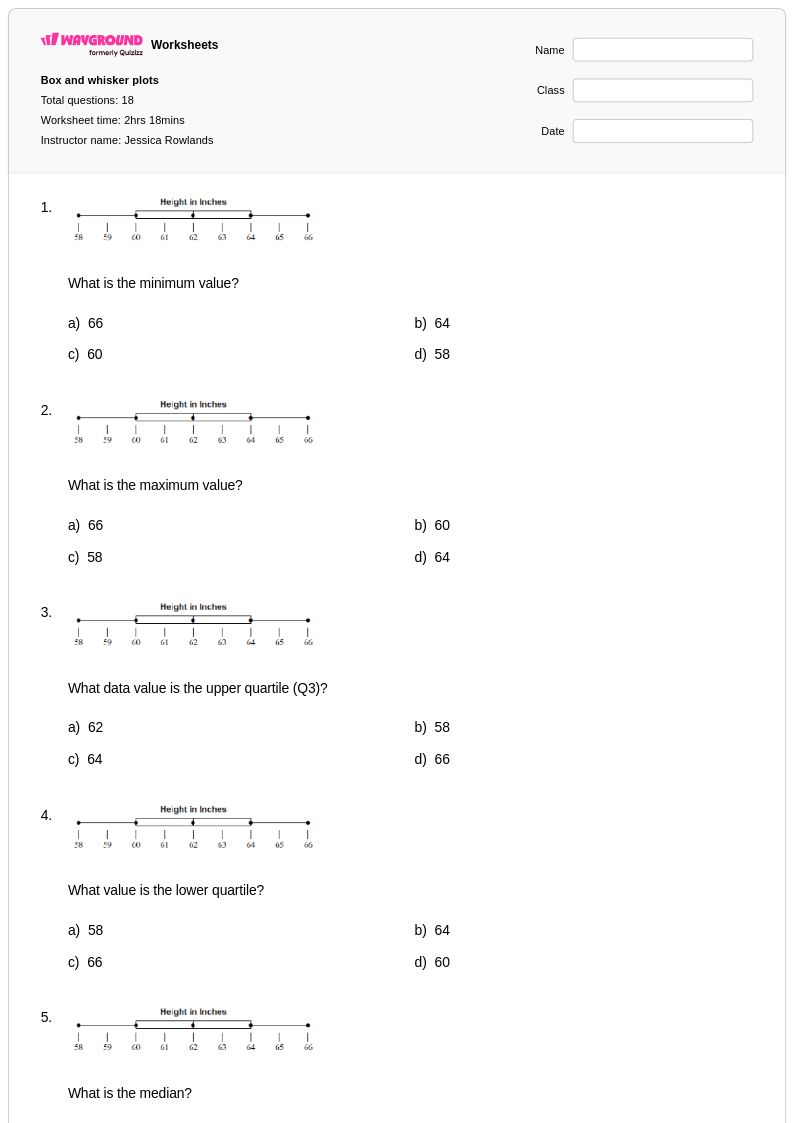
Year 8 box and whisker plot worksheets available through Wayground (formerly Quizizz) provide comprehensive practice in creating, interpreting, and analyzing these essential statistical displays. These carefully crafted resources strengthen students' ability to identify quartiles, calculate the interquartile range, recognize outliers, and draw meaningful conclusions from data distributions. The worksheets feature diverse practice problems that guide eighth graders through the step-by-step process of constructing box plots from raw data sets, while also developing their skills in comparing multiple data sets using side-by-side box and whisker displays. Each worksheet includes a detailed answer key to support independent learning and self-assessment, with free printables available in convenient pdf format for seamless classroom integration.
Wayground (formerly Quizizz) empowers mathematics educators with millions of teacher-created box and whisker plot resources specifically designed for Year 8 instruction. The platform's robust search and filtering capabilities allow teachers to quickly locate worksheets that align with specific curriculum standards and match their students' varying ability levels. These differentiation tools enable educators to customize practice problems for remediation, grade-level reinforcement, or enrichment activities, ensuring every student receives appropriate challenge and support. The flexible collection offers both printable pdf versions for traditional paper-based practice and digital formats for interactive learning experiences, making lesson planning efficient while providing multiple pathways for students to master the interpretation of quartiles, medians, and data spread through box and whisker plot analysis.