
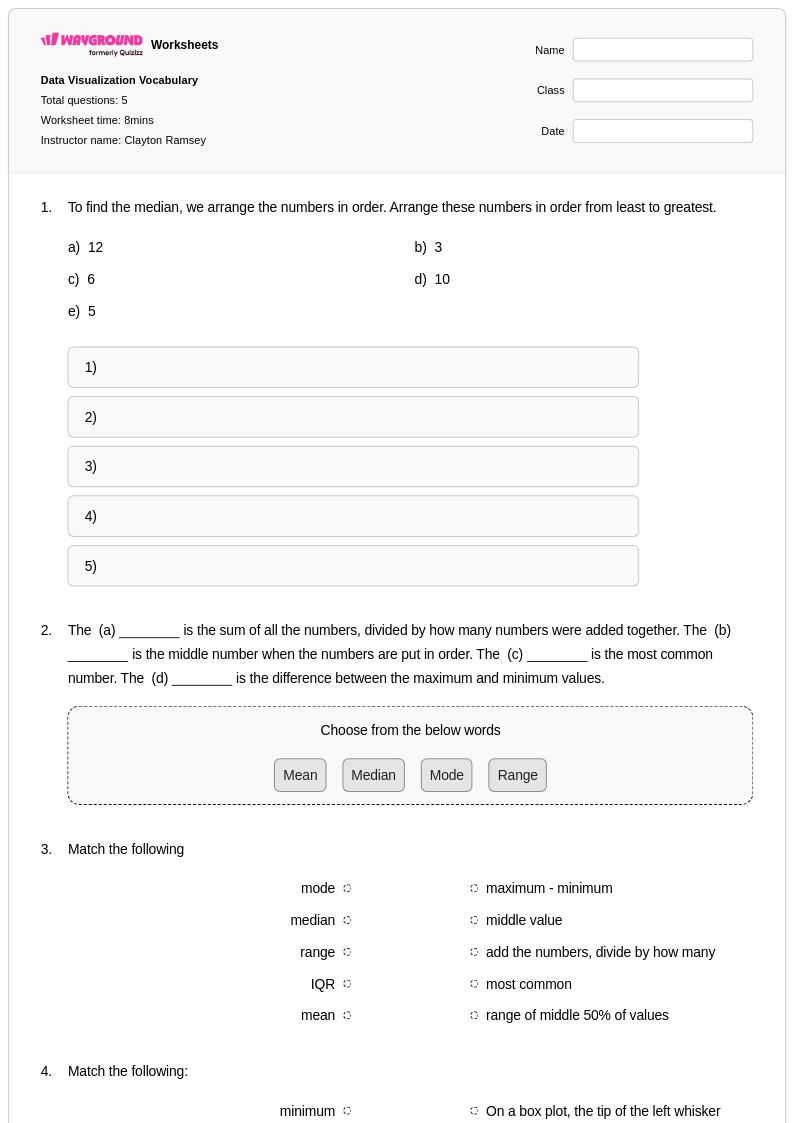
5 Hỏi
8th
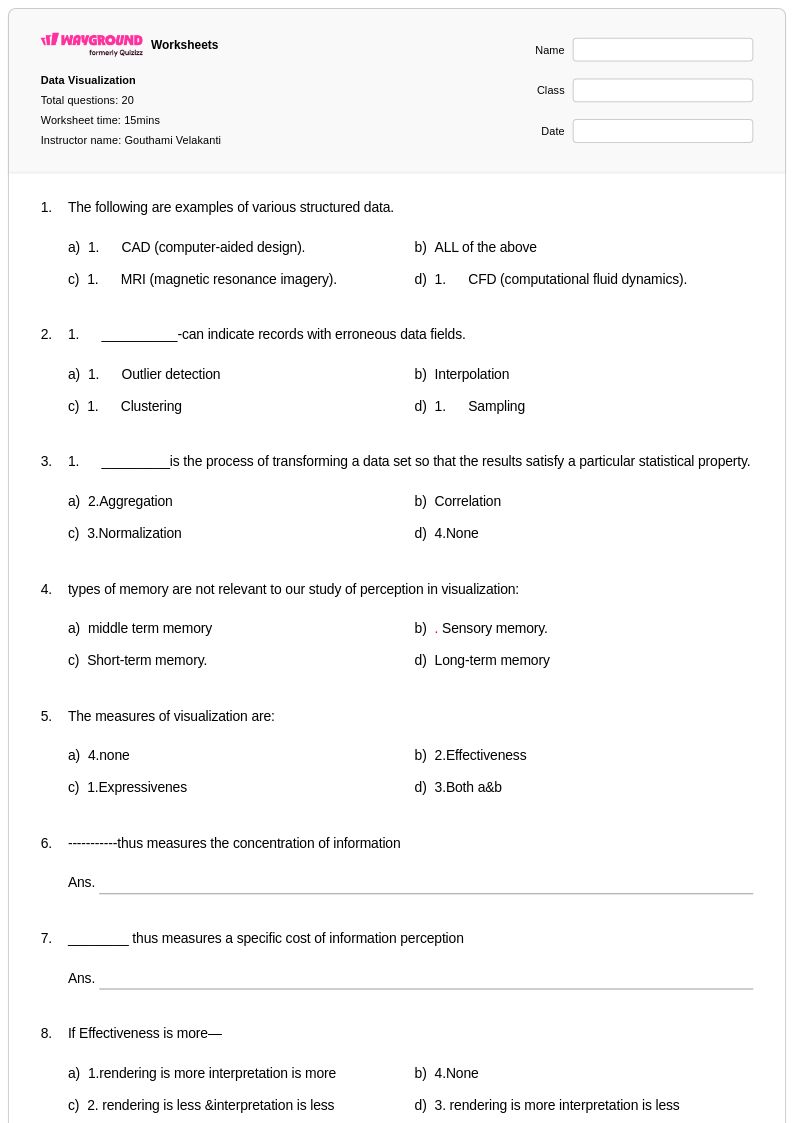
20 Hỏi
8th
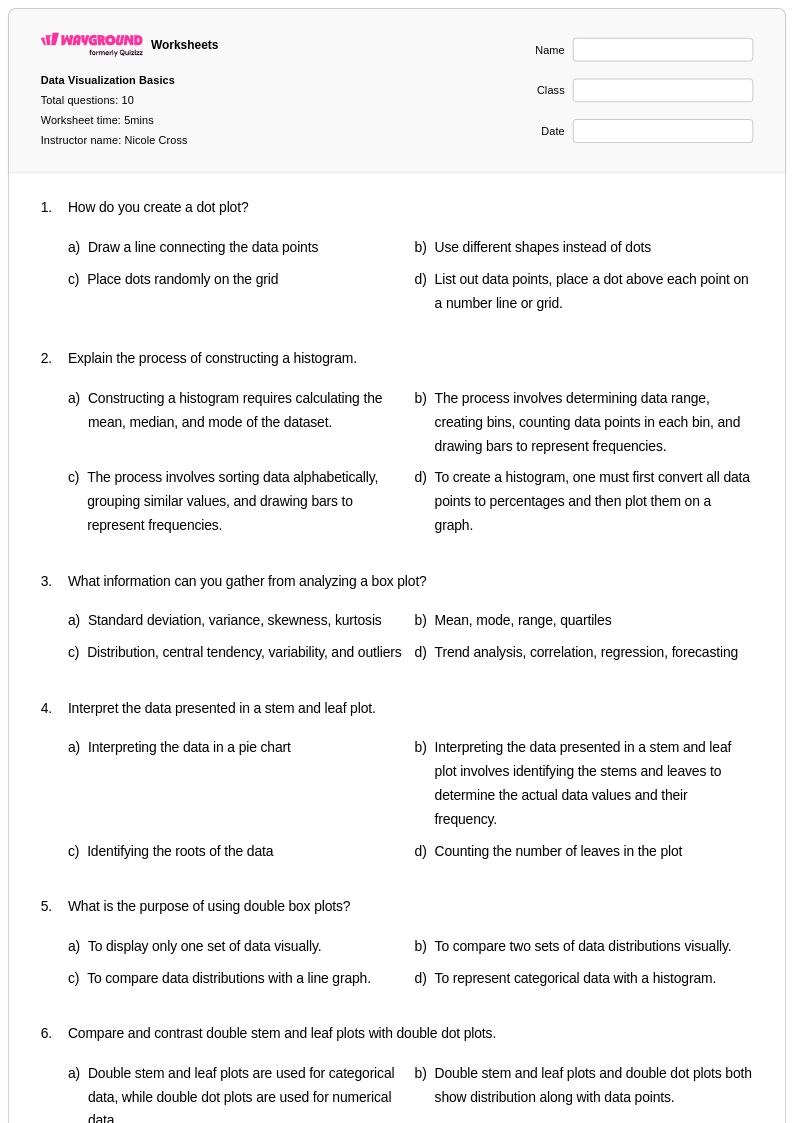
10 Hỏi
8th
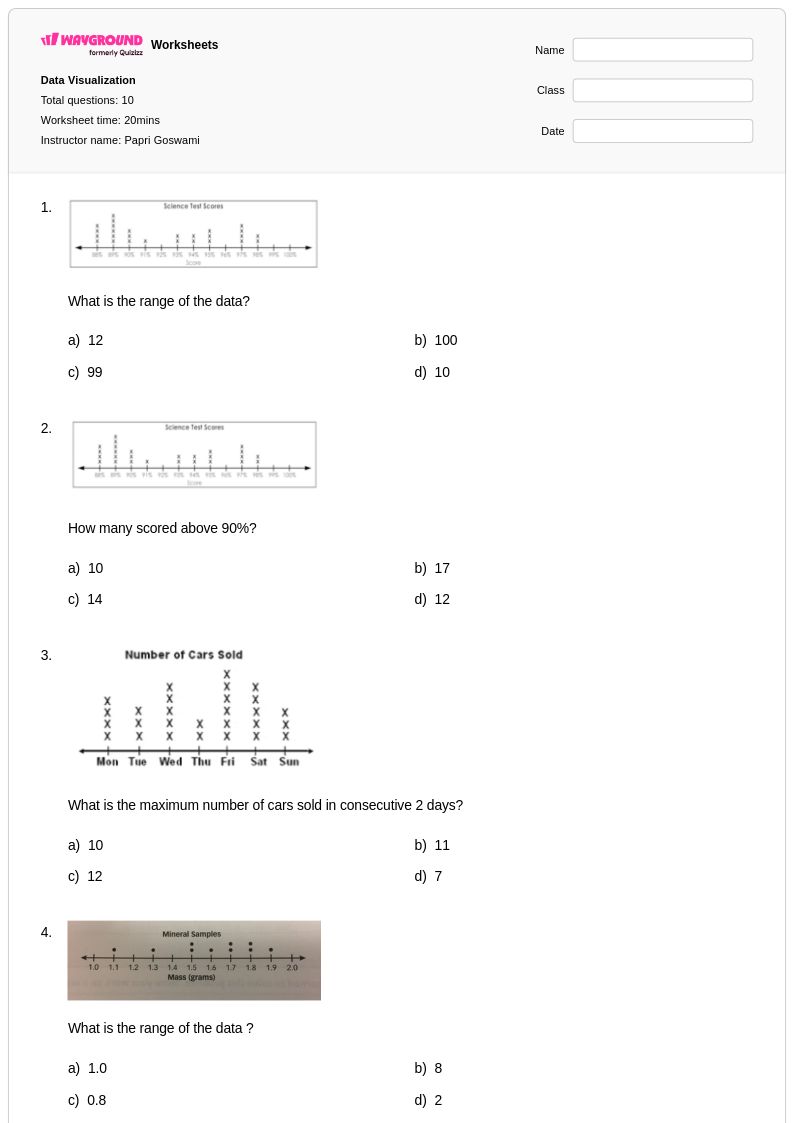
10 Hỏi
7th - 9th
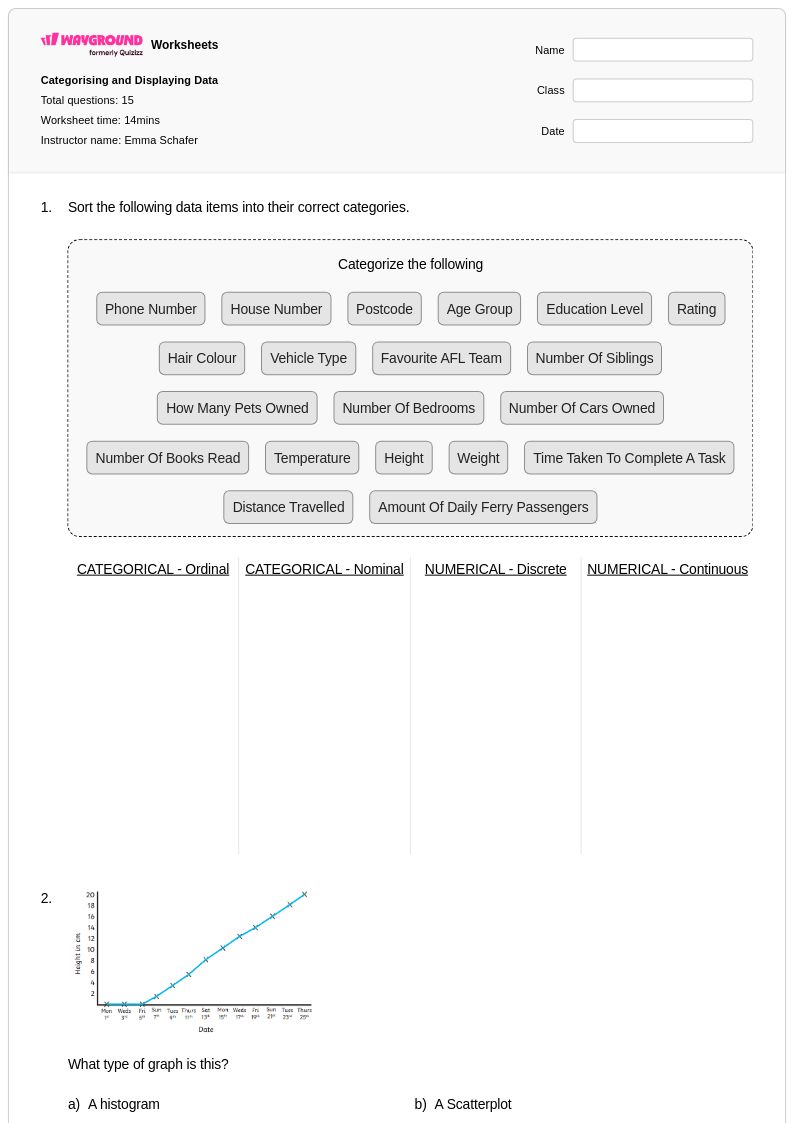
15 Hỏi
8th
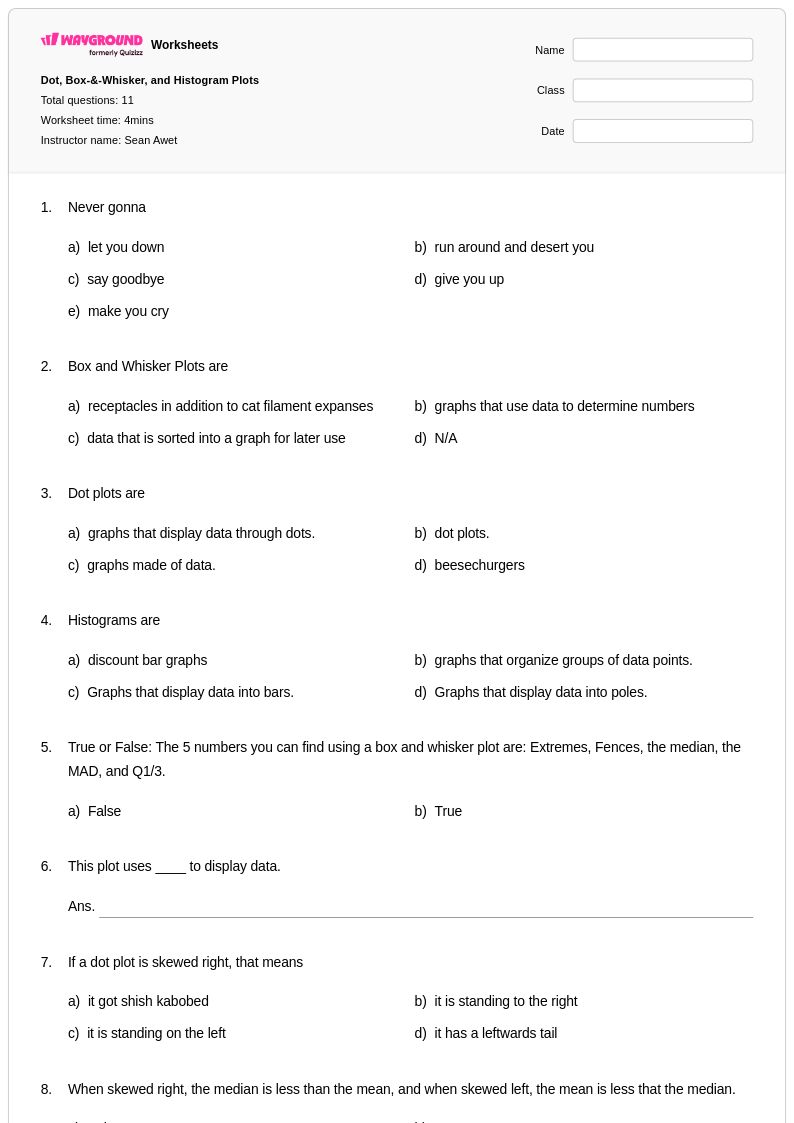
11 Hỏi
8th
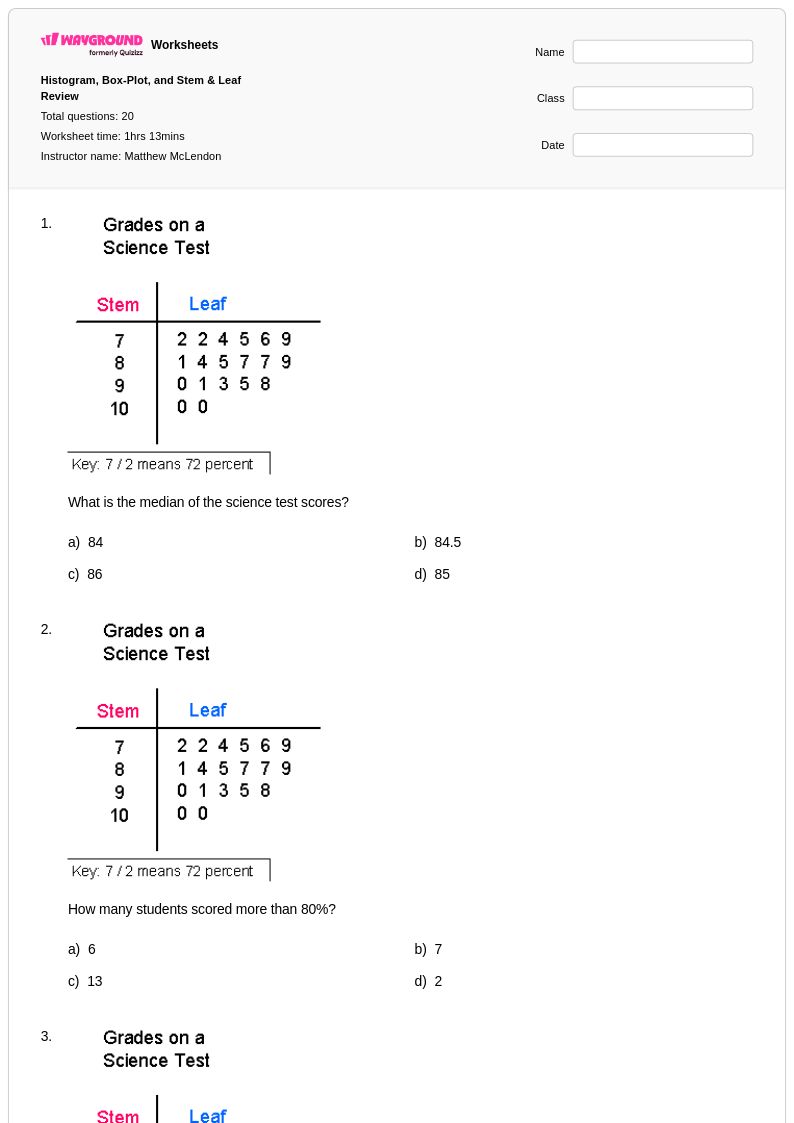
20 Hỏi
8th
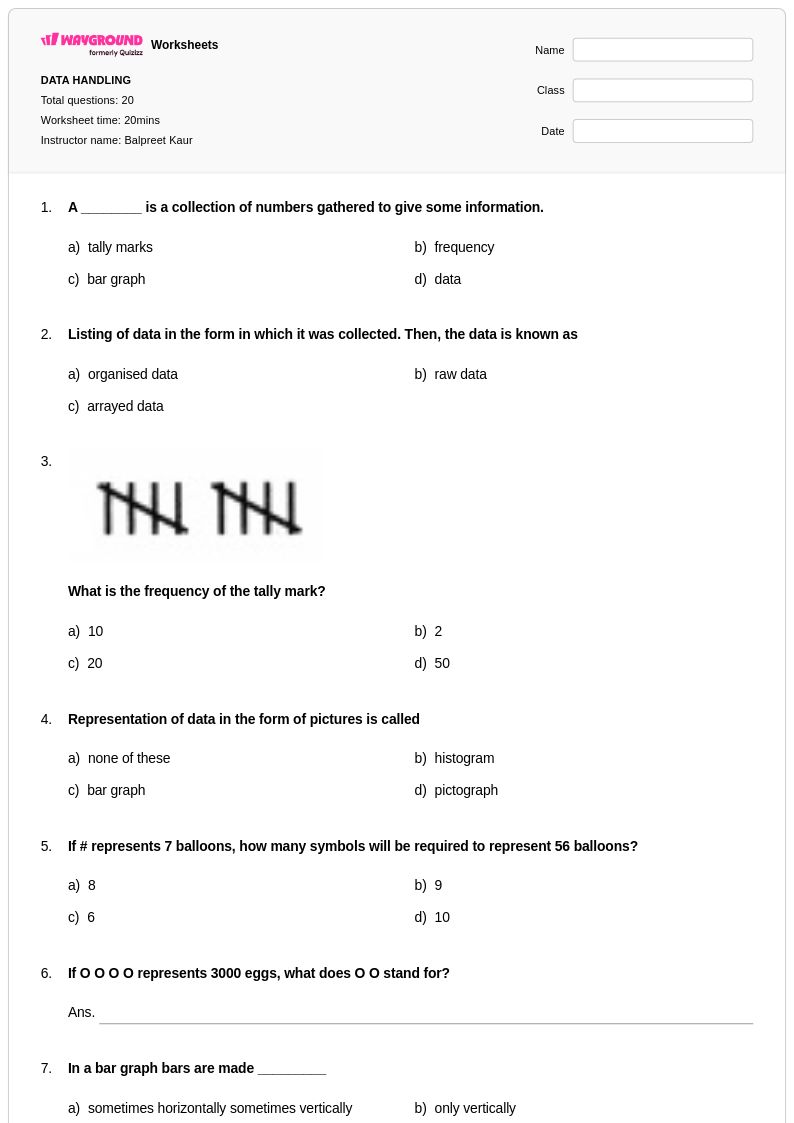
20 Hỏi
6th - 8th
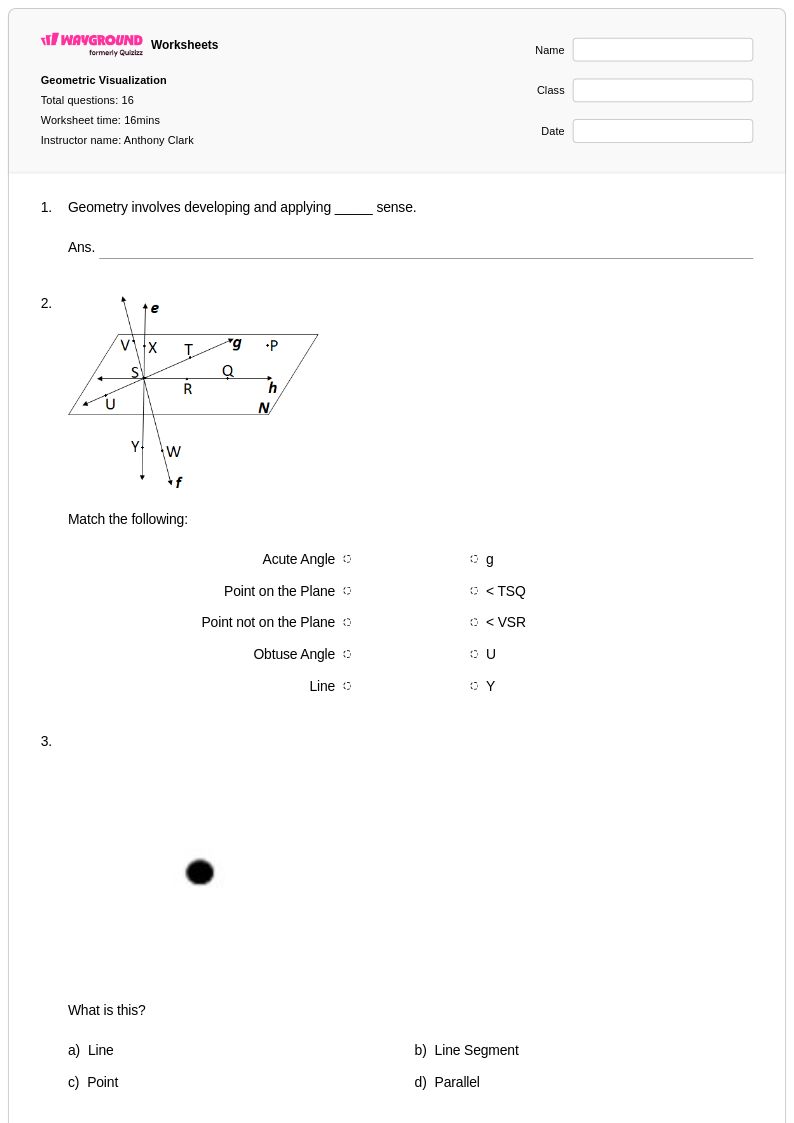
16 Hỏi
5th - Uni
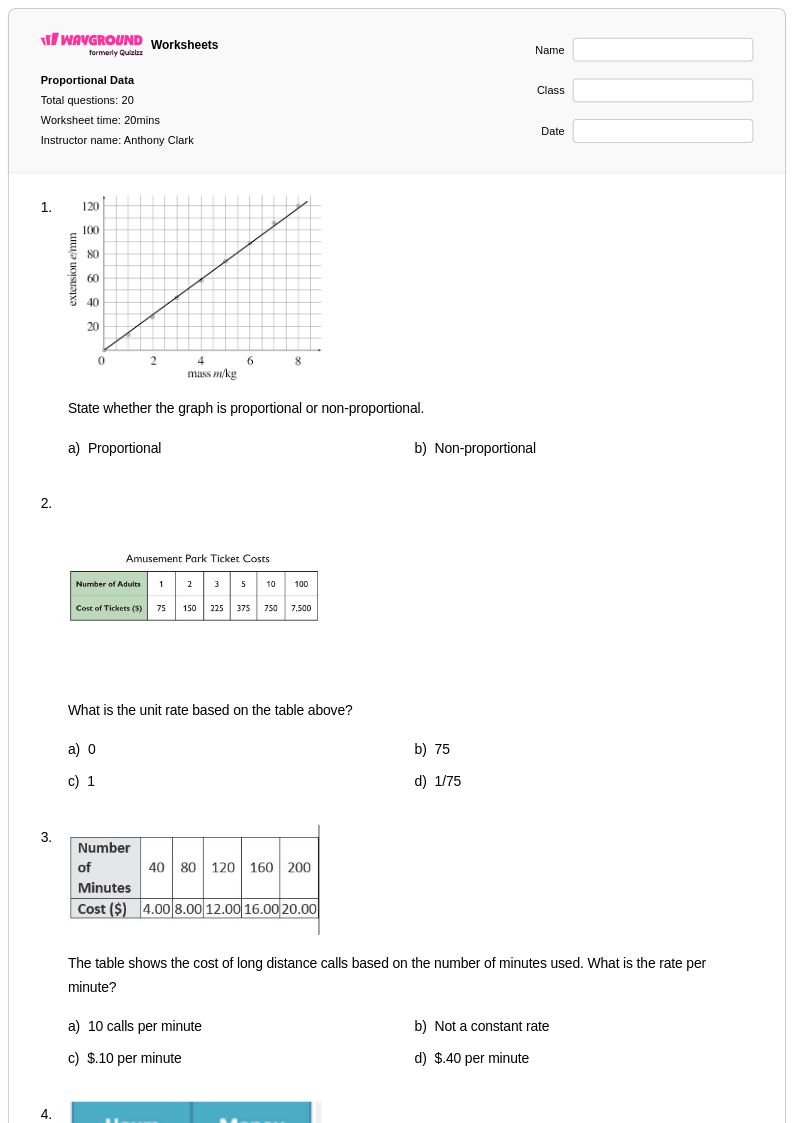
20 Hỏi
7th - Uni
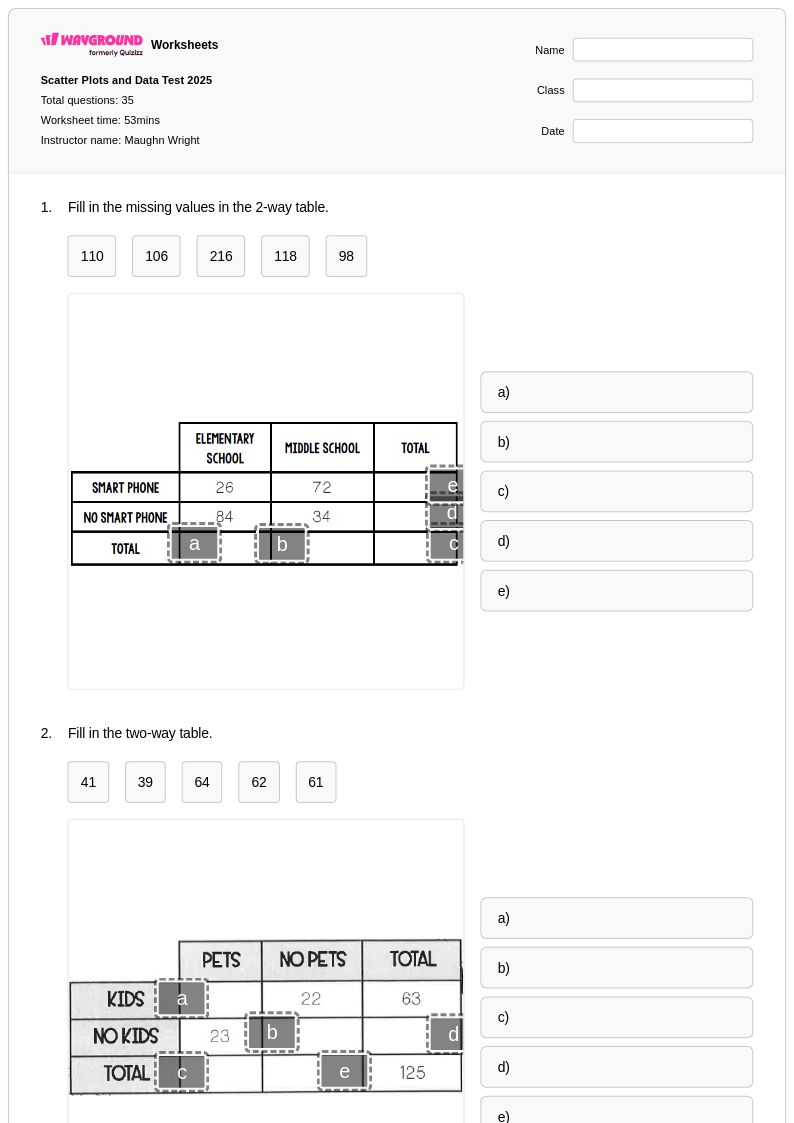
35 Hỏi
8th
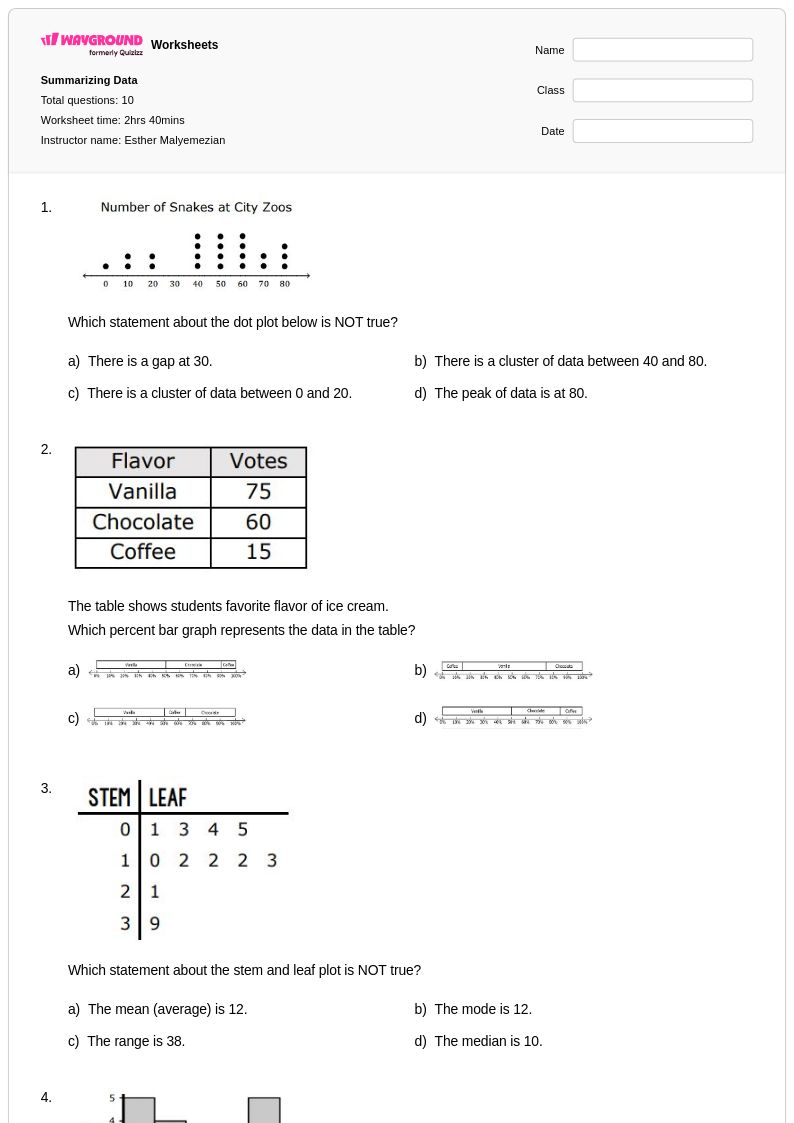
10 Hỏi
6th - 8th
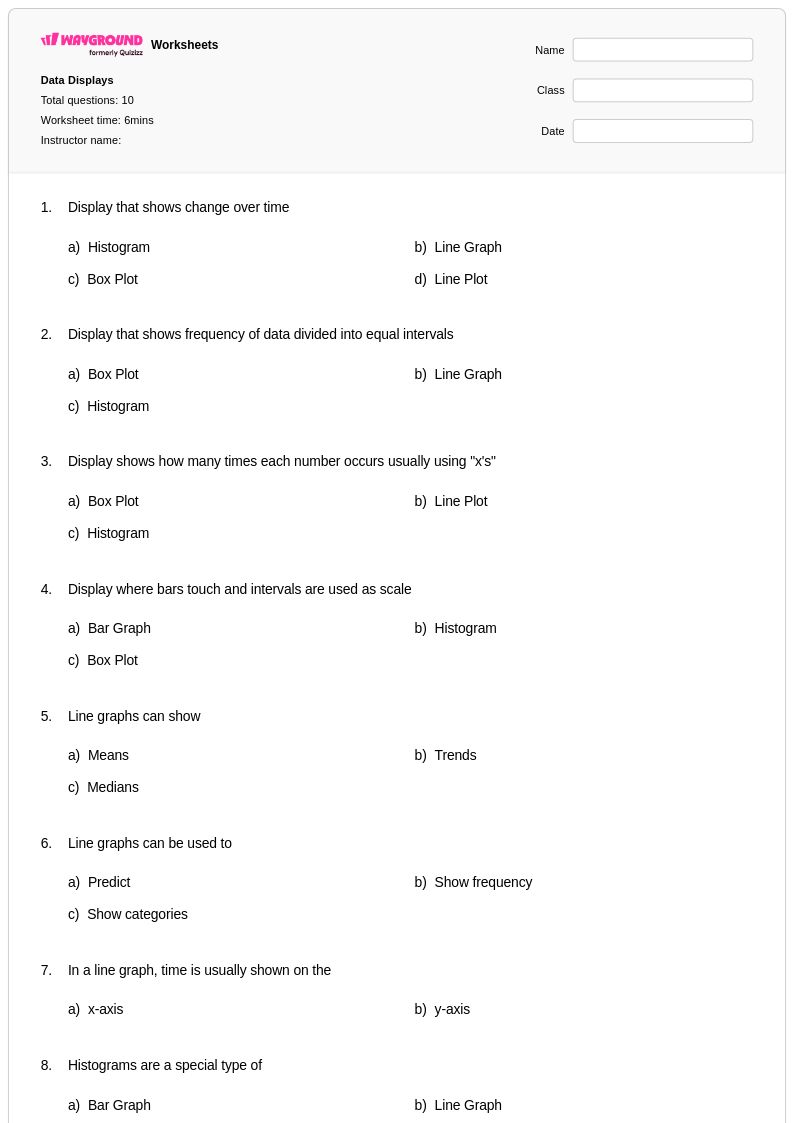
10 Hỏi
6th - 8th
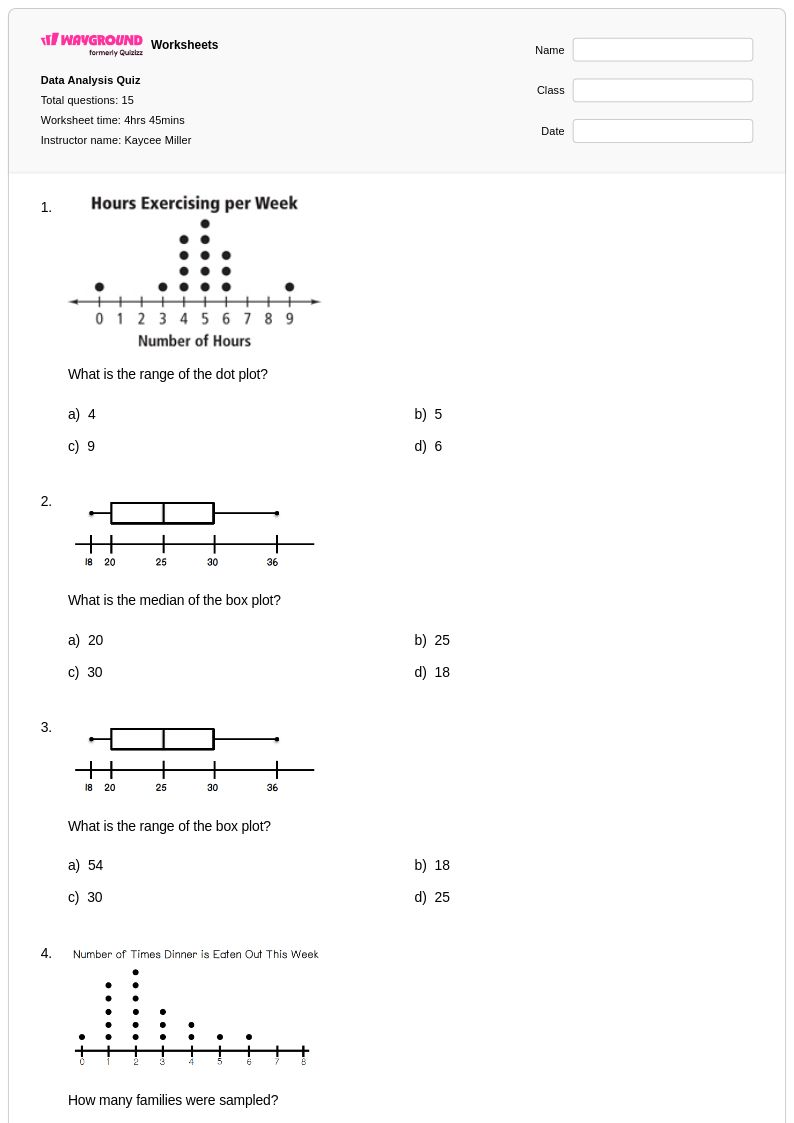
15 Hỏi
6th - 8th
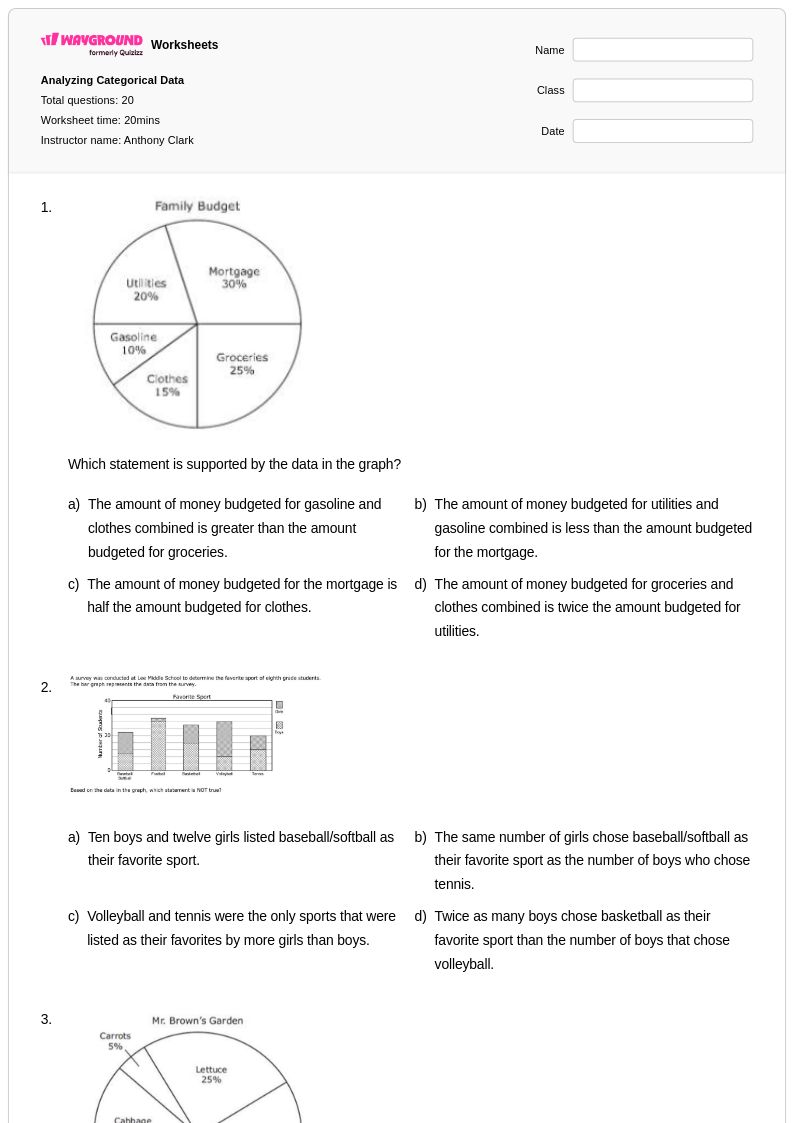
20 Hỏi
7th - Uni
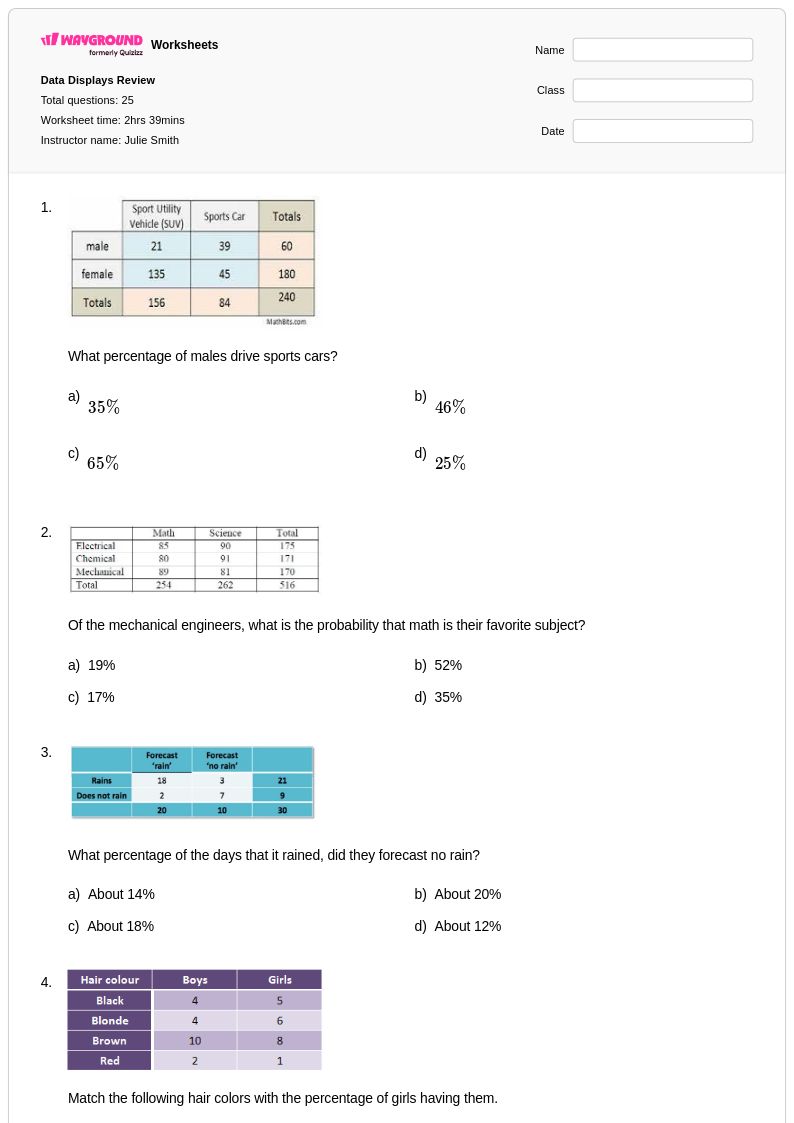
25 Hỏi
8th
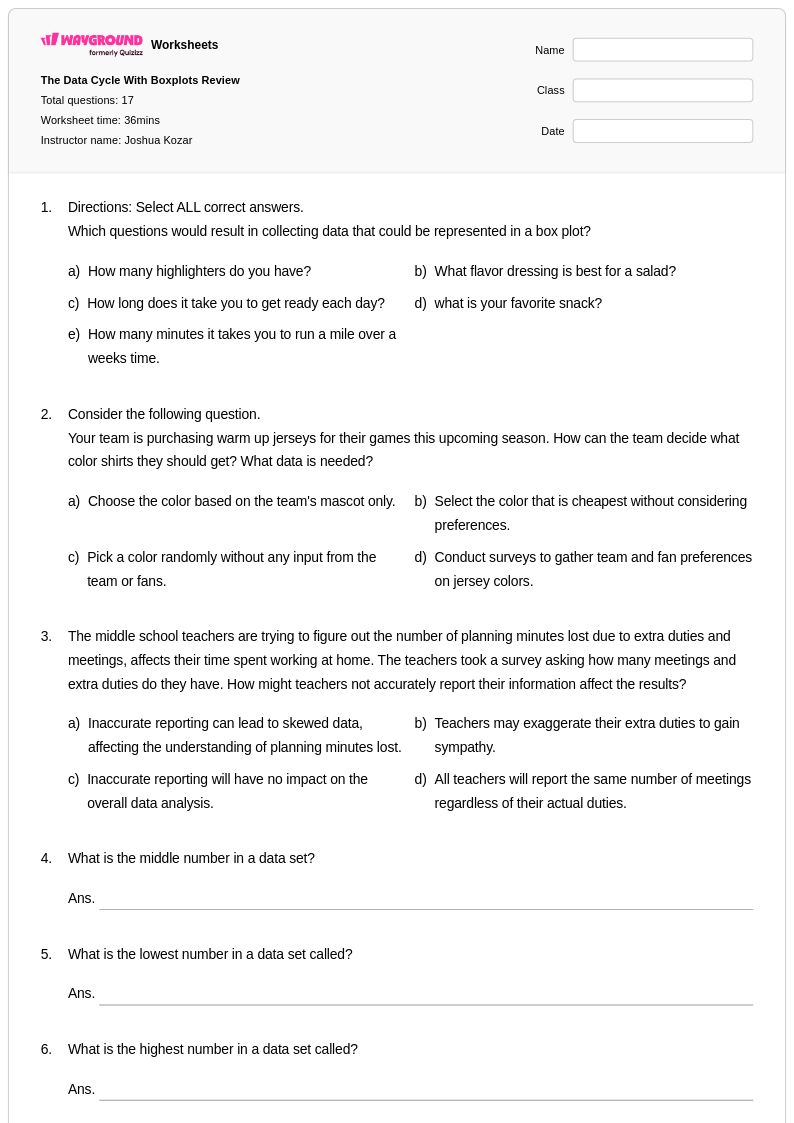
17 Hỏi
8th
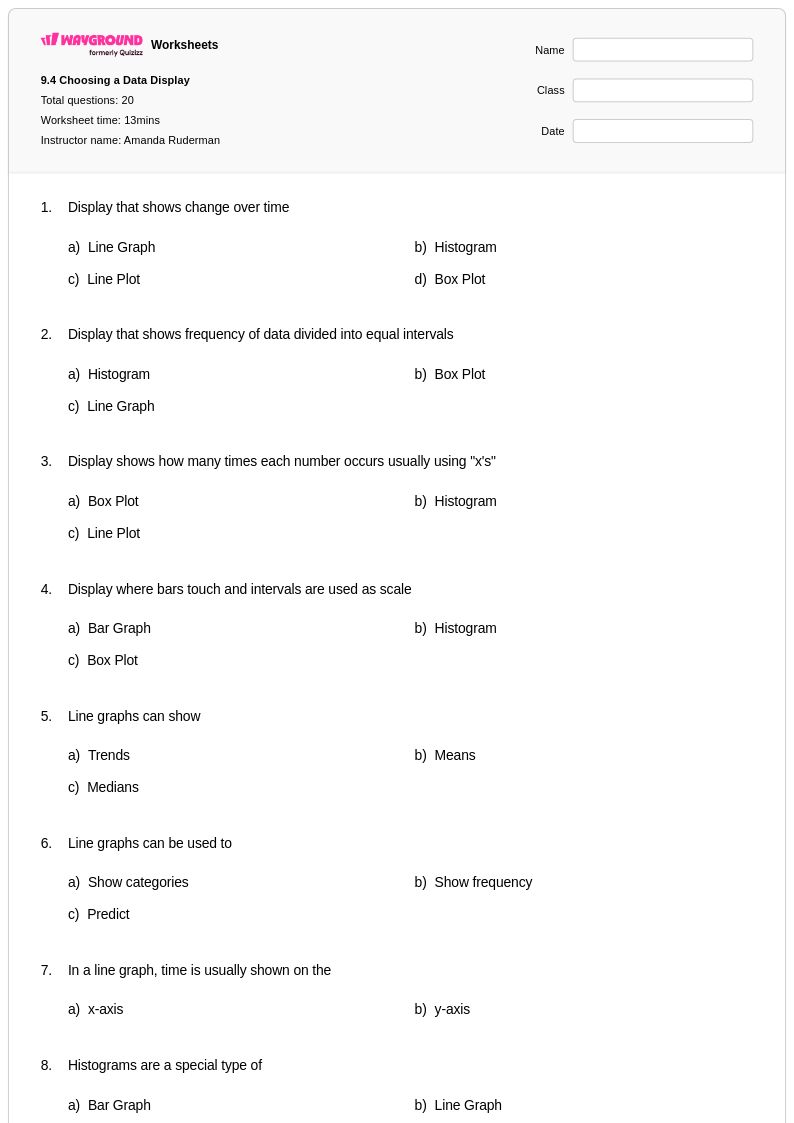
20 Hỏi
7th - 9th
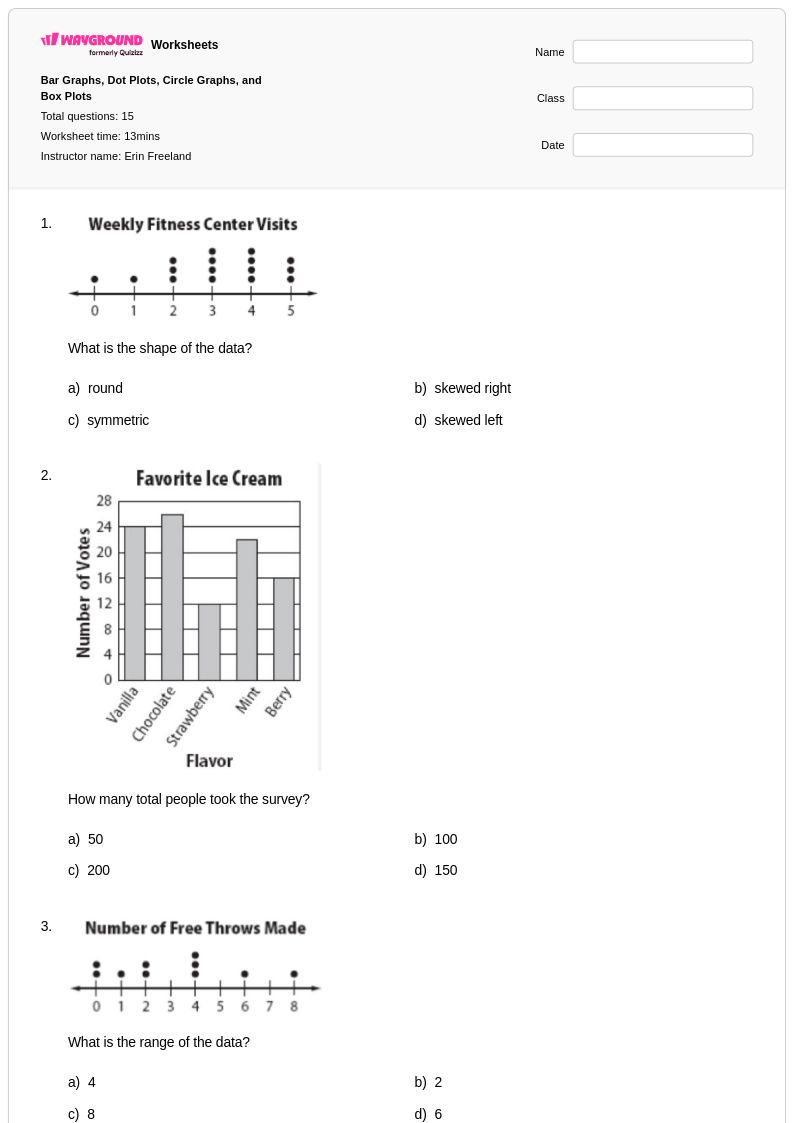
15 Hỏi
6th - 8th
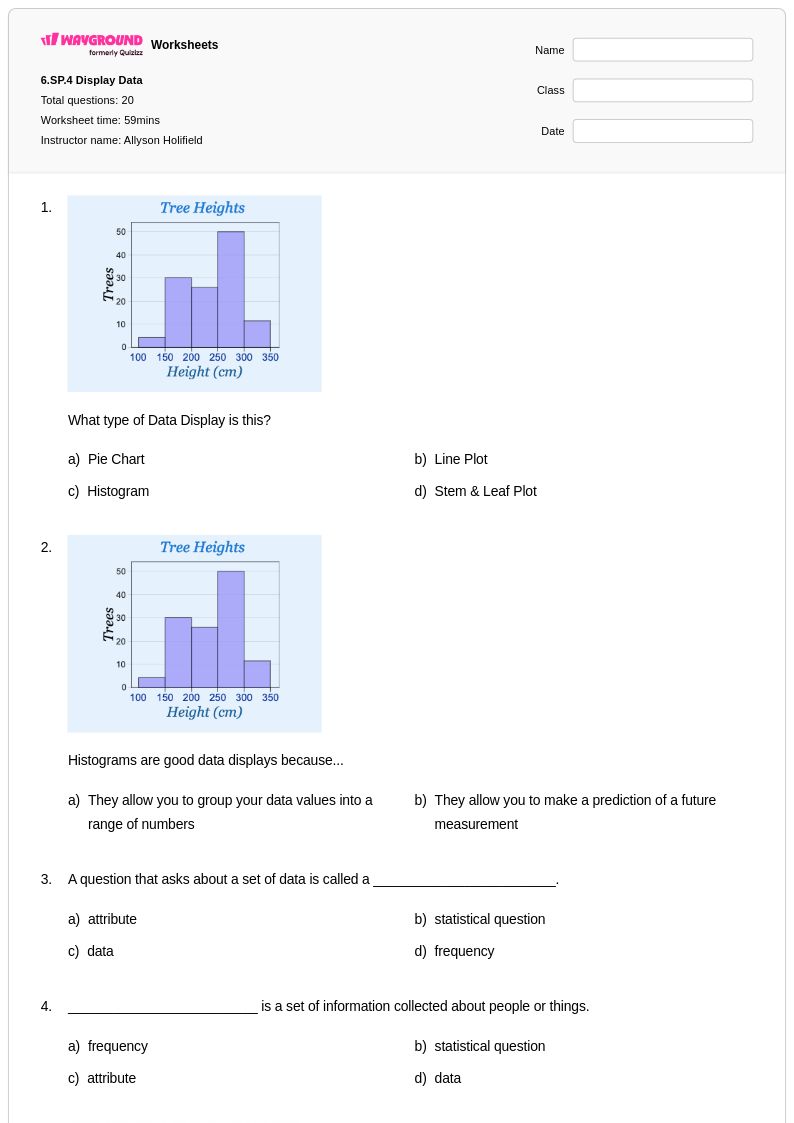
20 Hỏi
6th - 8th
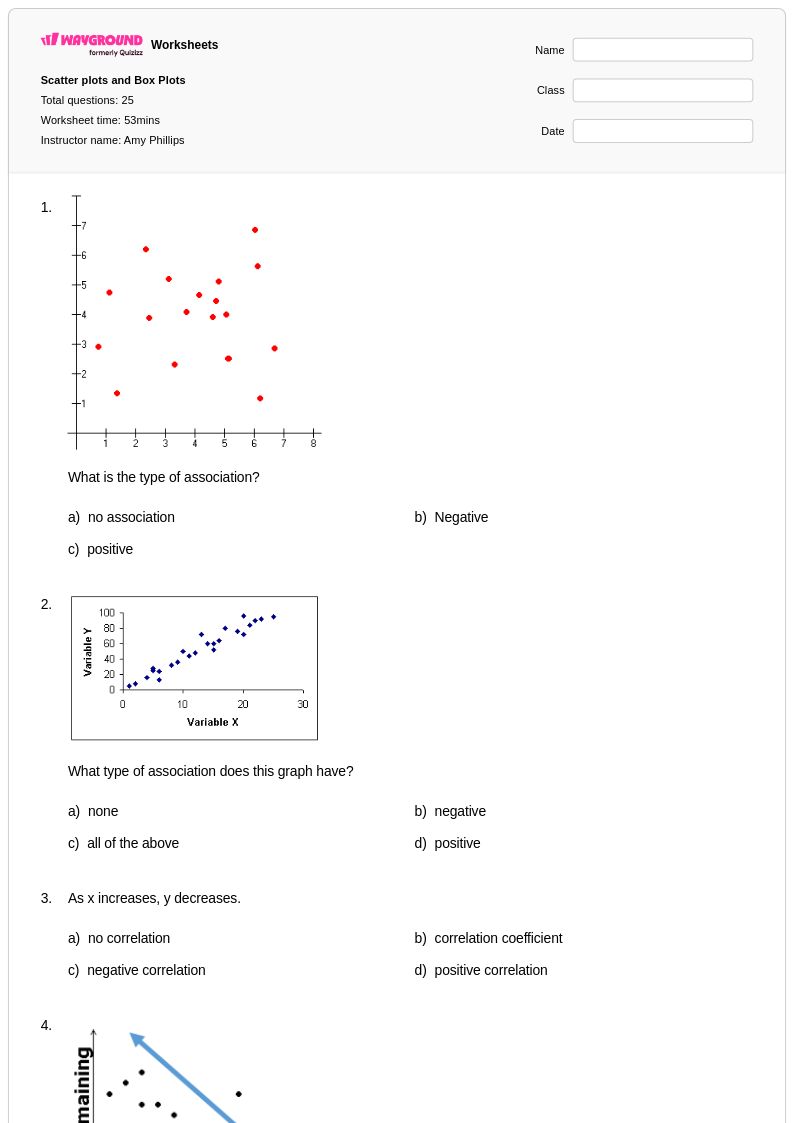
25 Hỏi
8th
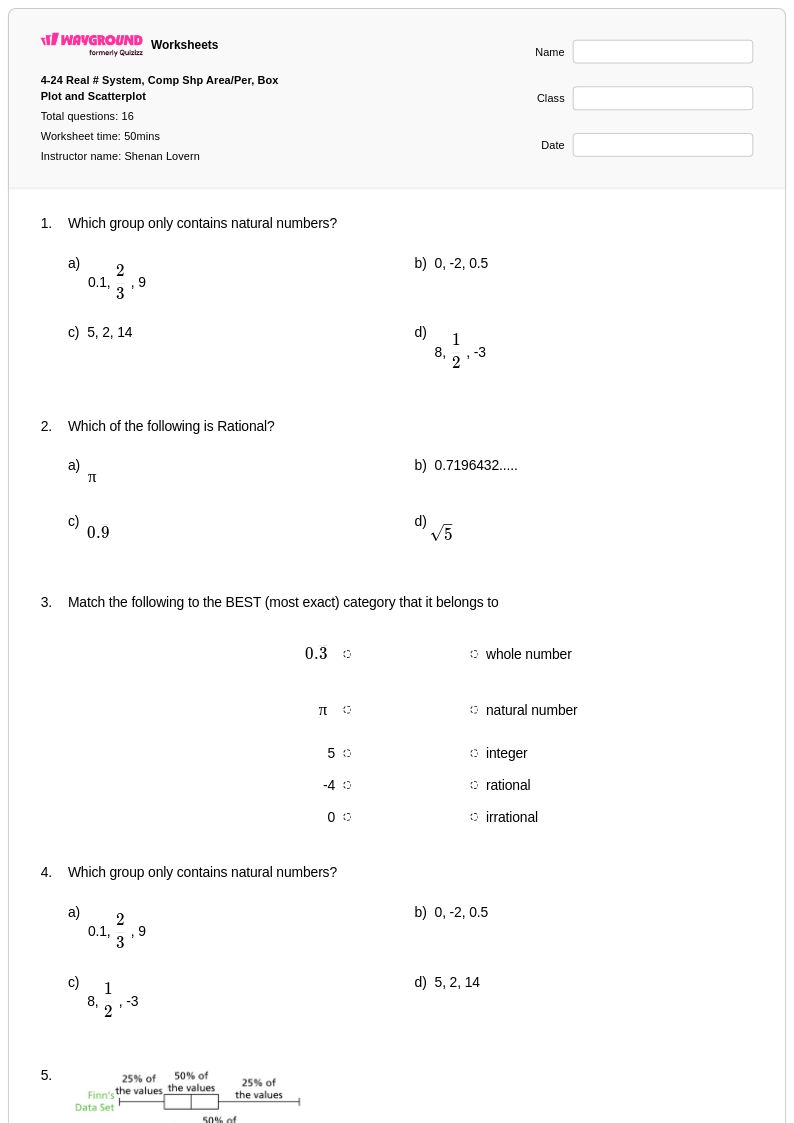
16 Hỏi
8th
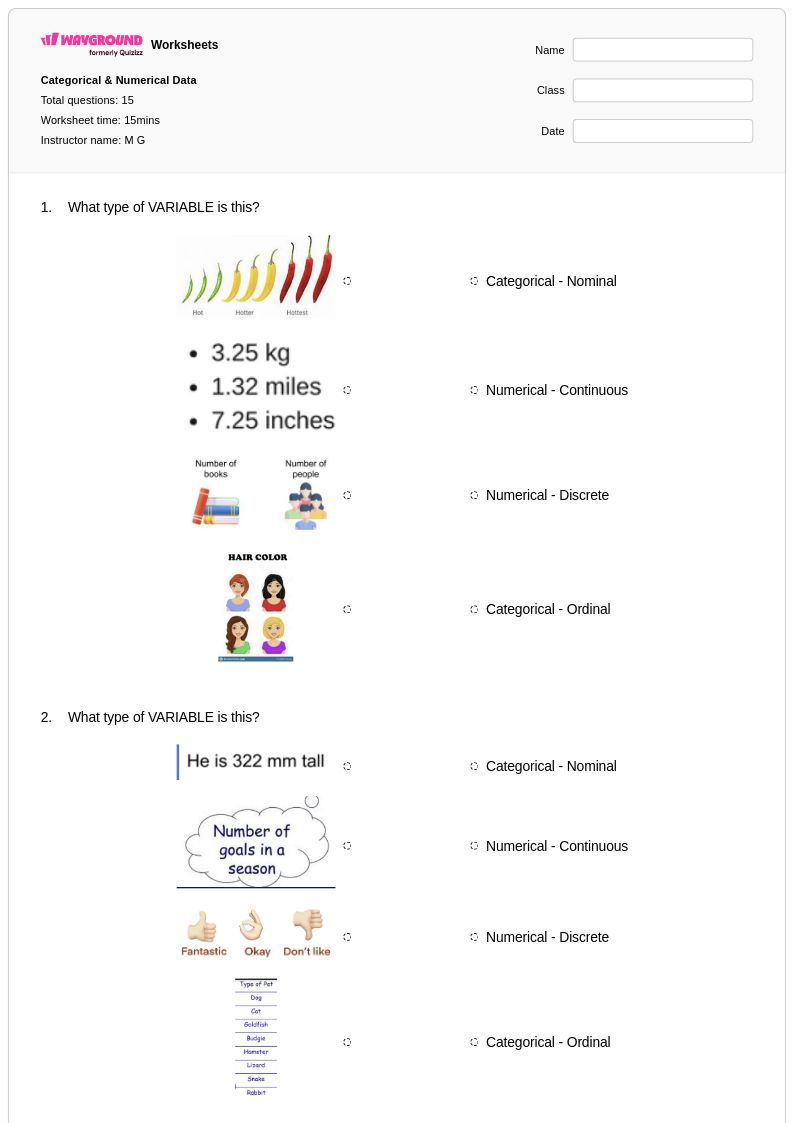
15 Hỏi
6th - 8th
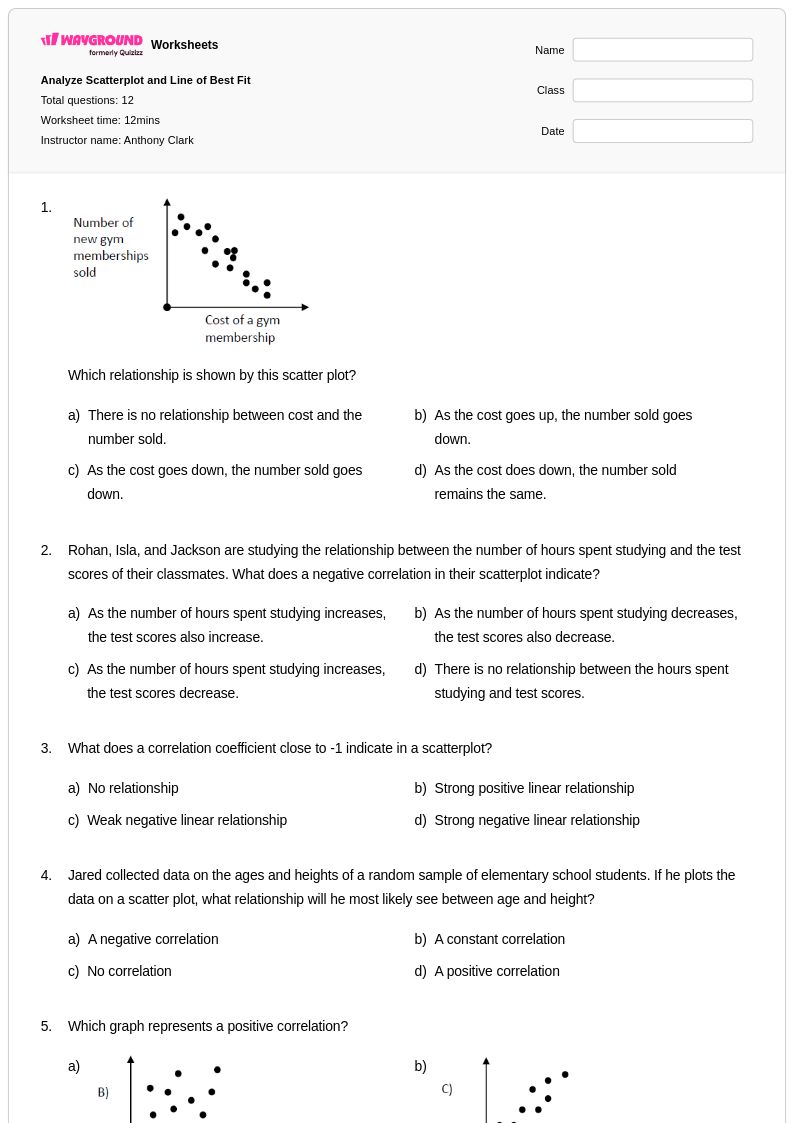
12 Hỏi
8th - Uni
Khám phá Data Visualization Bảng tính theo cấp độ
Khám phá các bảng tính chủ đề khác cho year 8
Explore printable Data Visualization worksheets for Year 8
Data visualization worksheets for Year 8 students available through Wayground (formerly Quizizz) provide comprehensive practice with interpreting, creating, and analyzing various types of graphs and charts essential for mathematical literacy. These carefully designed resources strengthen students' abilities to work with histograms, box plots, scatter plots, line graphs, and bar charts while developing critical thinking skills around data interpretation and statistical reasoning. Each worksheet collection includes detailed answer keys and step-by-step solutions that help students understand the reasoning behind proper graph construction and data analysis techniques. The free printables cover essential concepts such as identifying trends, comparing datasets, determining appropriate graph types for different data sets, and drawing conclusions from visual representations, ensuring students build confidence with practice problems that mirror real-world statistical scenarios.
Wayground (formerly Quizizz) empowers educators with millions of teacher-created Year 8 data visualization resources that streamline lesson planning and support differentiated instruction across diverse learning needs. The platform's robust search and filtering capabilities allow teachers to quickly locate worksheets aligned with specific curriculum standards, whether focusing on introductory graphing concepts or more advanced statistical analysis skills. These digital and printable pdf resources offer flexible customization options, enabling educators to modify difficulty levels, add supplementary questions, or combine multiple worksheet elements to create targeted practice sessions. Teachers can efficiently address remediation needs for struggling students while providing enrichment opportunities for advanced learners, using the comprehensive collection to reinforce classroom instruction, assign meaningful homework, and assess student progress in data visualization and statistical reasoning skills.
FAQs
How do I teach data visualization in Grade 8?
What exercises help eighth graders practice data visualization?
What mistakes do Grade 8 students make when interpreting graphs?
How should teachers use these Grade 8 data visualization worksheets?
How does Grade 8 data visualization align with Common Core math?
How can I differentiate Grade 8 data visualization practice?
What data visualization skills should an eighth grader know?