
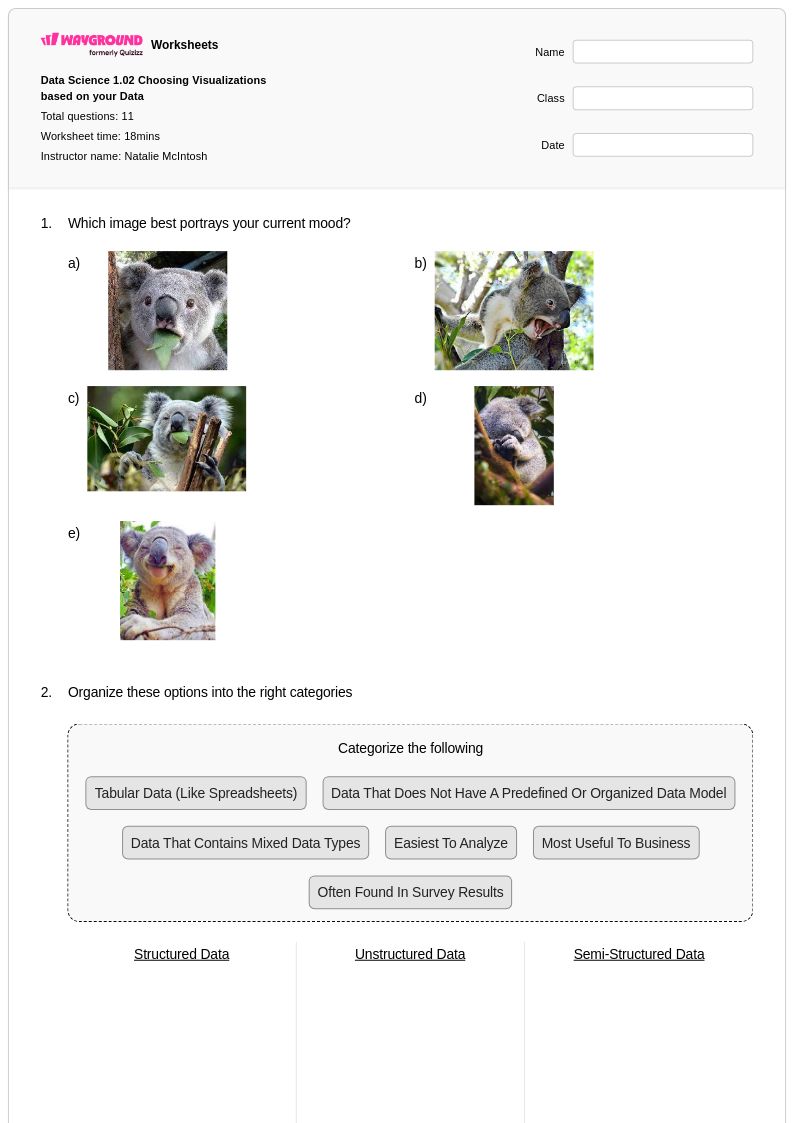
5 Q
8th
18 Q
12th
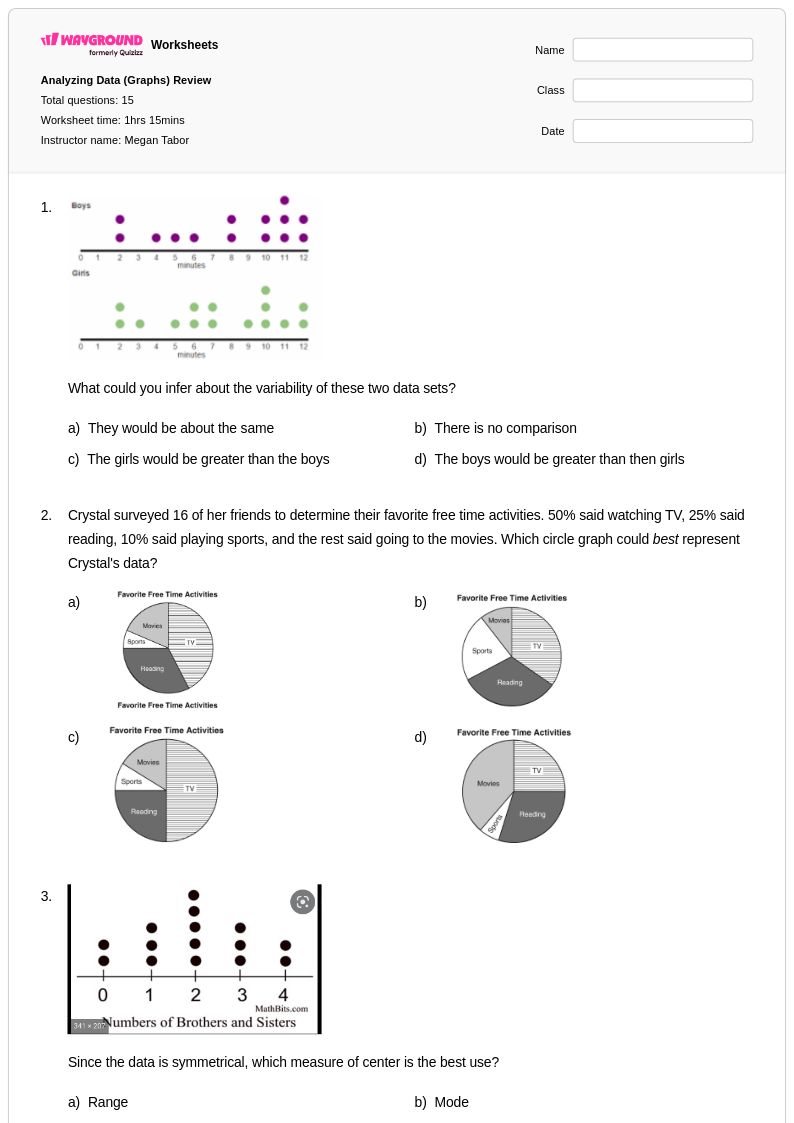
20 Q
8th
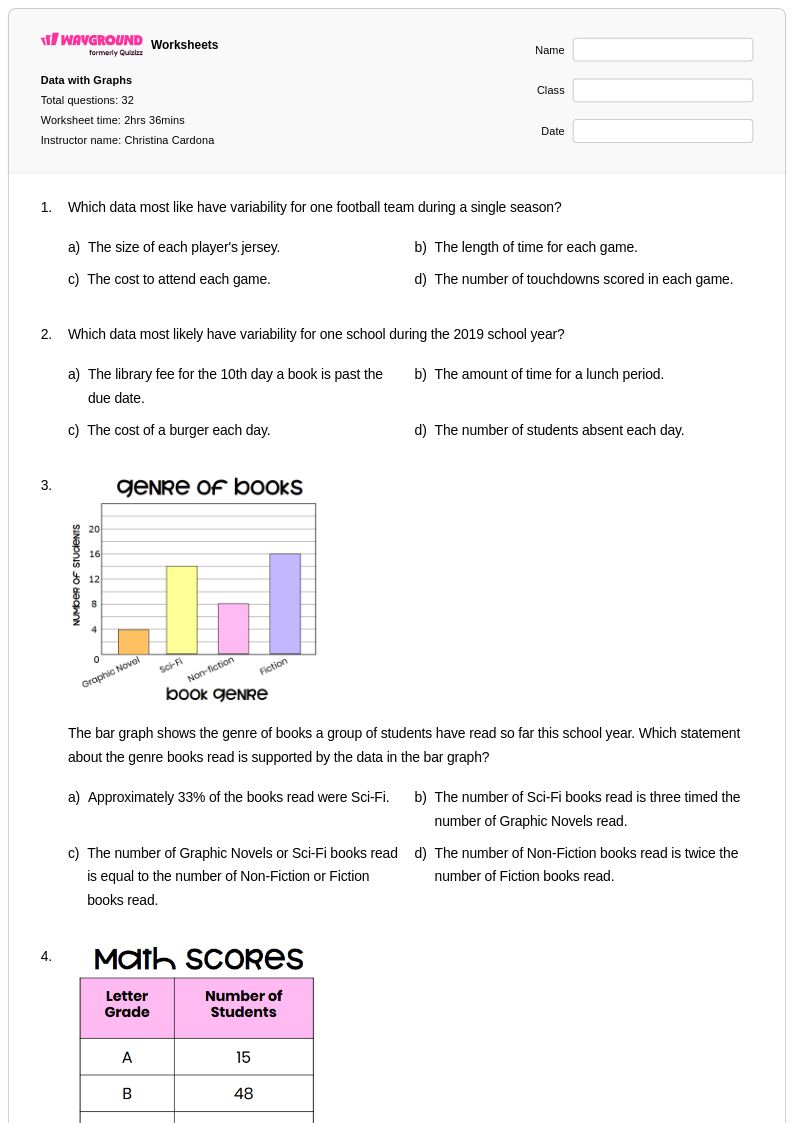
28 Q
9th
16 Q
Uni
15 Q
11th
15 Q
12th
15 Q
Uni
11 Q
9th - 12th
15 Q
7th
15 Q
8th
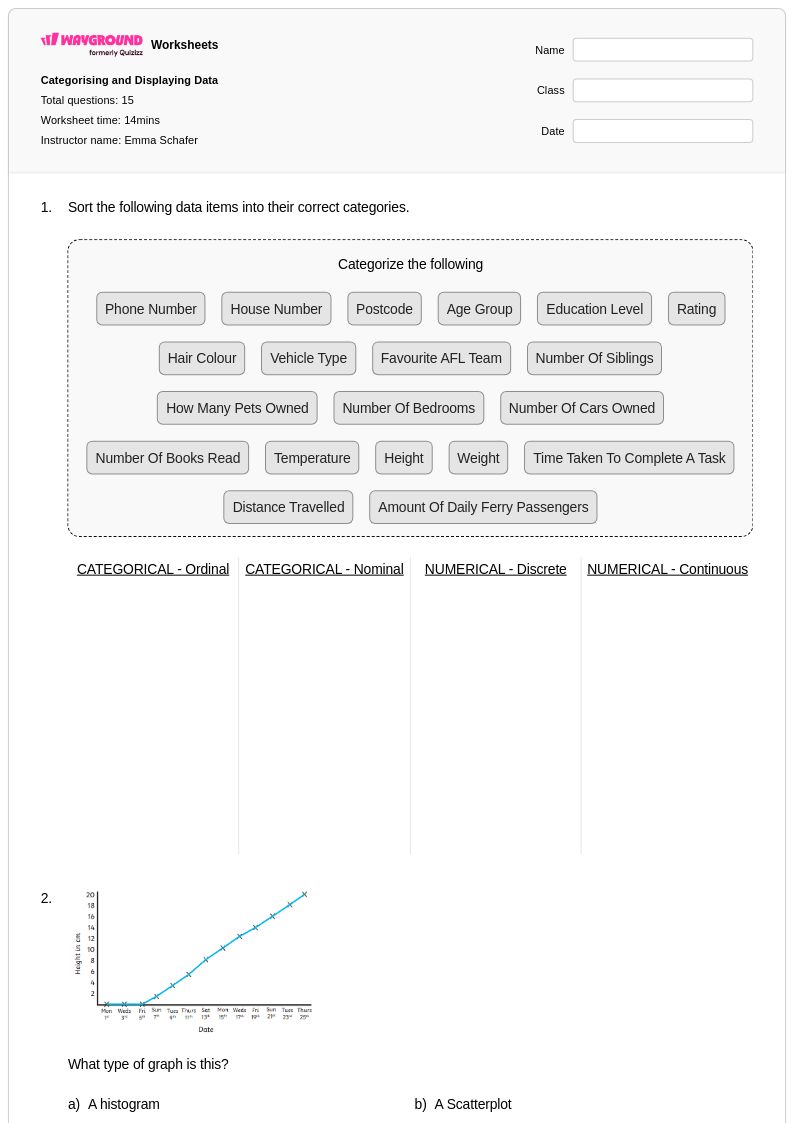
32 Q
6th
8 Q
3rd
10 Q
9th - 12th
11 Q
8th
20 Q
8th
14 Q
9th
12 Q
5th
9 Q
9th - 12th
8 Q
4th
11 Q
11th
14 Q
9th - 12th
20 Q
6th - 8th
19 Q
3rd
Explore Worksheets by Grade
Explore Worksheets by Subjects
Explore printable Data Visualization worksheets
Data visualization worksheets available through Wayground (formerly Quizizz) provide comprehensive practice in interpreting, creating, and analyzing various types of graphs, charts, and statistical displays. These mathematics resources strengthen essential skills in reading bar graphs, line plots, histograms, box plots, scatter plots, and pie charts while developing students' ability to extract meaningful information from visual data representations. The worksheet collections include detailed practice problems that guide learners through the process of constructing accurate graphs from raw data sets, interpreting trends and patterns, and making data-driven conclusions. Each printable resource comes with a complete answer key, allowing students to verify their understanding of concepts such as scale selection, axis labeling, and data point accuracy. These free pdf materials systematically build proficiency in translating between numerical data and visual formats, ensuring students develop both technical graphing skills and critical thinking abilities necessary for statistical analysis.
Wayground (formerly Quizizz) supports mathematics educators with millions of teacher-created data visualization resources that streamline lesson planning and enhance probability and statistics instruction. The platform's robust search and filtering capabilities enable teachers to quickly locate worksheets targeting specific visualization techniques, from basic pictographs to complex statistical plots, with many resources aligned to mathematical standards for seamless curriculum integration. Teachers can easily differentiate instruction by selecting from various difficulty levels and customizing existing worksheets to match their students' needs, whether for foundational skill building, remediation, or advanced enrichment activities. The flexible format options, including printable pdf versions and digital alternatives, accommodate diverse classroom environments and learning preferences. These comprehensive tools help educators efficiently assess student understanding of data interpretation concepts while providing targeted practice opportunities that reinforce essential mathematical reasoning skills across multiple statistical representations.