
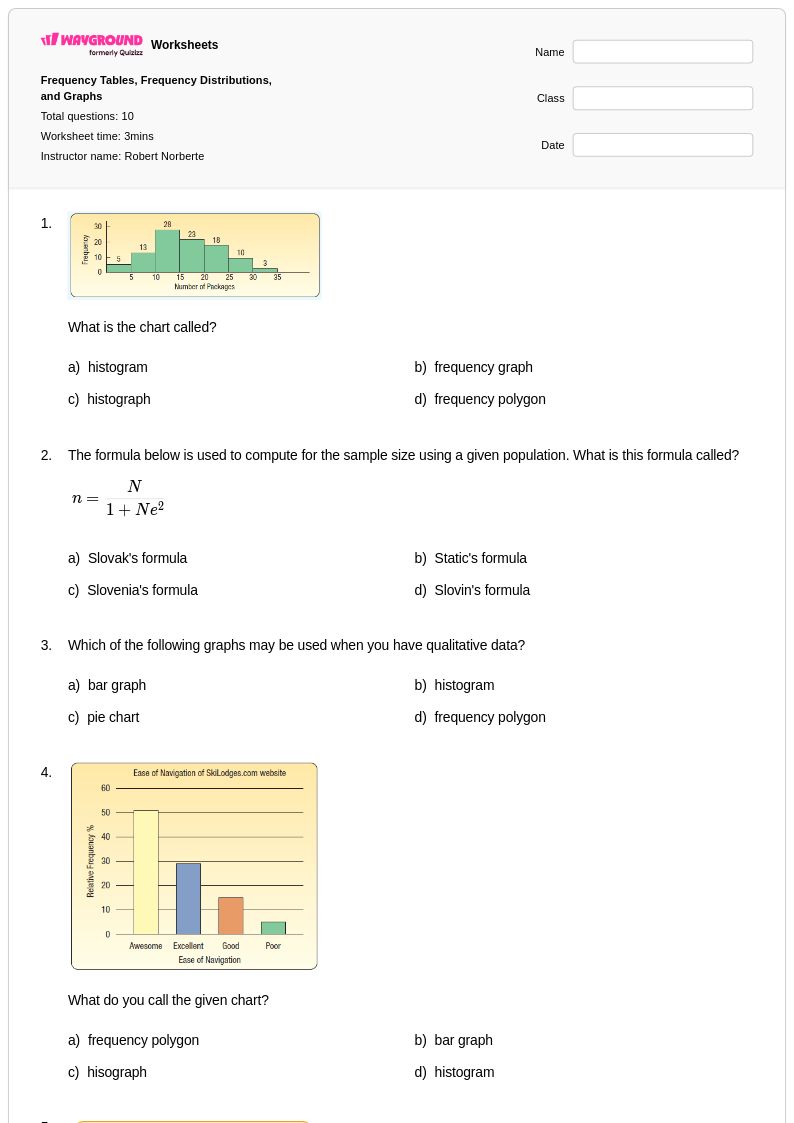
10 P
Uni
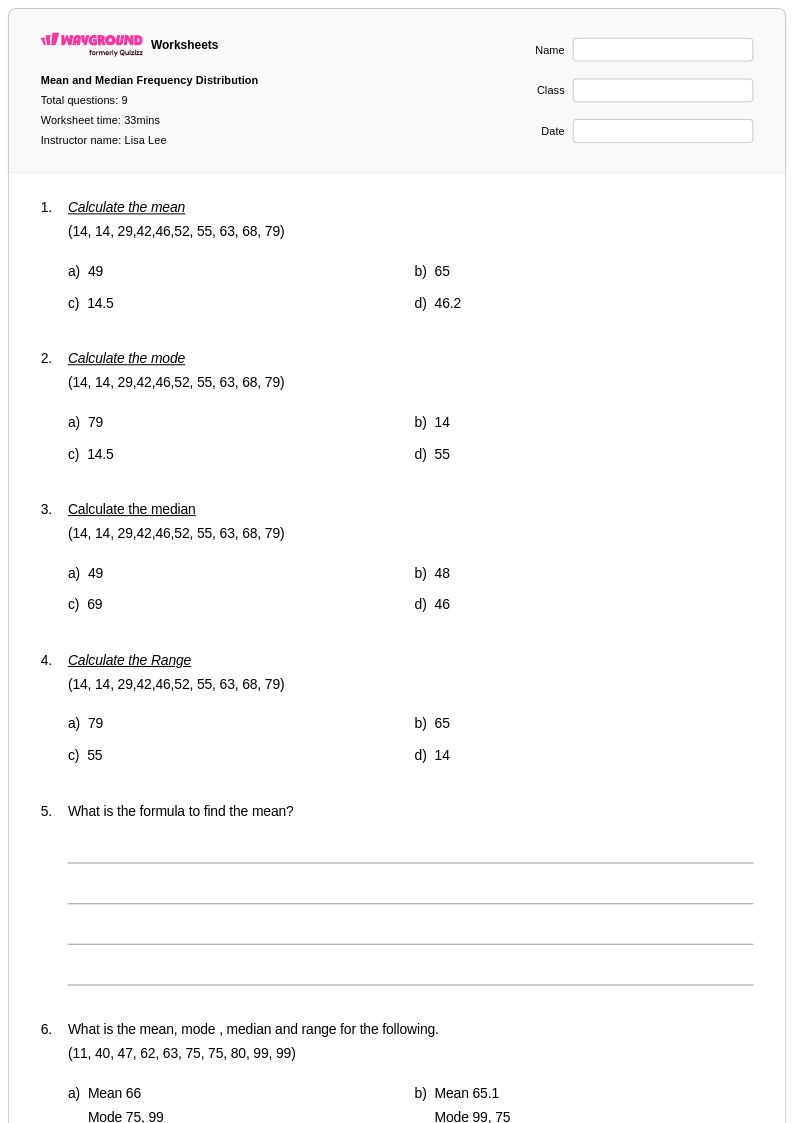
9 P
5th
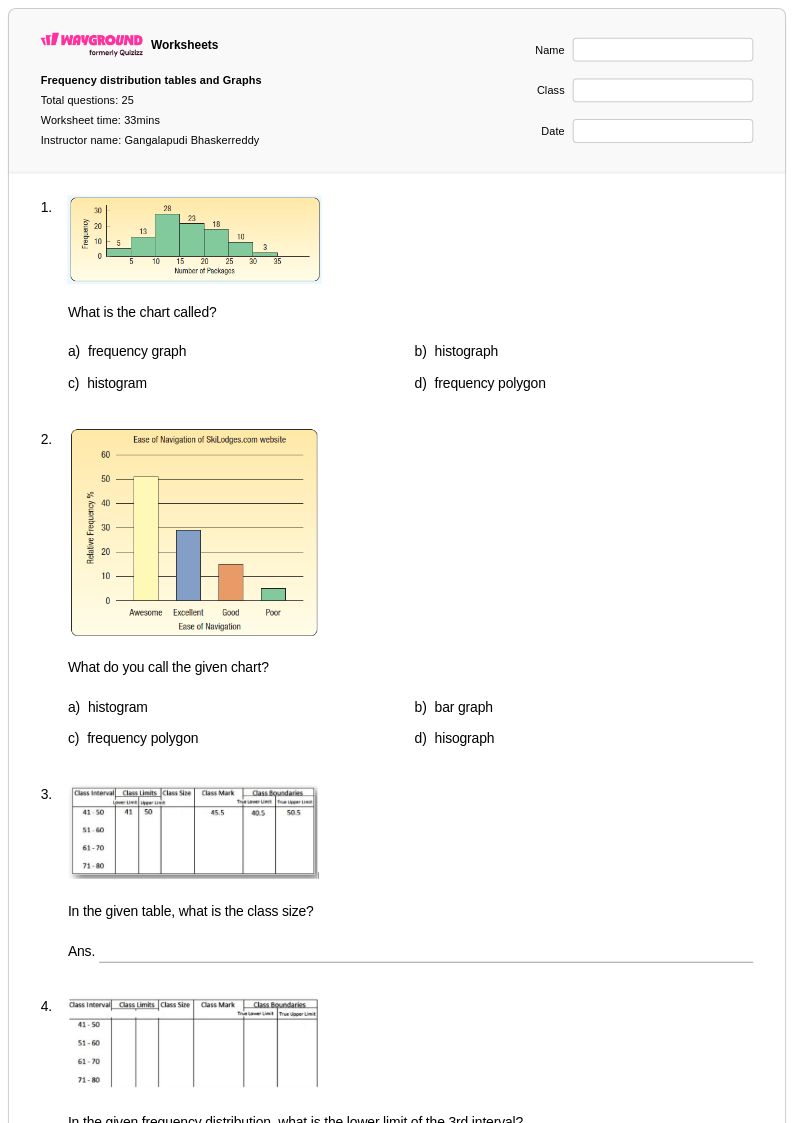
25 P
8th - 10th
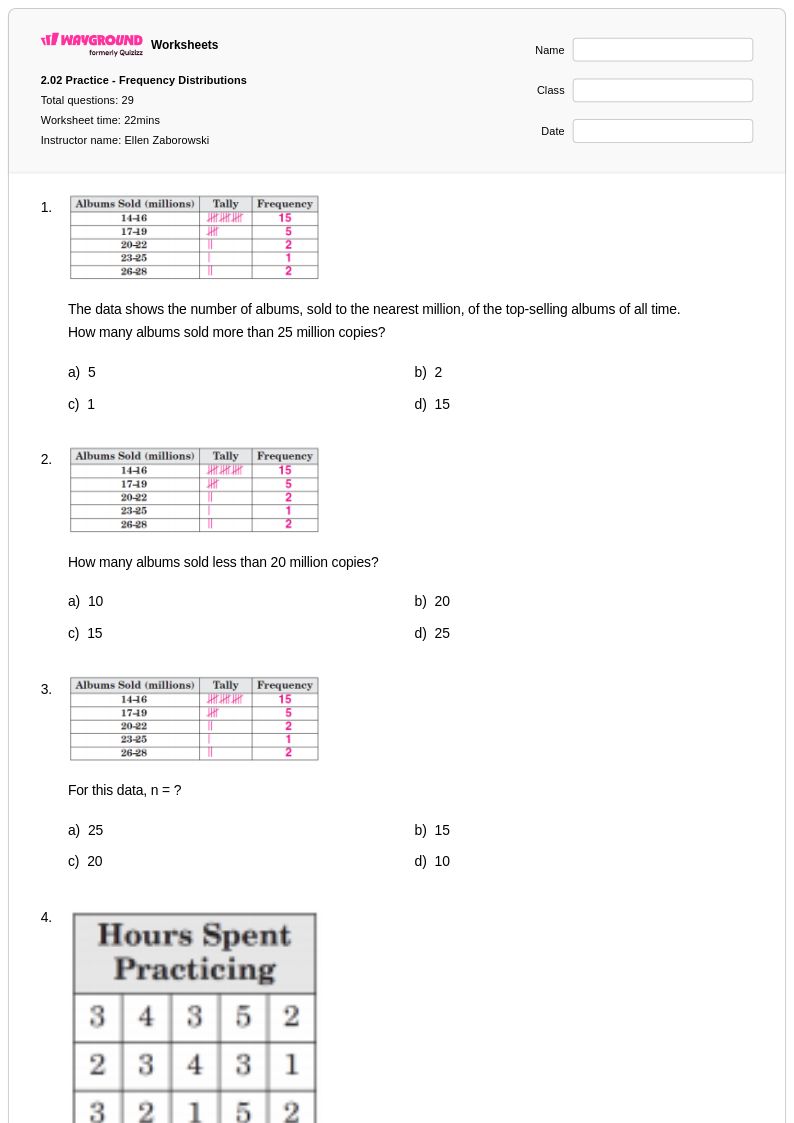
29 P
12th
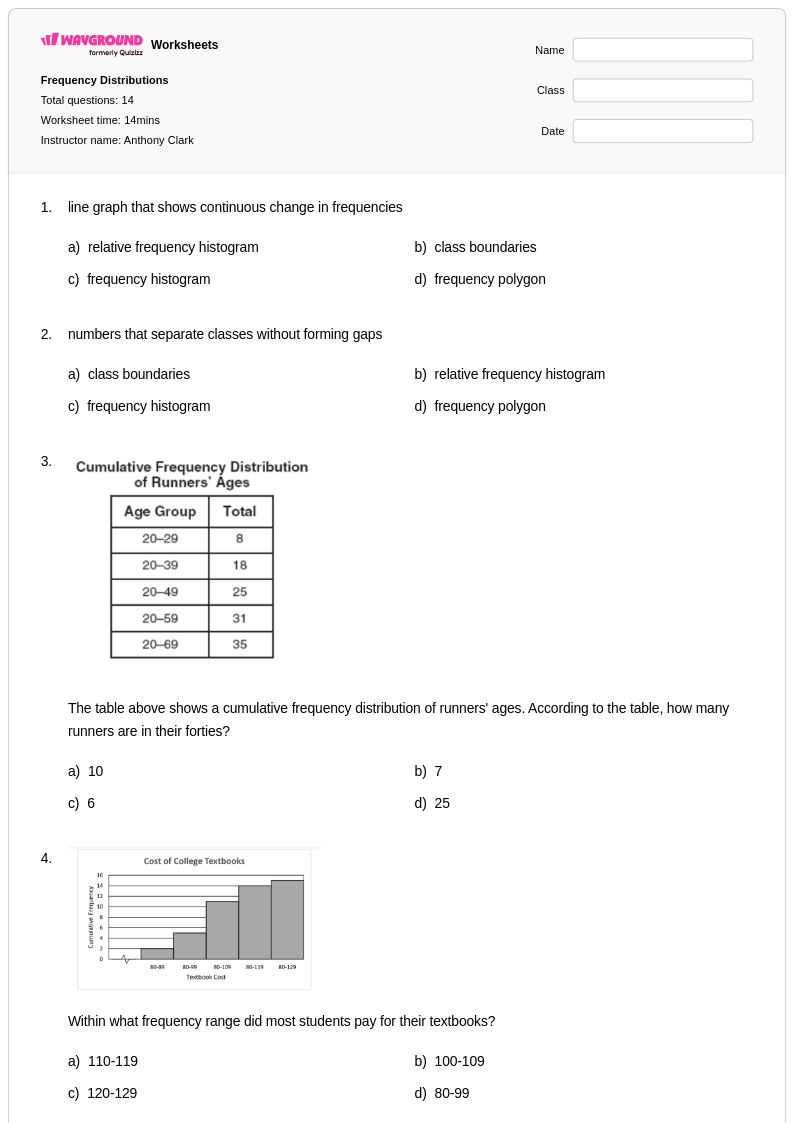
14 P
12th - Uni
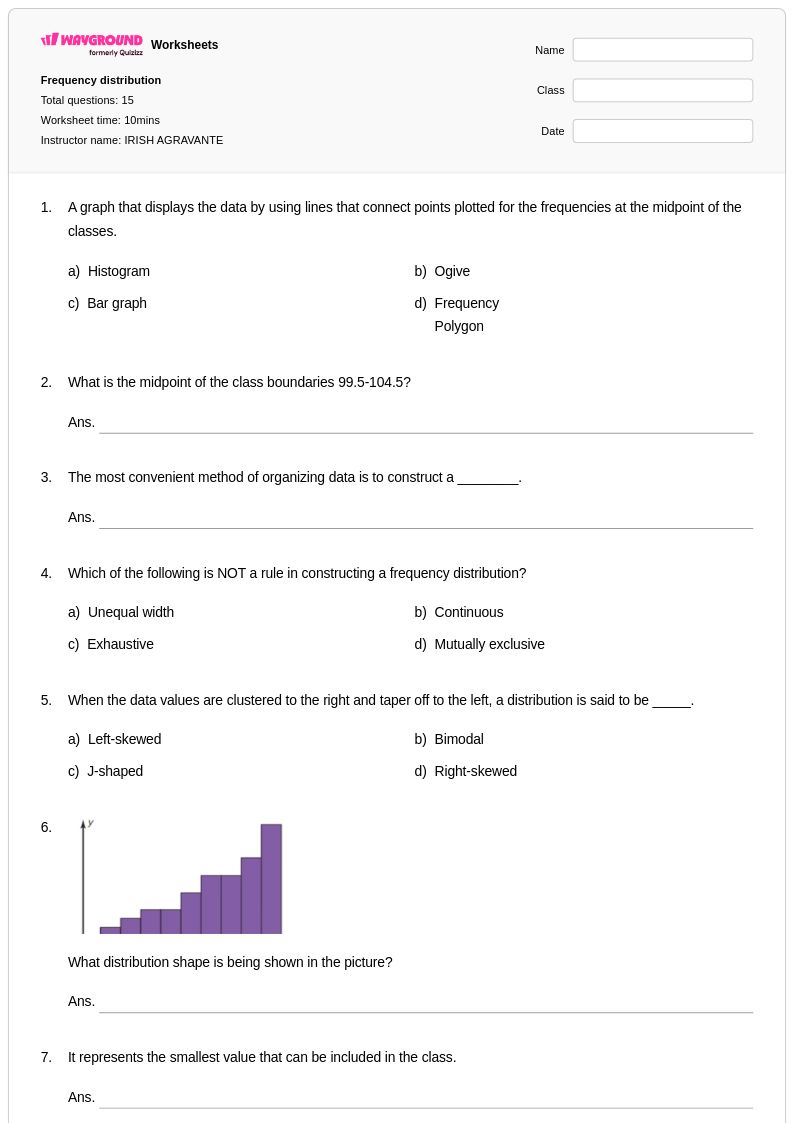
15 P
3rd
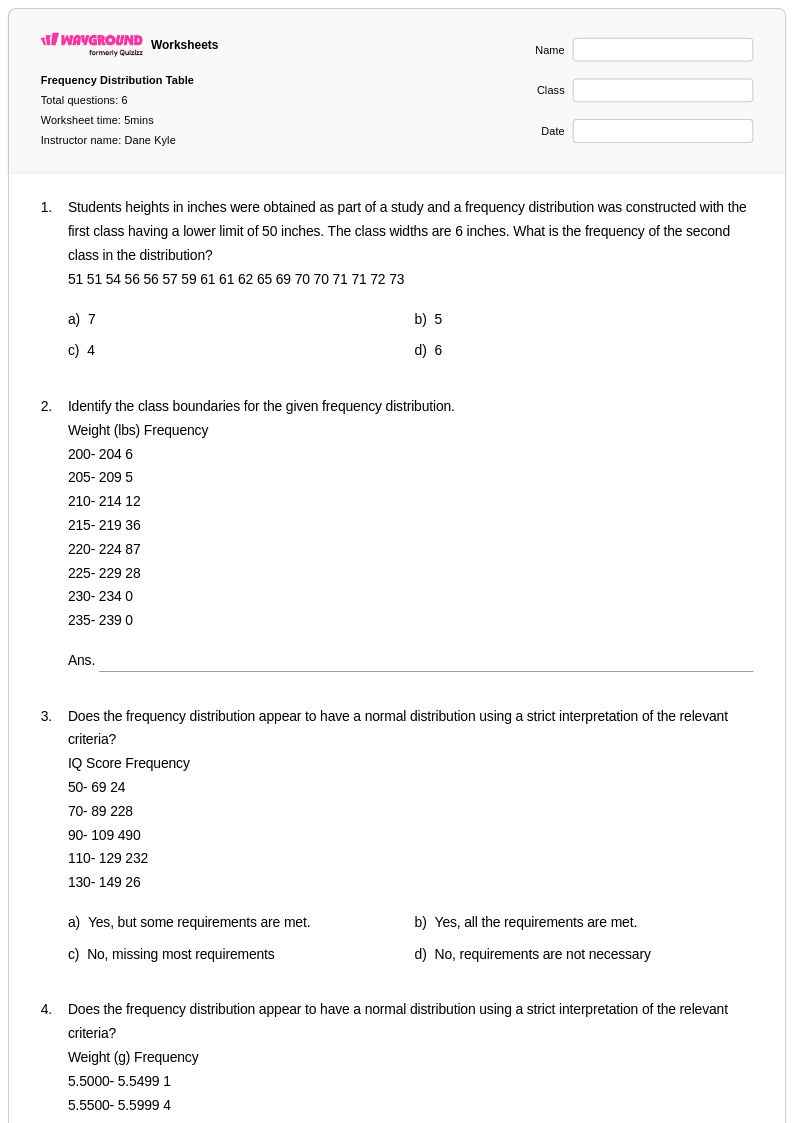
6 P
Uni
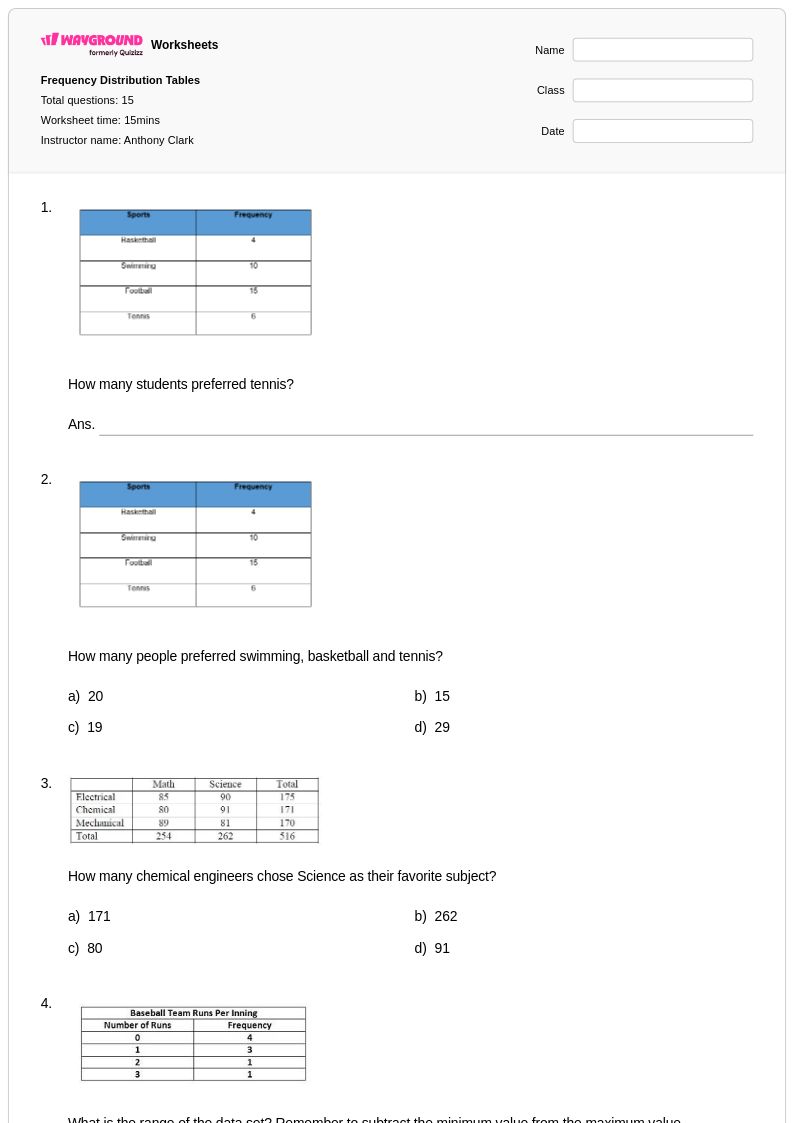
15 P
10th - Uni
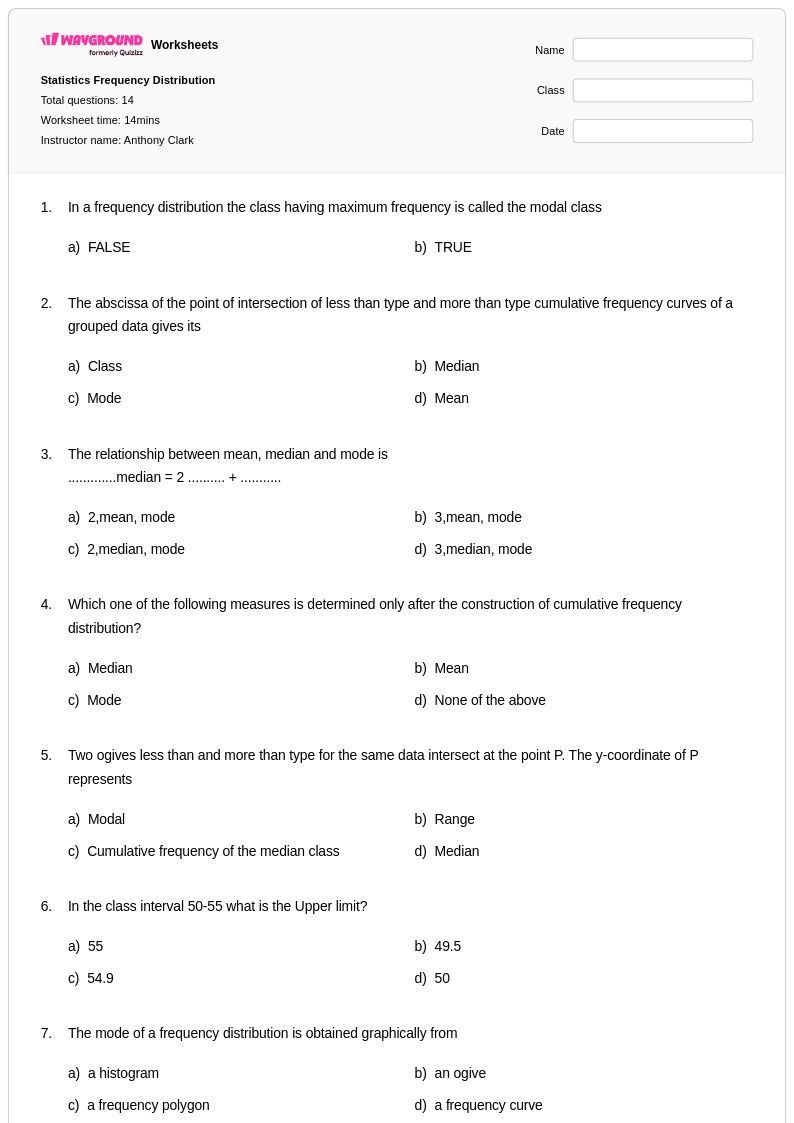
14 P
9th - Uni
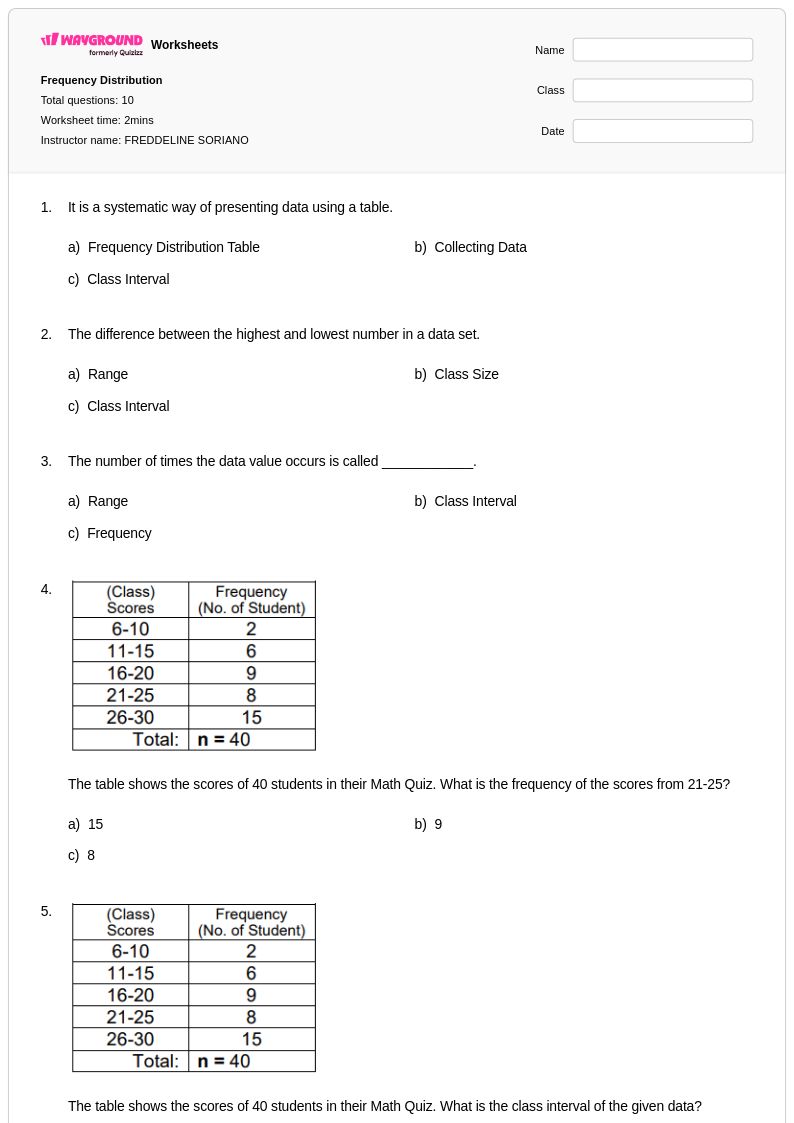
10 P
7th
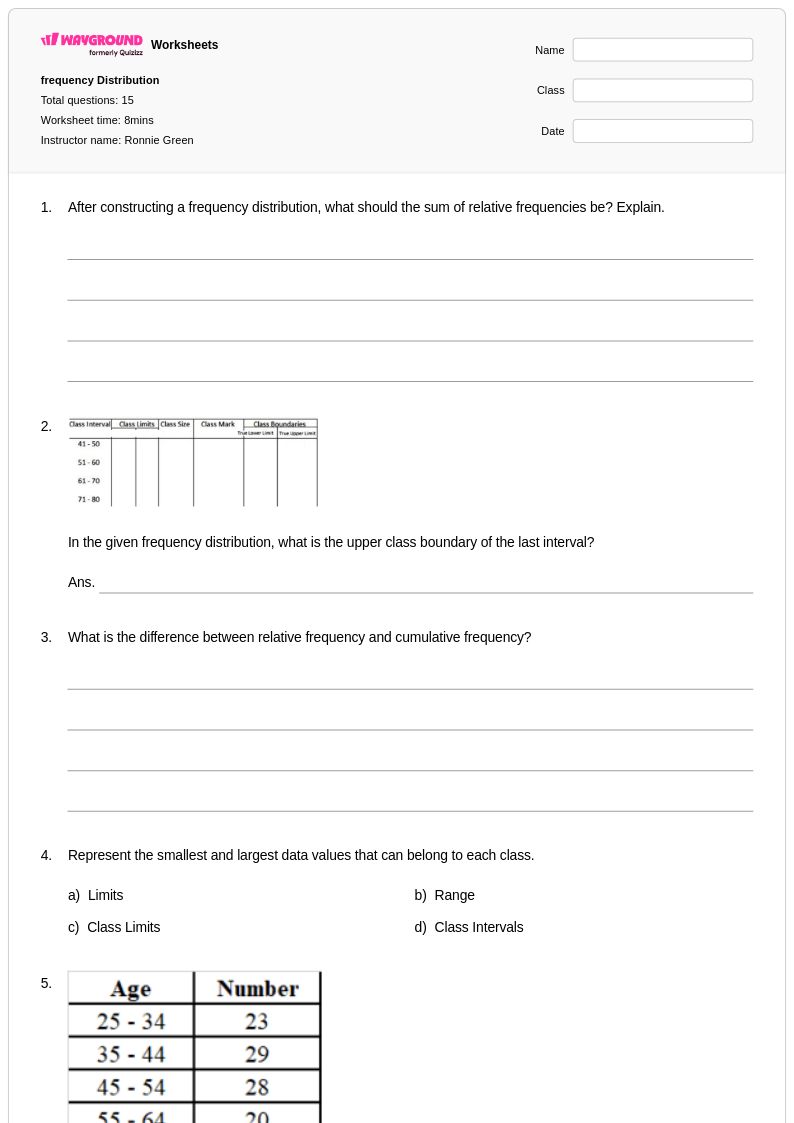
15 P
11th - Uni
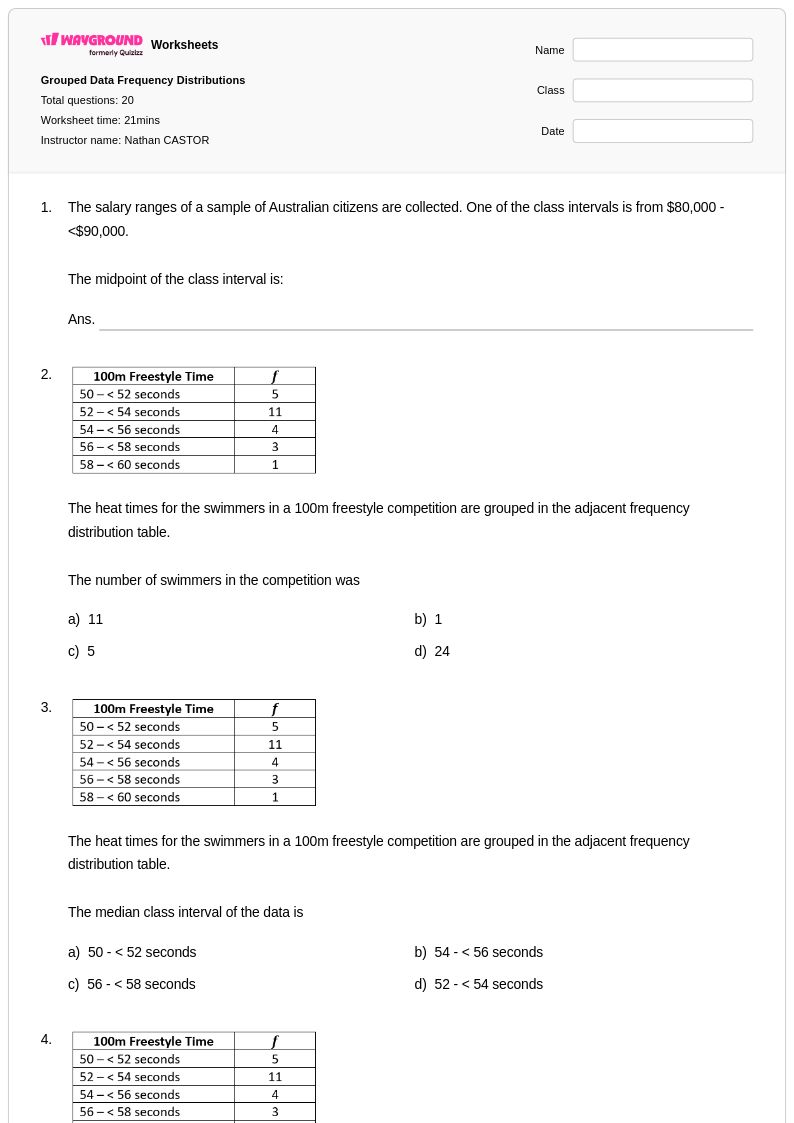
20 P
9th
15 P
7th
10 P
10th
12 P
12th
25 P
8th - 10th
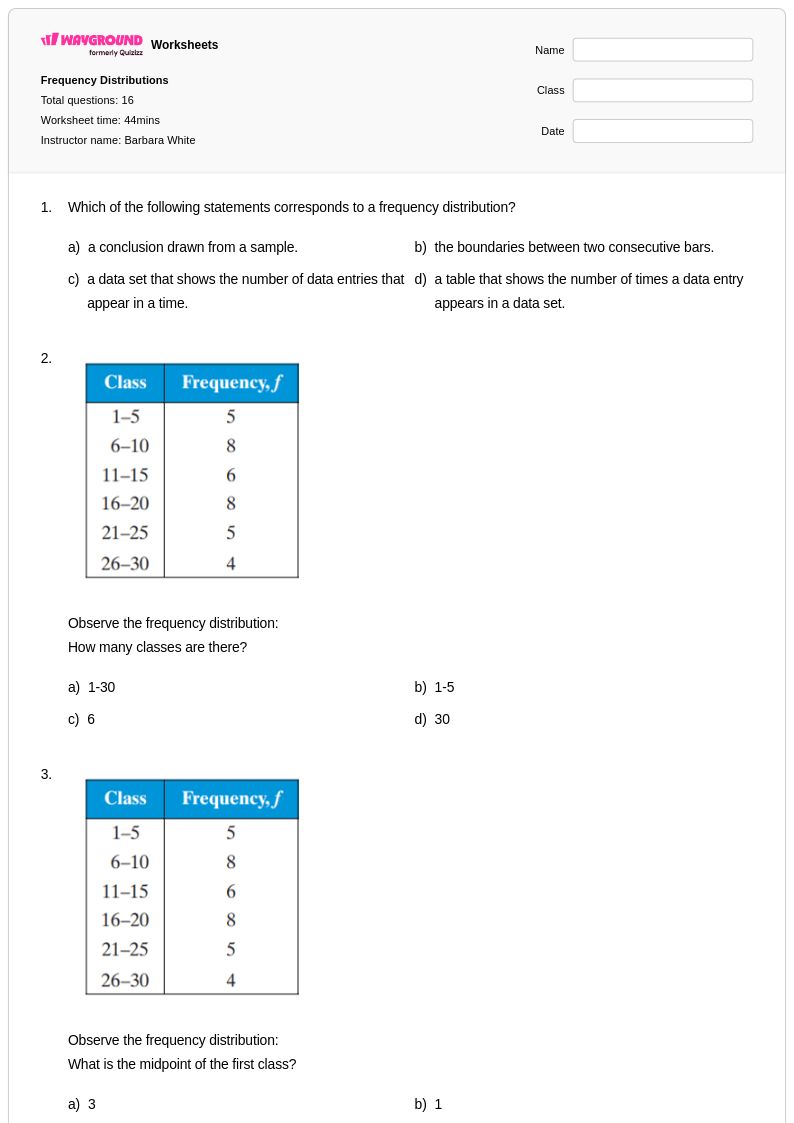
16 P
11th
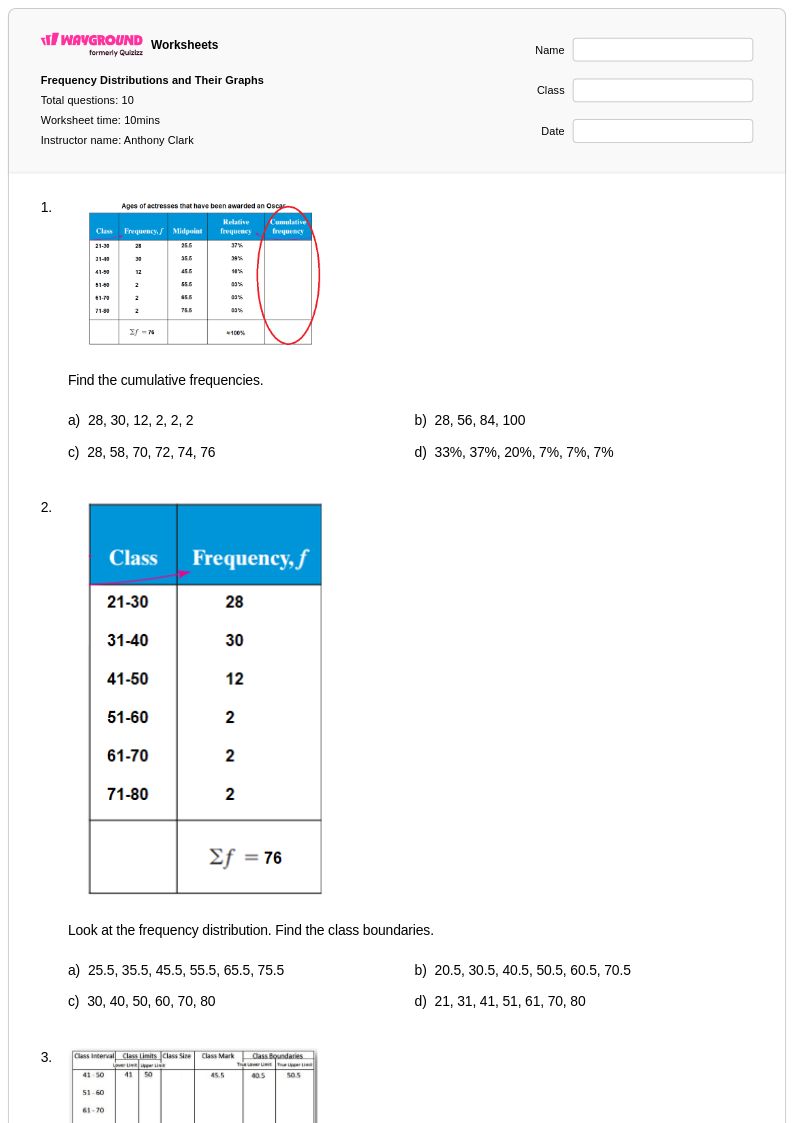
10 P
12th - Uni
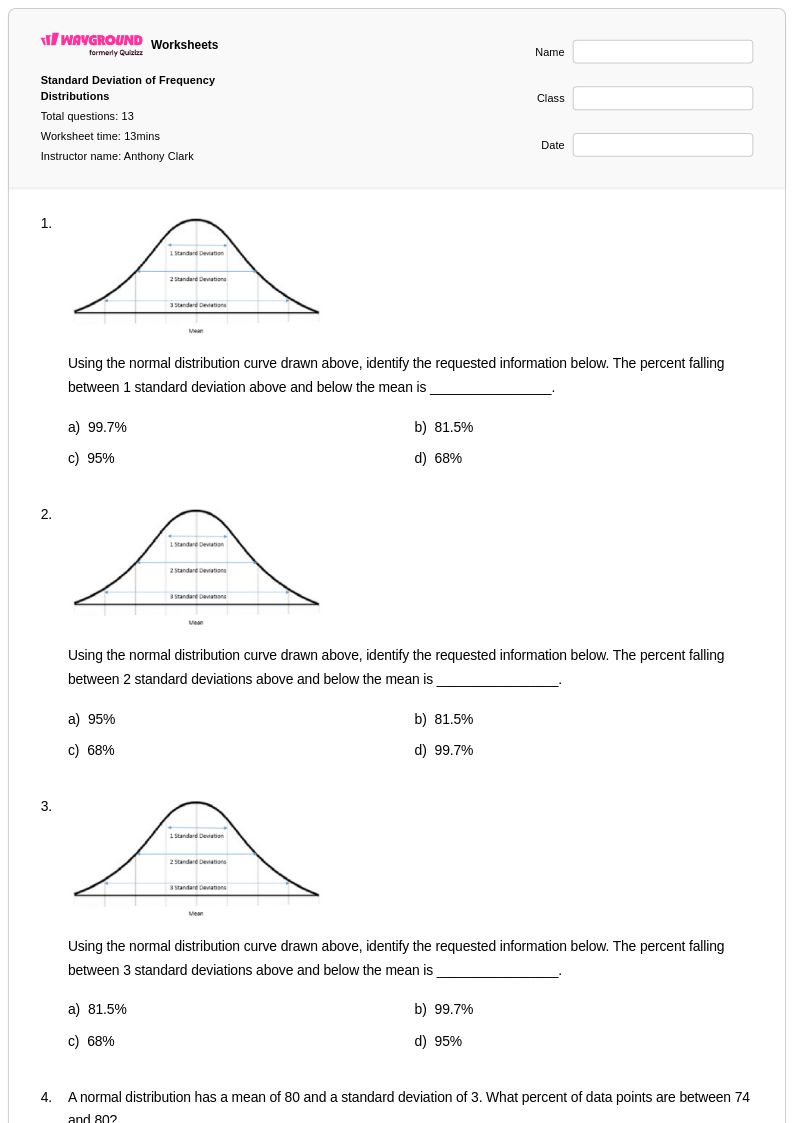
13 P
11th - Uni
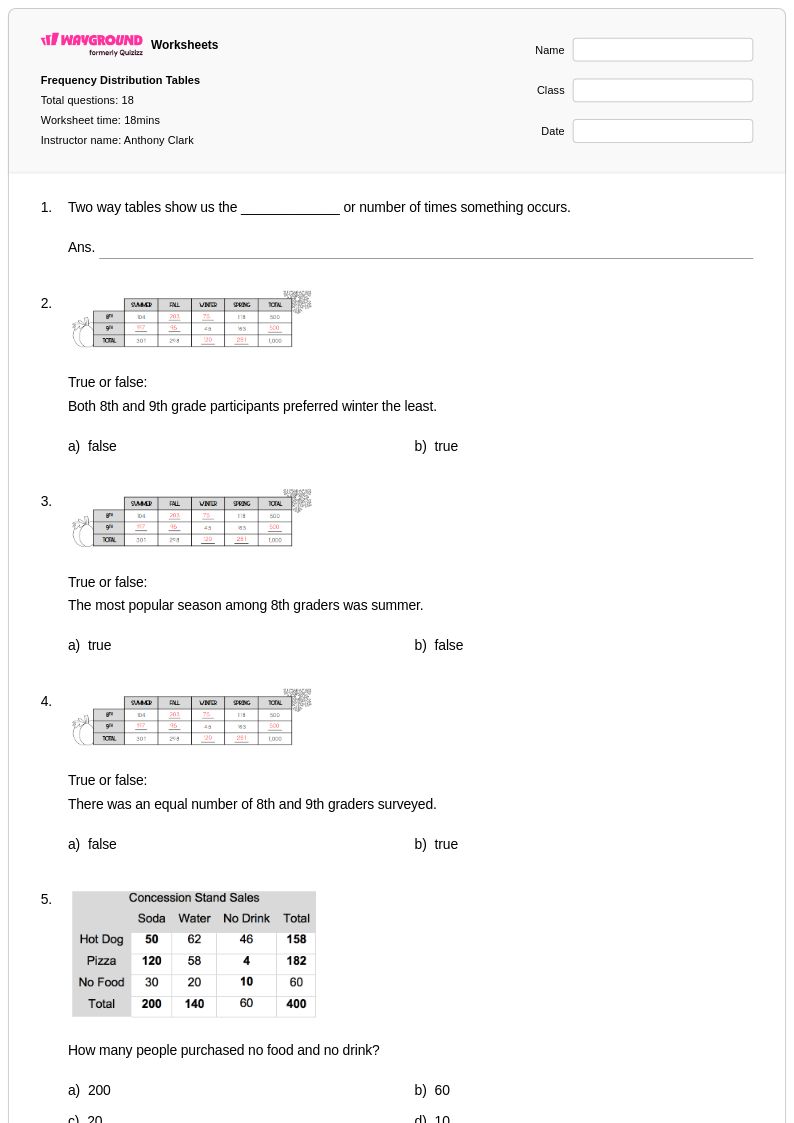
18 P
10th - Uni
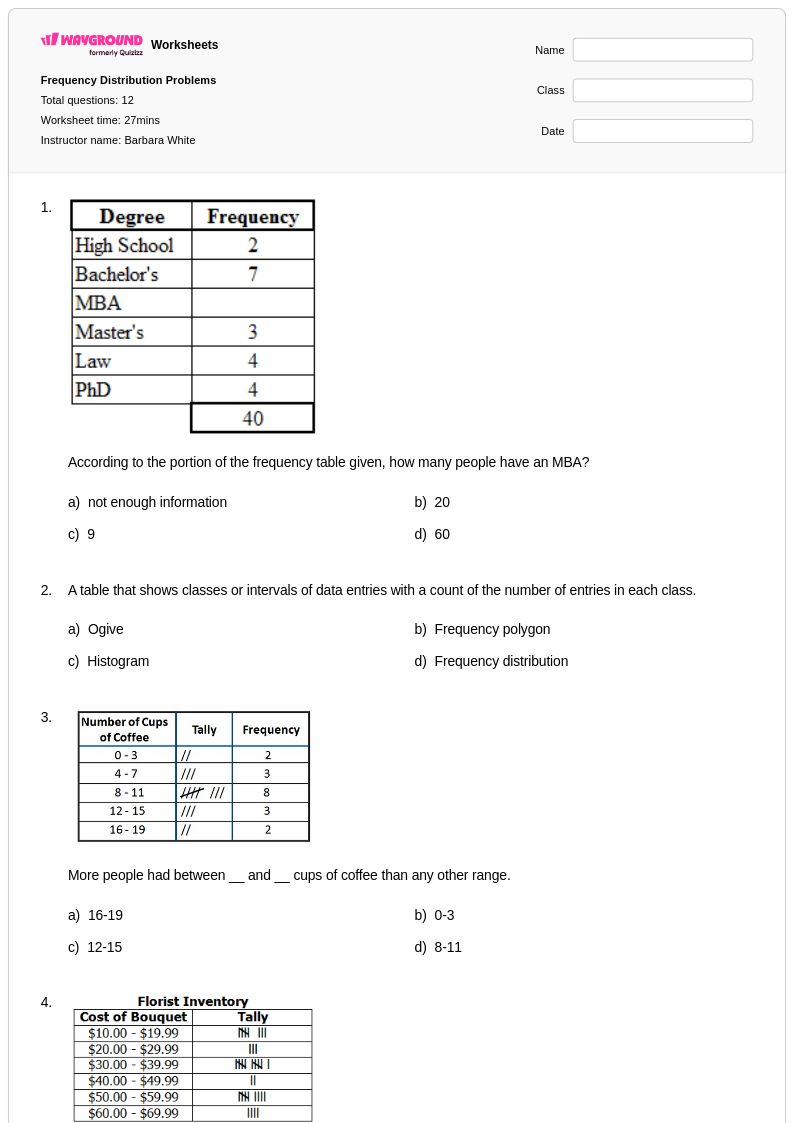
12 P
12th
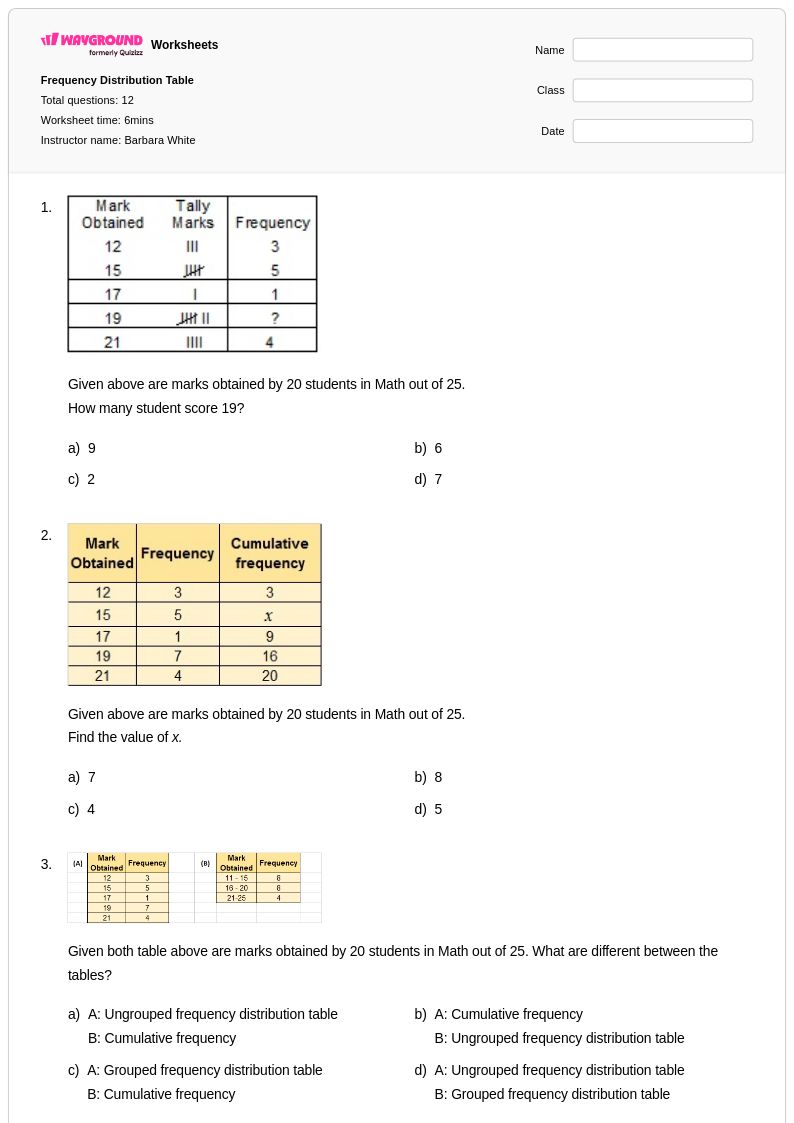
12 P
Uni
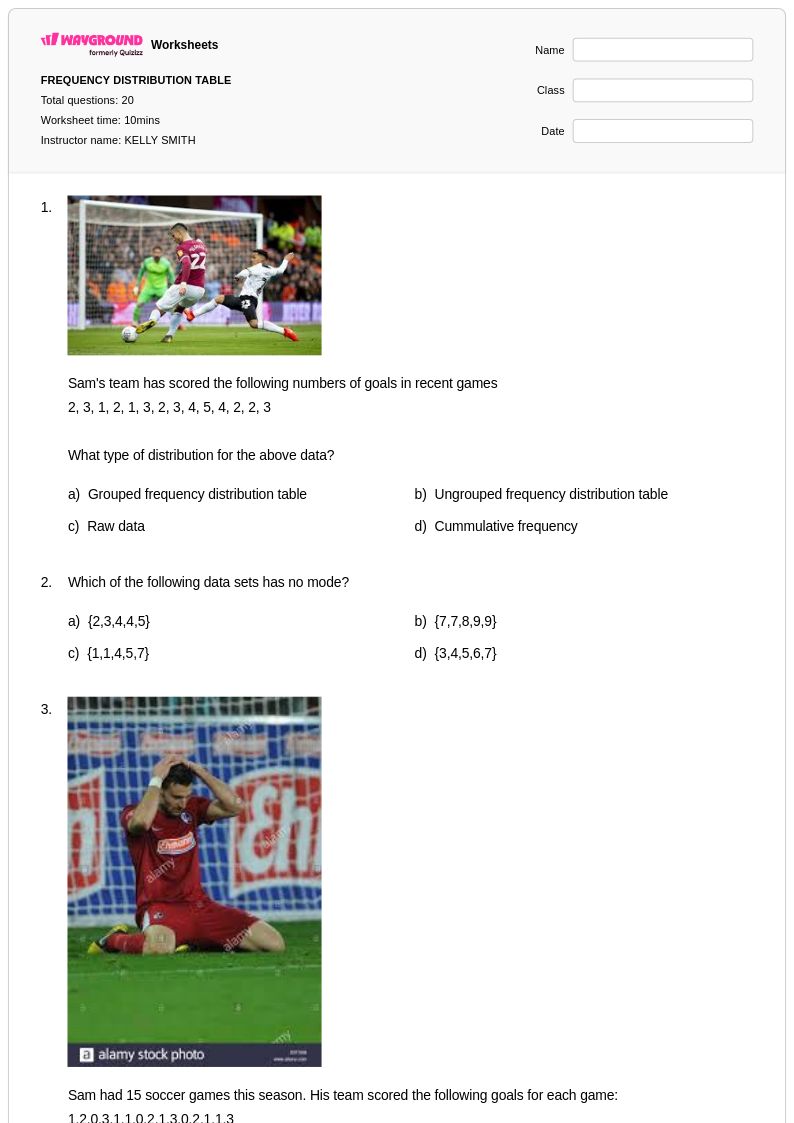
20 P
10th - 12th
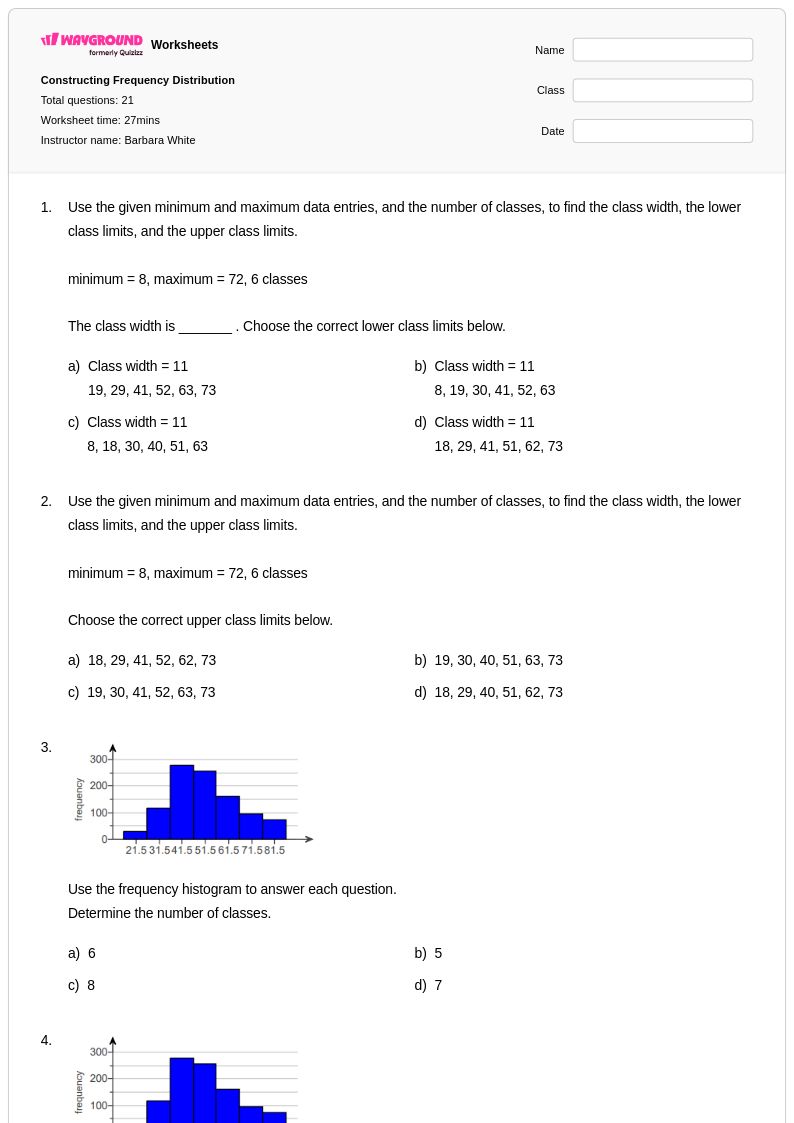
21 P
12th
Przeglądaj arkusze według tematów
Explore printable Frequency Distribution worksheets
Frequency distribution worksheets available through Wayground (formerly Quizizz) provide comprehensive practice materials that help students master the fundamental concepts of organizing, analyzing, and interpreting data sets. These carefully crafted mathematics resources focus on teaching students how to construct frequency tables, create histograms, and understand the relationship between raw data and its organized representation. The worksheets strengthen essential statistical skills including data classification, interval determination, cumulative frequency calculations, and graphical representation techniques. Students work through practice problems that range from simple tally charts to complex grouped frequency distributions, with each worksheet including a complete answer key to support independent learning and self-assessment. These free printables offer structured approaches to understanding how frequency distributions reveal patterns, central tendencies, and data spread in real-world contexts.
Wayground (formerly Quizizz) supports mathematics educators with an extensive collection of frequency distribution worksheet resources created by millions of teachers worldwide. The platform's robust search and filtering capabilities allow instructors to quickly locate materials that align with specific curriculum standards and match their students' skill levels. Teachers can easily customize existing worksheets or create new ones using the platform's differentiation tools, ensuring appropriate challenge levels for remediation and enrichment activities. The flexible format options include both printable pdf versions for traditional classroom use and digital formats for interactive learning environments. These comprehensive resources streamline lesson planning by providing ready-to-use materials that support systematic skill practice, formative assessment, and targeted instruction in probability and statistics concepts, enabling educators to effectively guide students through the complexities of data analysis and statistical reasoning.
FAQs
How do I introduce frequency distributions to my students?
What types of exercises help students practice frequency distributions?
What are the most common mistakes students make with frequency distributions?
How can I use this frequency distribution worksheet in my class?
How do frequency distributions fit into the math curriculum?
How can I support students who struggle with organizing data?