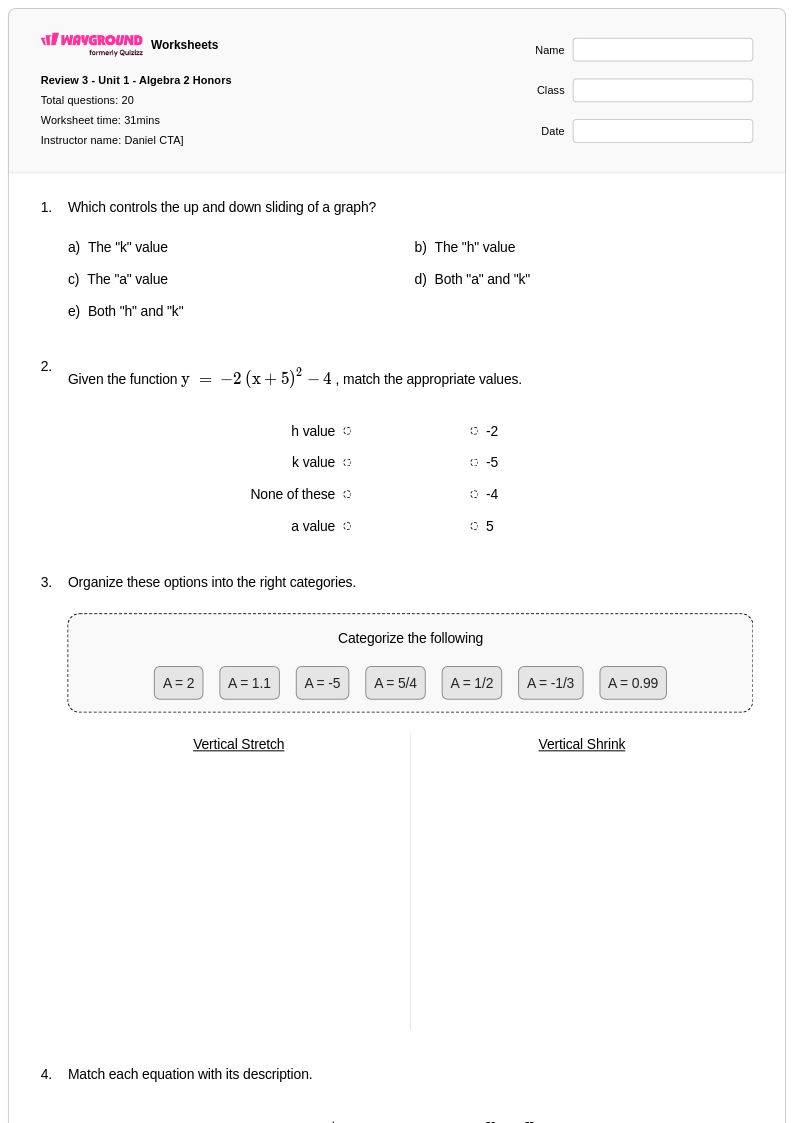
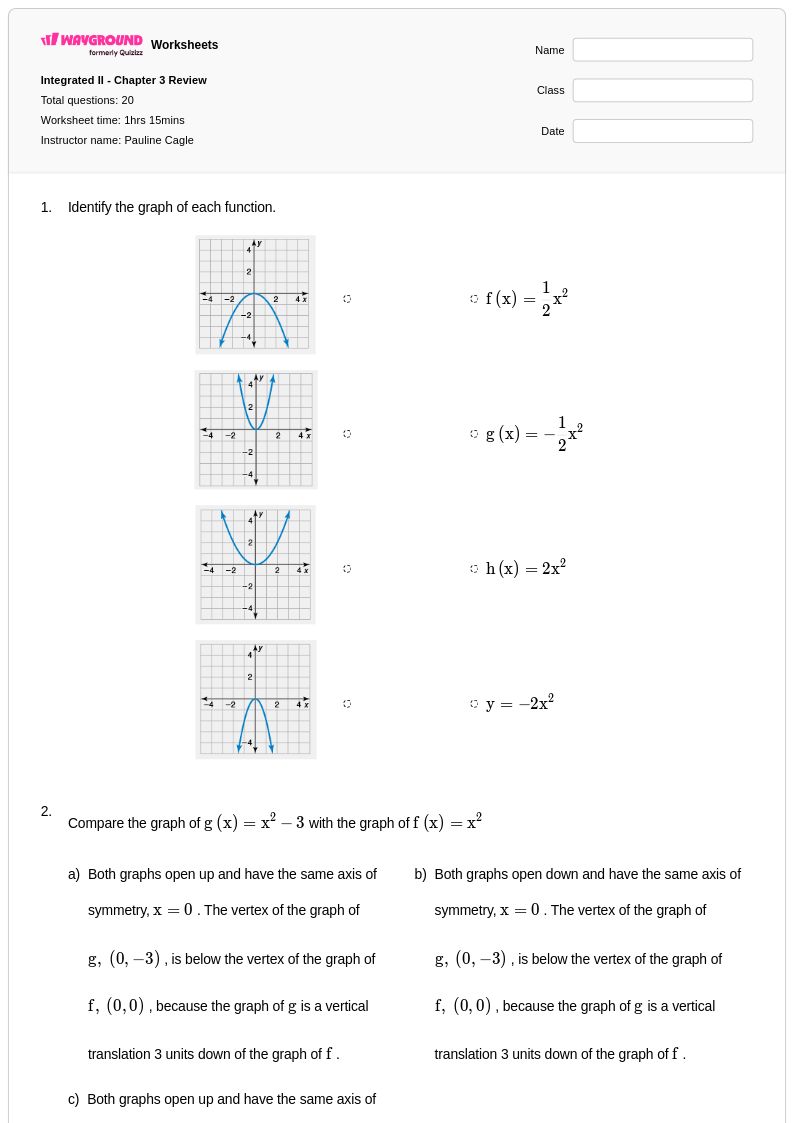
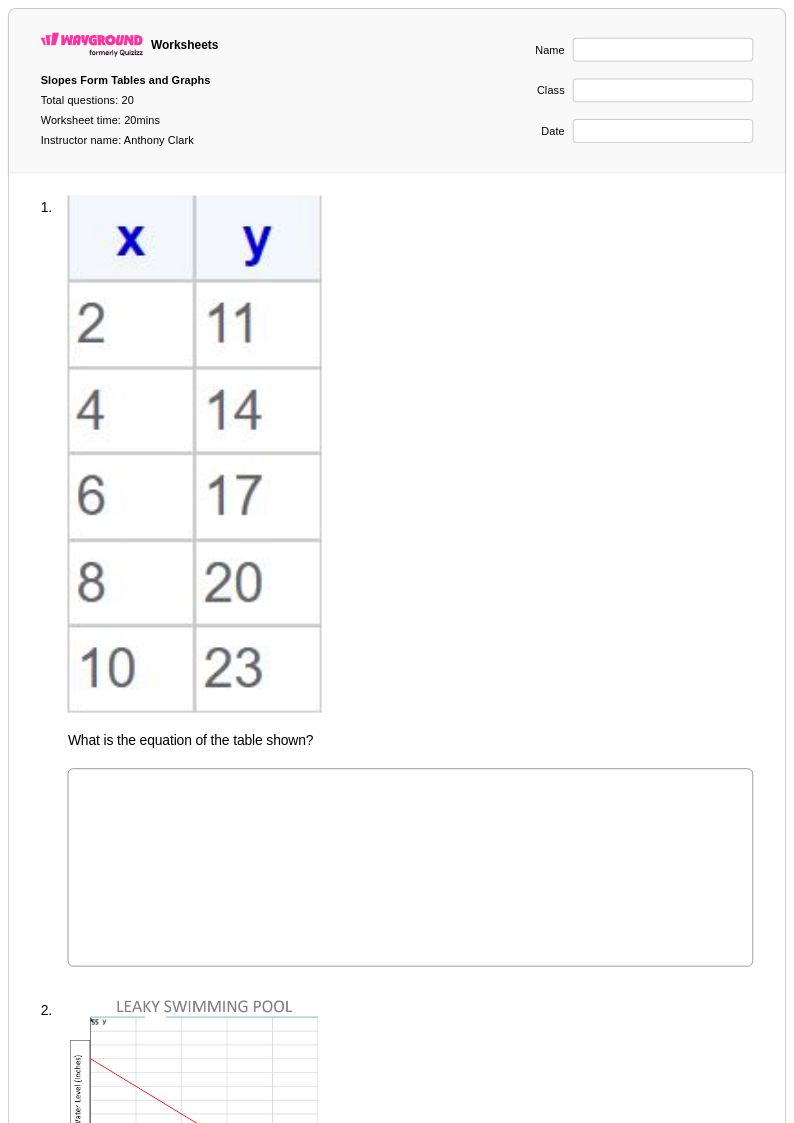
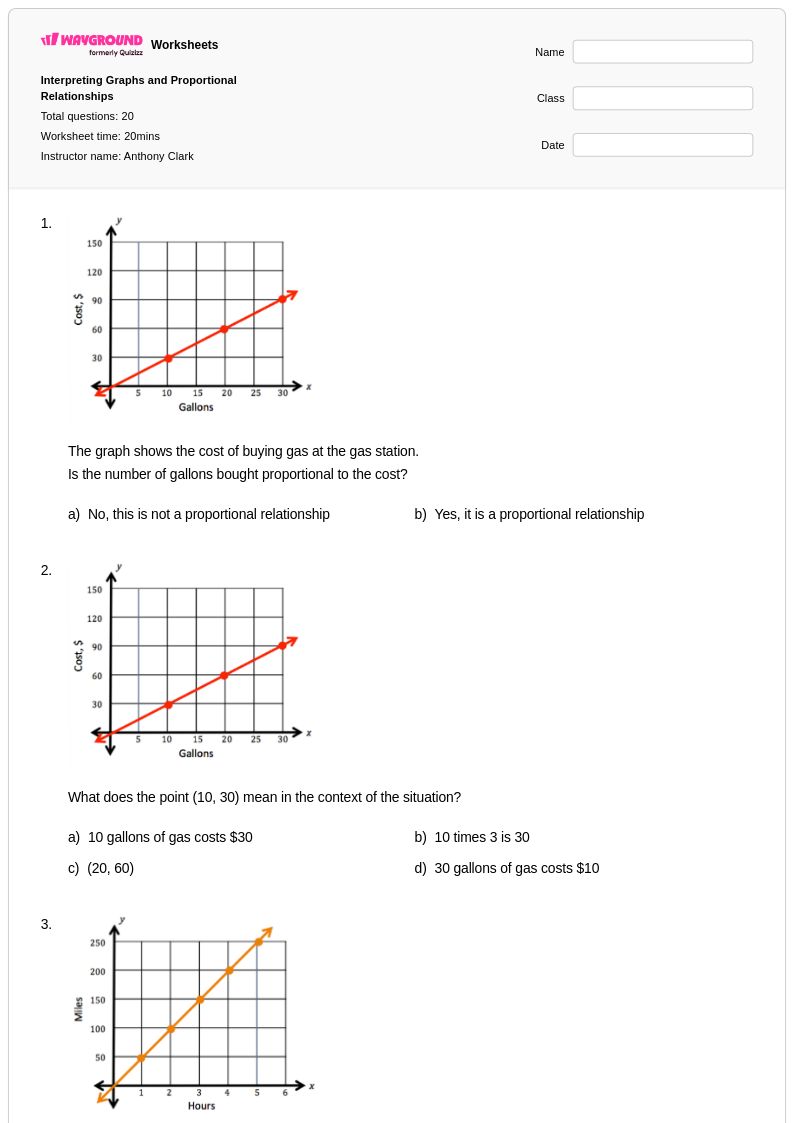
Free Printable Density Graphs Worksheets for Year 10
Free Year 10 density graphs worksheets and printables help students master interpreting and analyzing probability distributions through practice problems with comprehensive answer keys and downloadable PDFs.
Explore printable Density Graphs worksheets for Year 10
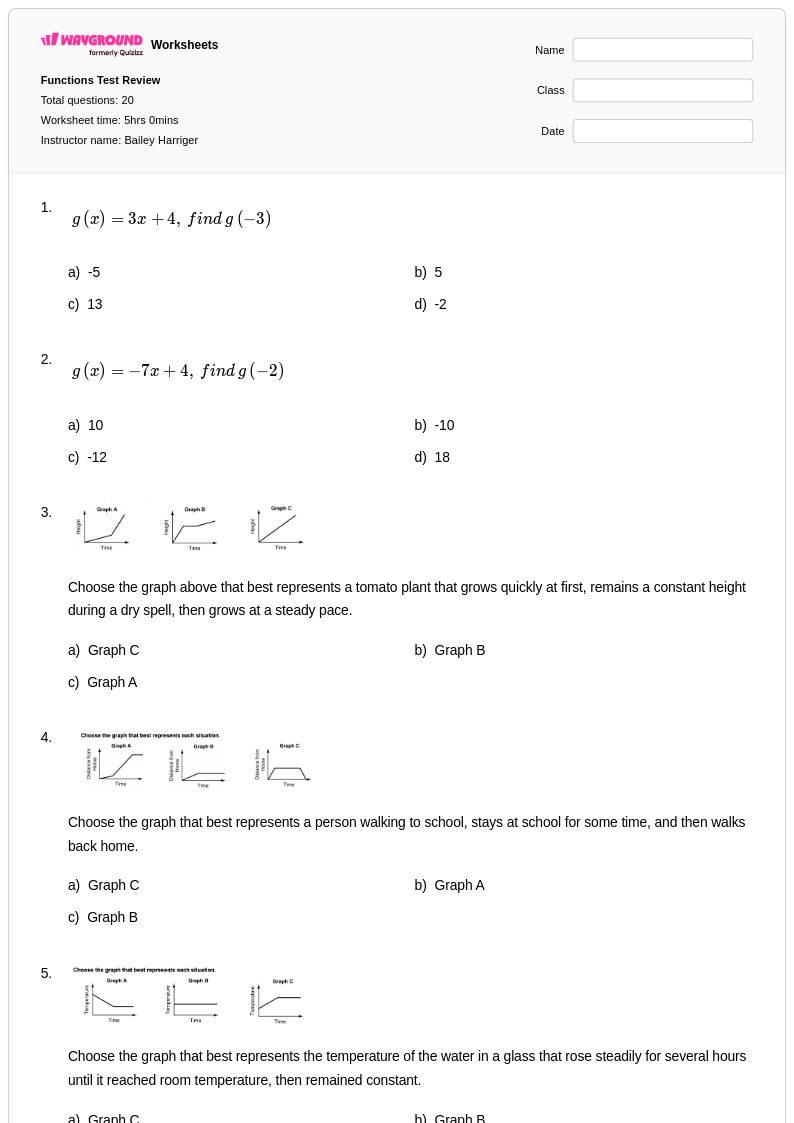
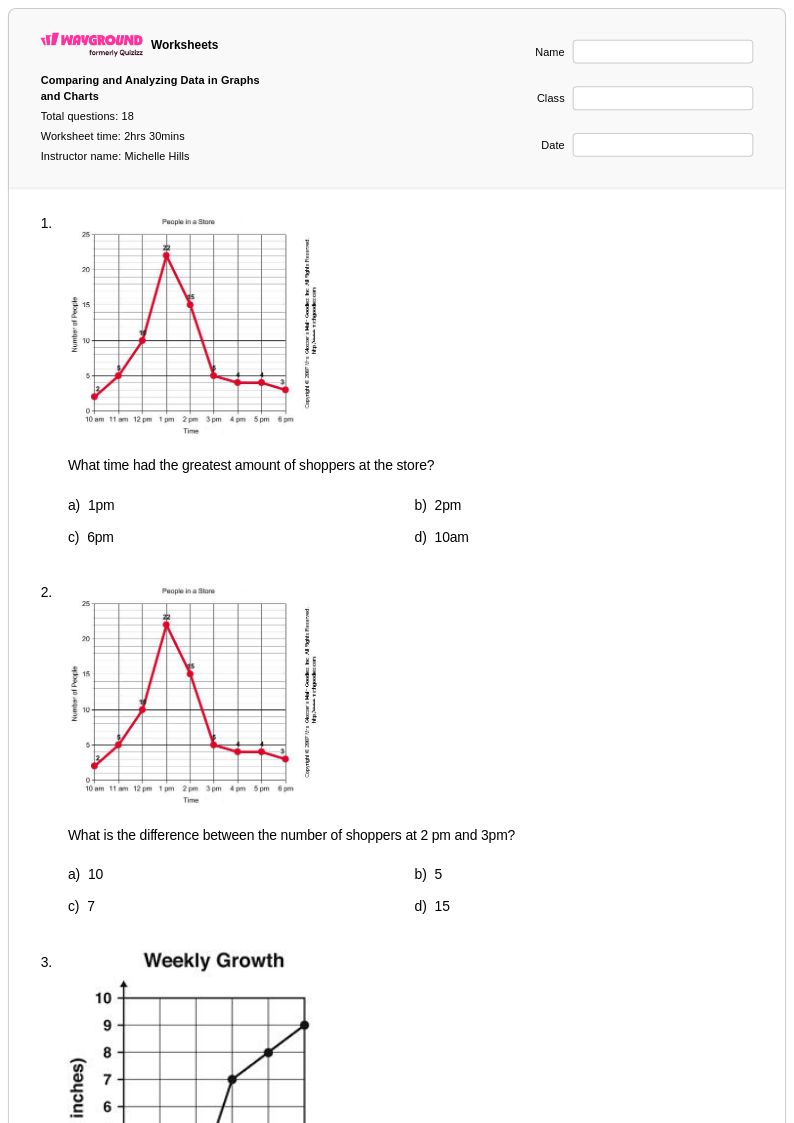
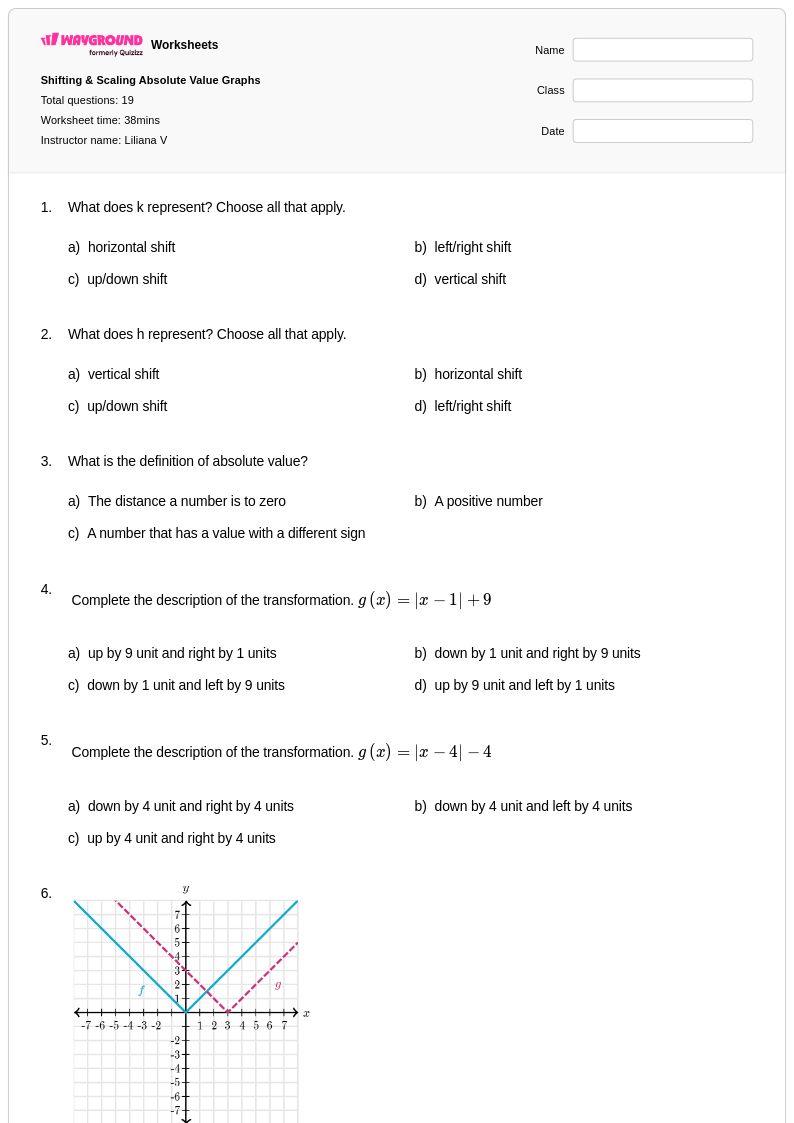
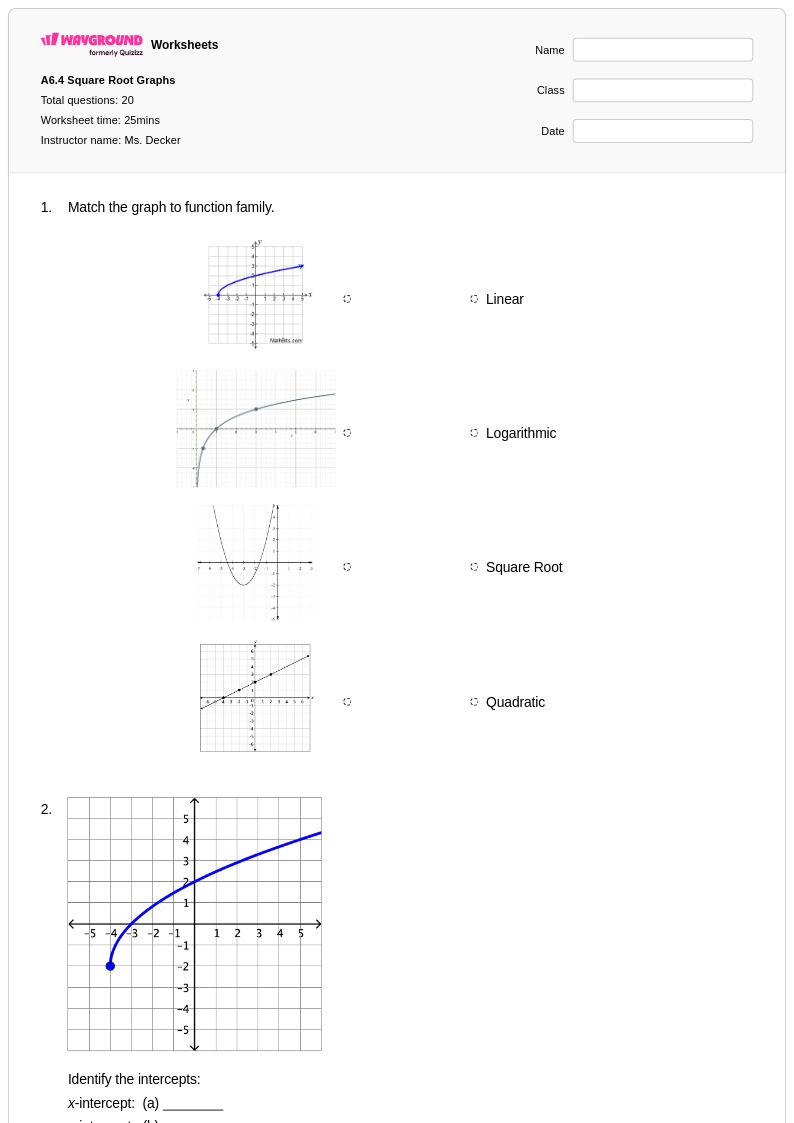
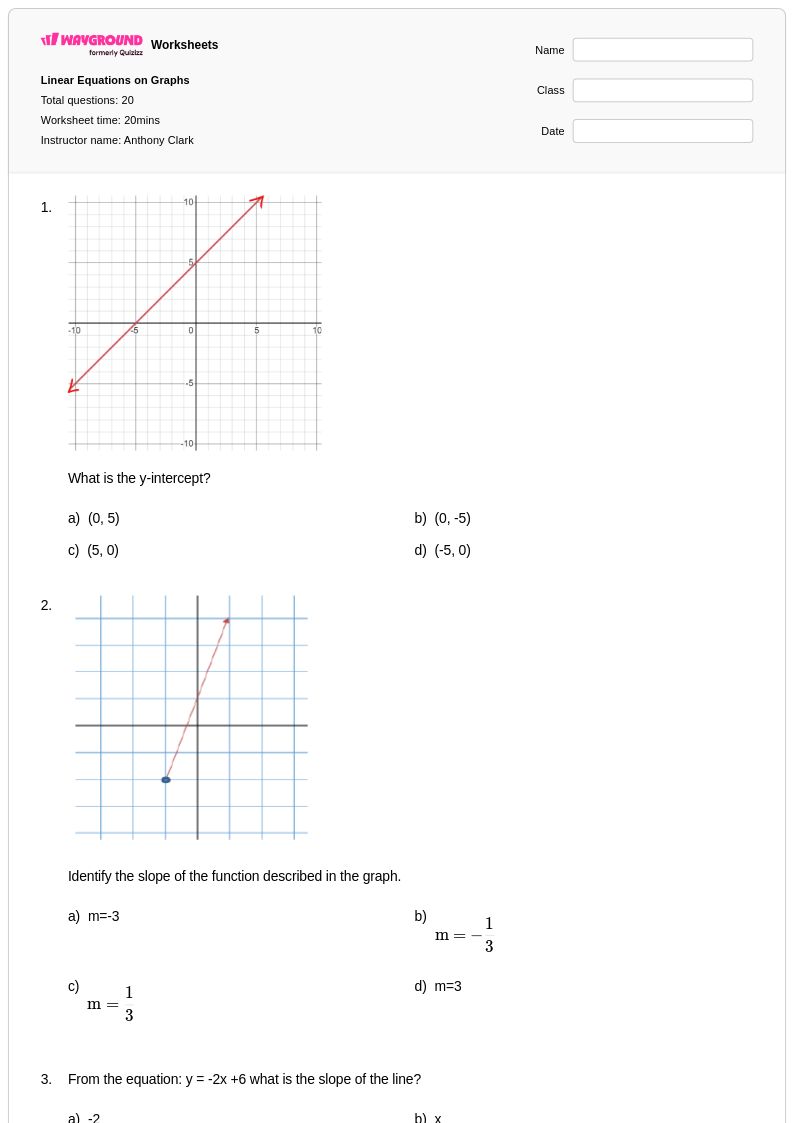
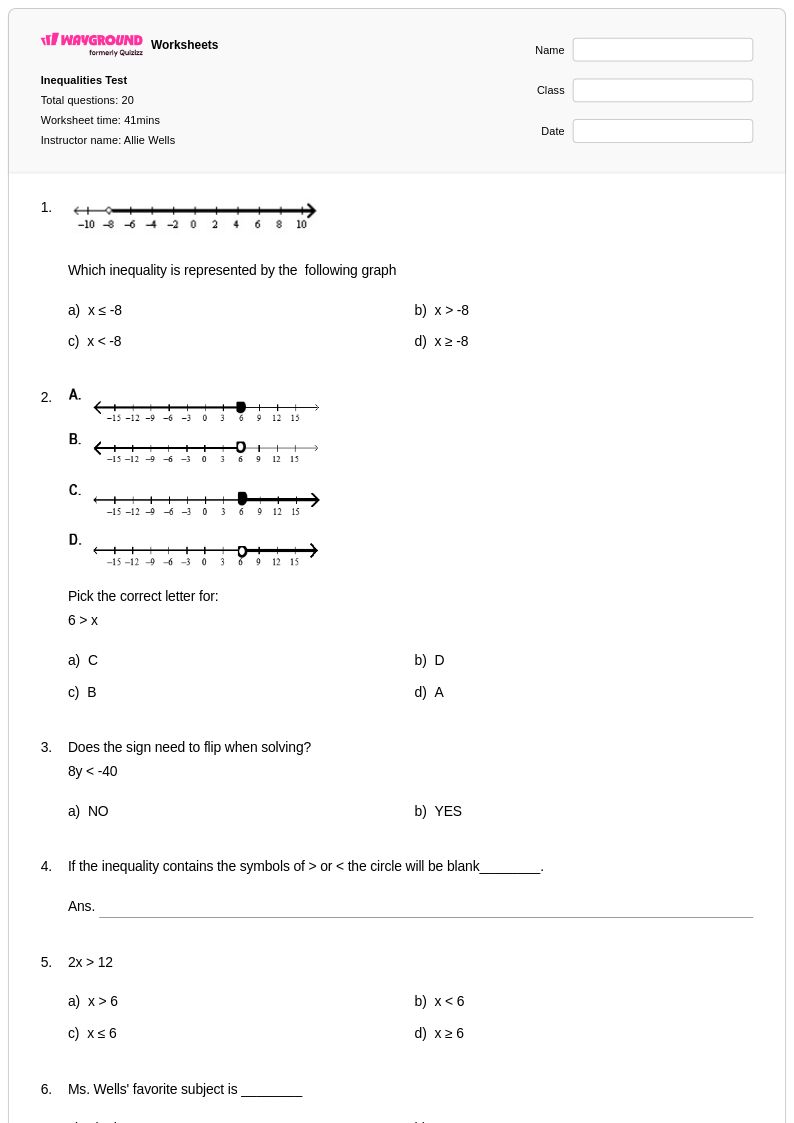
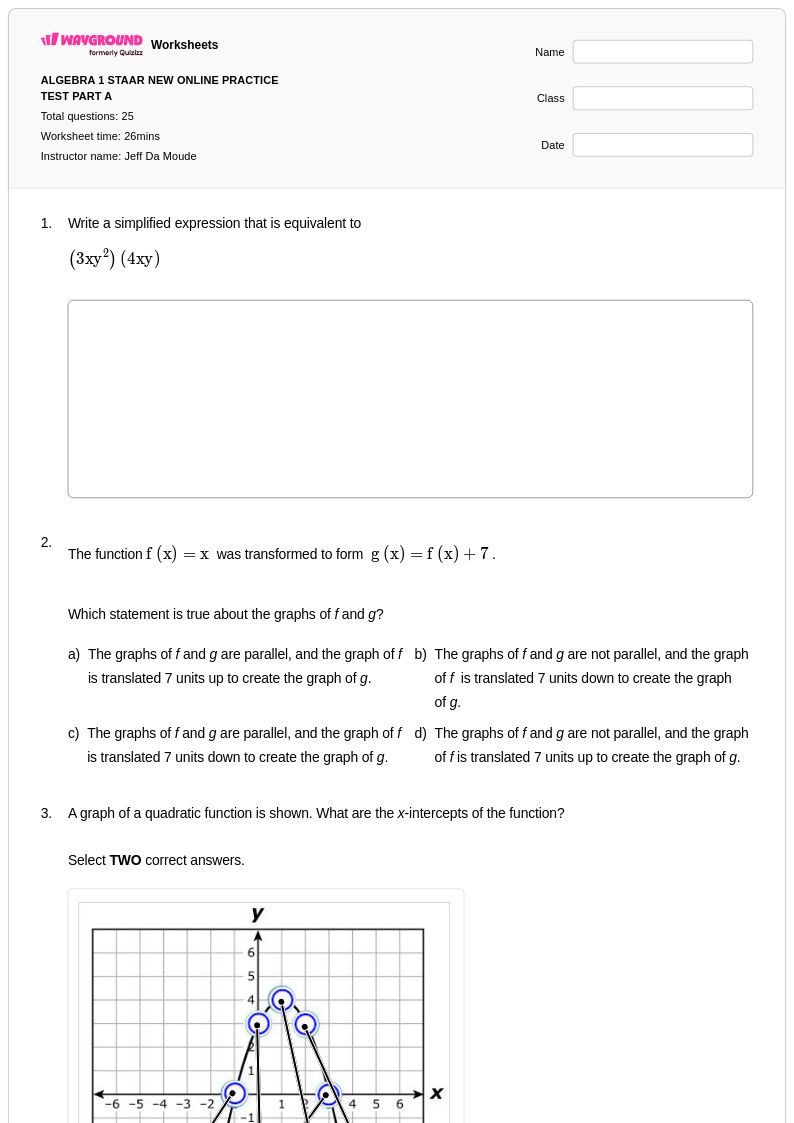
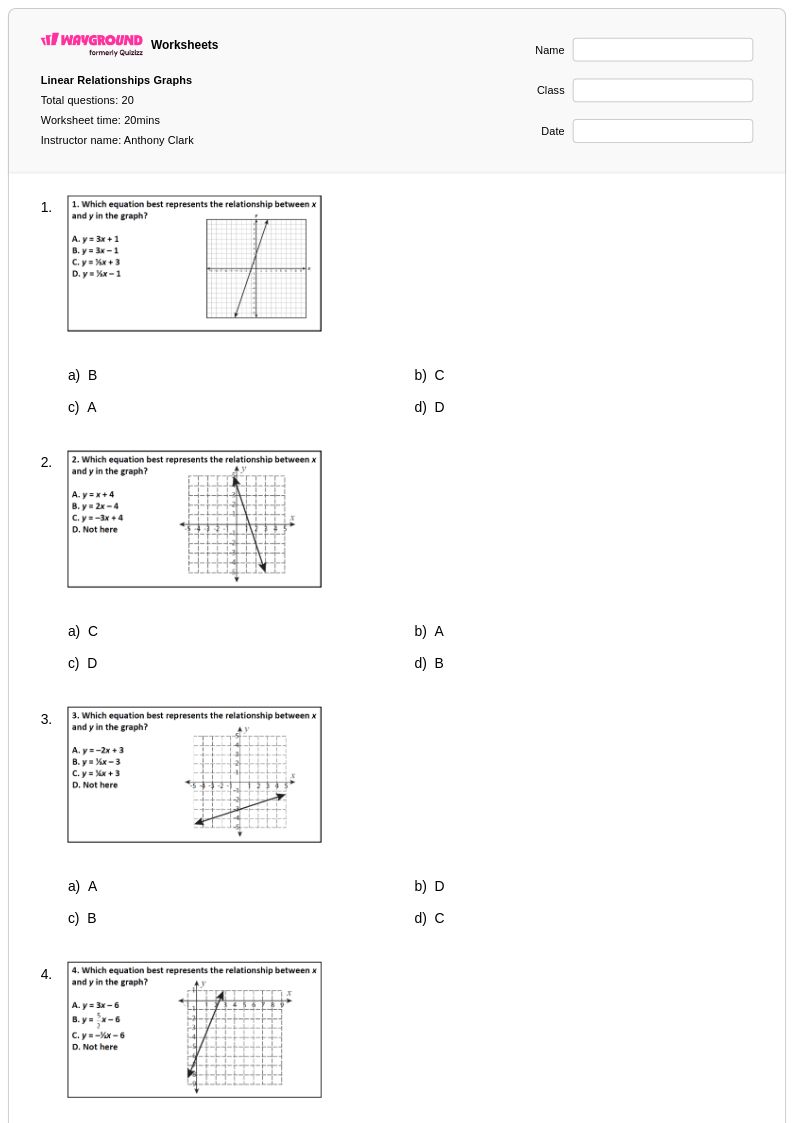
Density graphs represent a crucial statistical concept for Year 10 students, requiring them to interpret and analyze continuous probability distributions through visual representations. Wayground's comprehensive collection of density graph worksheets provides students with essential practice in reading, creating, and interpreting these fundamental statistical tools. These carefully designed resources help students master key skills including calculating areas under curves, understanding probability density functions, and connecting graphical representations to real-world statistical scenarios. The worksheets feature progressive difficulty levels with complete answer keys, ensuring students can check their work independently while building confidence in statistical reasoning. Available as free printables and downloadable pdf formats, these practice problems systematically develop students' ability to work with normal distributions, uniform distributions, and other continuous probability models that form the foundation of advanced statistical analysis.
Wayground's extensive library draws from millions of teacher-created resources specifically focused on density graphs and statistical visualization, offering educators unparalleled flexibility in lesson planning and student assessment. The platform's robust search and filtering capabilities allow teachers to quickly locate worksheets aligned with specific curriculum standards while providing differentiation tools that accommodate diverse learning needs within Year 10 classrooms. Teachers can seamlessly customize existing materials or combine multiple resources to create targeted practice sets for remediation or enrichment purposes. The dual availability of printable worksheets and interactive digital formats ensures compatibility with various teaching environments, whether educators need traditional paper-based activities or technology-integrated lessons. This comprehensive approach supports effective skill practice by enabling teachers to provide consistent, high-quality materials that reinforce density graph concepts through multiple learning modalities and assessment opportunities.
FAQs
How do I teach density graphs effectively to 10th graders?
By Grade 10, students should be ready to move beyond just describing curve shapes and start calculating probabilities from them. The key teaching move is making the area-equals-probability rule operational: give students a uniform distribution first, where area is a simple rectangle calculation, then transition to the normal curve where they use tables or technology. Pairing every calculation with a real-world interpretation, 'this means roughly 16% of bulbs will fail before 1,000 hours', keeps the work from feeling like abstract symbol manipulation.
What do Grade 10 density graph worksheets typically cover?
At Grade 10, practice problems typically span: calculating areas under normal and uniform curves, identifying probabilities for given intervals, interpreting skewness and comparing distribution shapes, and connecting density graphs to cumulative distribution concepts. Wayground's Grade 10 worksheets are organized with progressive difficulty and include complete answer keys, so teachers can assign them for initial practice, review, or independent self-assessment.
What errors do 10th graders commonly make on density graph problems?
At this level, calculation errors tend to layer on top of the conceptual ones from earlier grades. Students often set up the correct shaded region but then subtract probabilities in the wrong direction — for example, finding P(X > a) by computing 1 − P(X < a) but forgetting that the total area is 1, not 100. They also frequently confuse the density function value with the cumulative probability, especially when problems switch between the two representations. A third common error: applying normal distribution assumptions to a distribution that is clearly skewed in the graph.
How do I use Wayground's Grade 10 density graph worksheets?
These worksheets are available as printable PDFs and as digital assignments you can host directly on Wayground. The digital format works well for immediate feedback — students see results as they go, and you get a class-level view of which problems tripped people up. Every worksheet includes a complete answer key regardless of format, so paper-based practice is equally self-sufficient for homework or independent review.
How do density graphs fit into the Grade 10 Common Core statistics progression?
Common Core's high school statistics strand expects students to use the normal distribution as a model for real-world data and to estimate population percentages using the empirical rule and normal curve areas. Grade 10 is typically where this becomes quantitative rather than just descriptive — students move from 'this distribution is roughly bell-shaped' to actually computing probabilities for specified intervals. Density graphs are the visual tool that makes this transition concrete: the curve is the model, and the shaded area is the answer.
How can I differentiate density graph practice for a mixed-ability Grade 10 class?
For students who find the visual interpretation challenging, Wayground lets you generate an alternate version of the same worksheet with larger font or wider spacing — same problems, more accessible layout. For students who need support processing written question stems, the Read Aloud accommodation reads questions aloud so the barrier isn't language. On the other end, the platform's filtering tools let you pull higher-difficulty problems involving cumulative distributions or multi-step probability calculations for students who are ready to go further.