
12 P
6th - 8th
20 P
7th
25 P
7th
12 P
7th
21 P
6th - 9th
15 P
7th
27 P
7th
40 P
7th
15 P
6th - 9th
10 P
7th
8 P
6th - Uni

11 P
6th - 10th
19 P
7th
21 P
6th - 8th

11 P
6th - 10th

11 P
6th - 10th
16 P
7th

20 P
7th
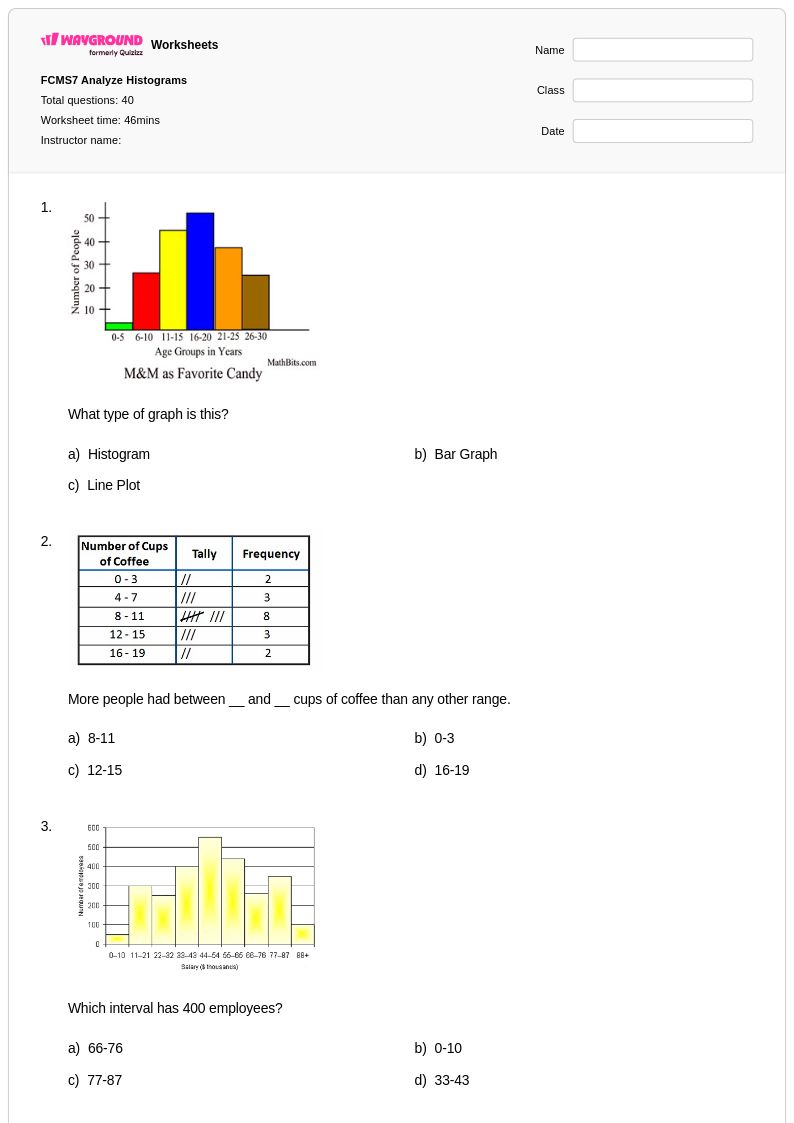
![Interpreting Visuals [7.SP.4] - Nadający się do druku Histograms Worksheets Year 7 - Quizizz](https://quizizz-static.s3.amazonaws.com/_media/worksheets-new/632321f8bc6a79001d175365-interpreting-visuals-7sp4)
15 P
7th
8 P
7th
13 P
6th - Uni
10 P
6th - 8th
20 P
7th
13 P
7th
Przeglądaj inne arkusze tematyczne dla year 7
Explore printable Histograms worksheets for Year 7
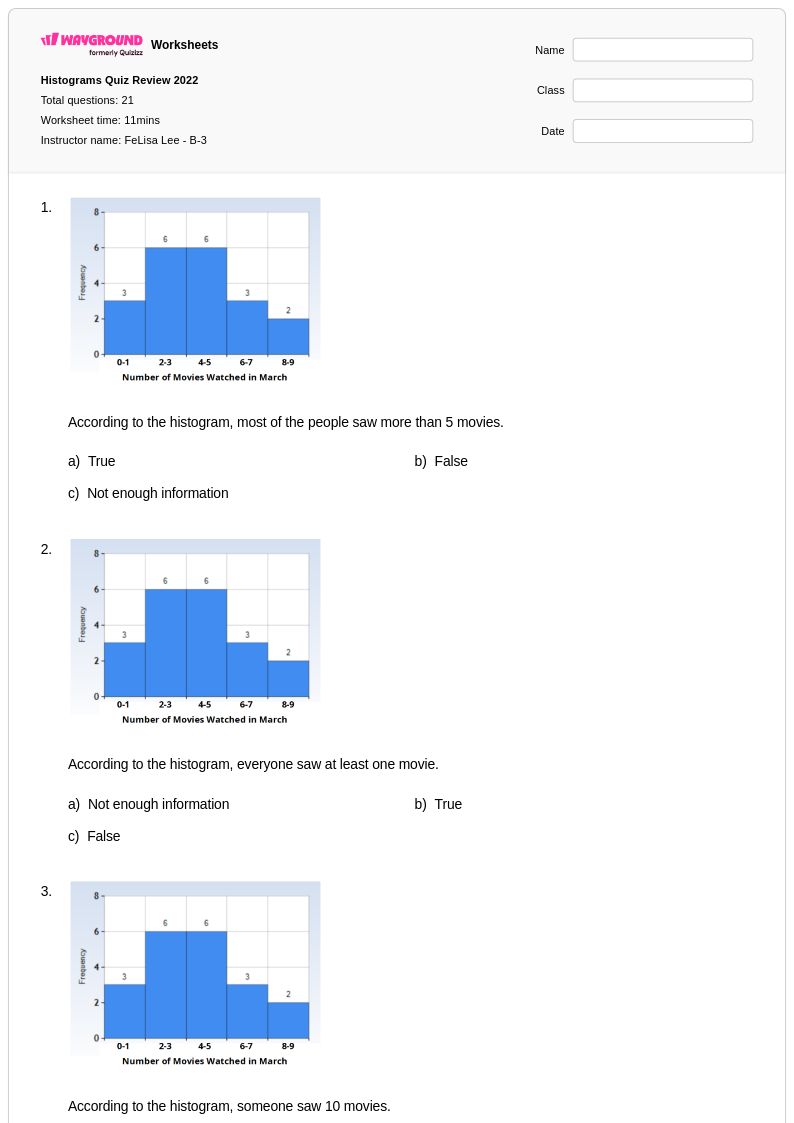
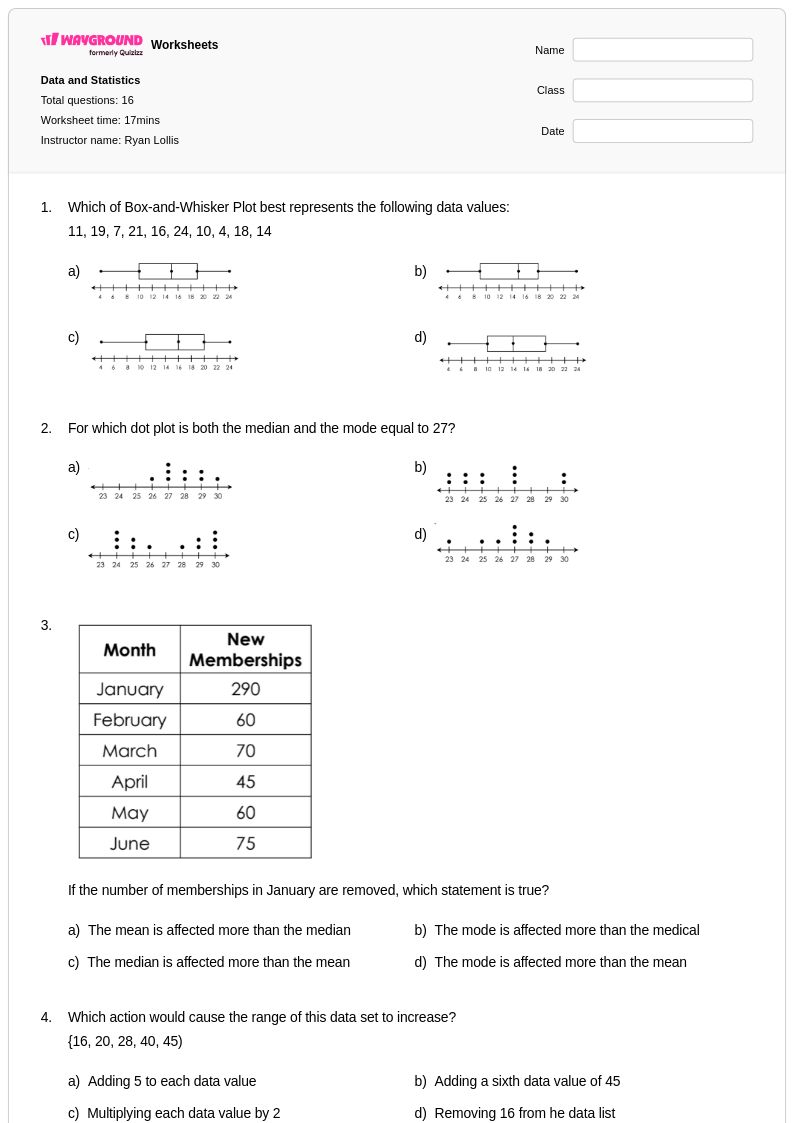
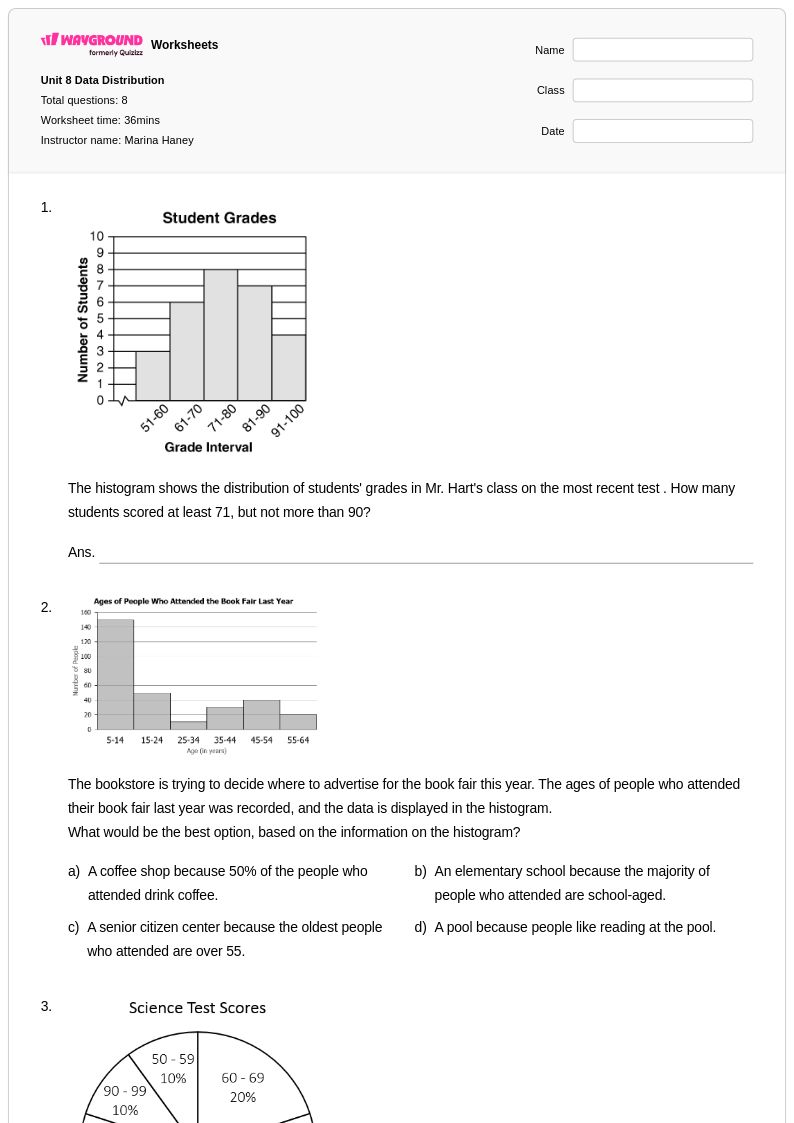
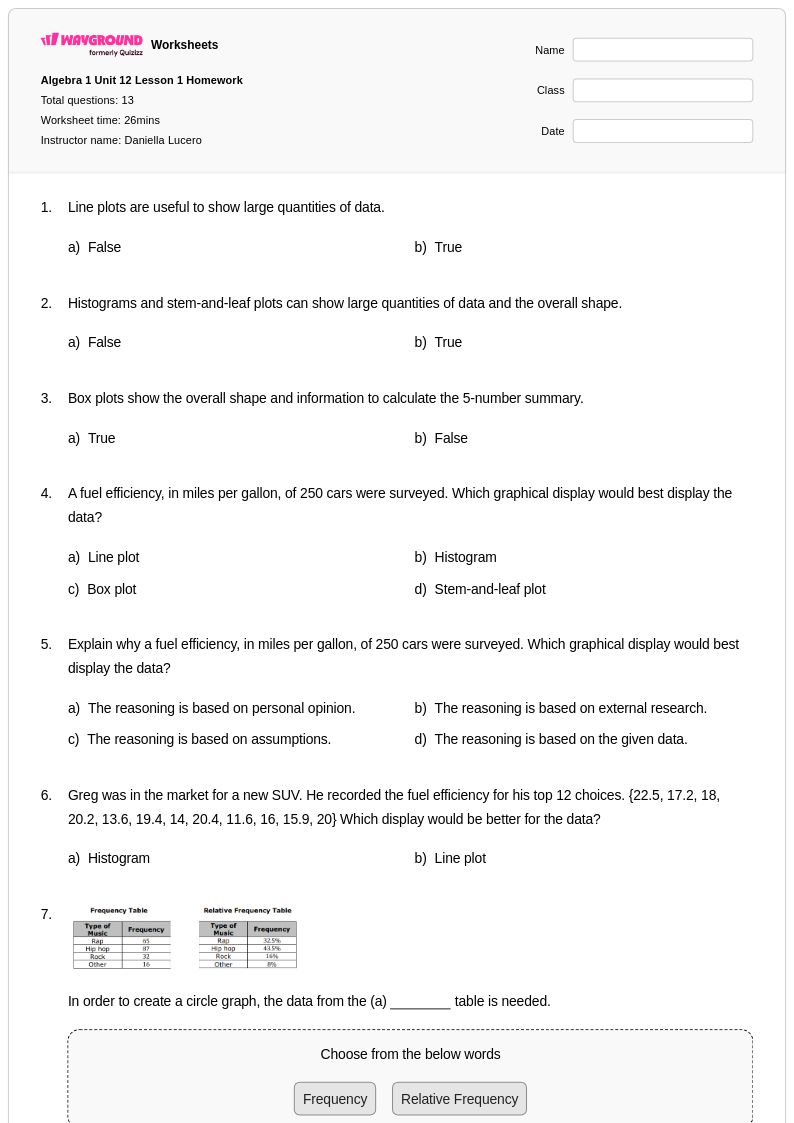
Histograms for Year 7 students represent a critical component of data visualization skills that bridge basic graphing concepts with more sophisticated statistical analysis. Through Wayground's comprehensive collection of histogram worksheets, seventh-grade students develop essential competencies in organizing data into intervals, determining appropriate bin widths, and interpreting frequency distributions across various real-world contexts. These carefully structured practice problems guide students through the fundamental steps of histogram construction, from raw data collection to final graph interpretation, while reinforcing key mathematical concepts such as range, frequency, and data distribution patterns. Each worksheet includes detailed answer keys and comes in convenient PDF format, making them accessible as both free printables for classroom use and digital resources for independent study, ensuring students can practice these vital graphing skills across multiple learning environments.
Wayground, formerly Quizizz, empowers Year 7 mathematics teachers with an extensive library of millions of teacher-created histogram resources that streamline lesson planning and enhance instructional effectiveness. The platform's robust search and filtering capabilities allow educators to quickly locate worksheets aligned with specific curriculum standards and learning objectives, while built-in differentiation tools enable teachers to customize content complexity for diverse learner needs. These histogram worksheet collections are available in both printable PDF formats for traditional classroom distribution and interactive digital versions for technology-integrated instruction, providing maximum flexibility for various teaching scenarios. Teachers utilize these resources for targeted skill practice, remediation support for struggling students, and enrichment opportunities for advanced learners, with the comprehensive answer keys and detailed solutions facilitating efficient grading and enabling productive classroom discussions about data interpretation strategies and histogram analysis techniques.