
20 Q
9th - Uni
10 Q
7th
10 Q
6th
15 Q
6th
15 Q
6th
15 Q
6th
20 Q
6th - Uni
13 Q
6th - Uni
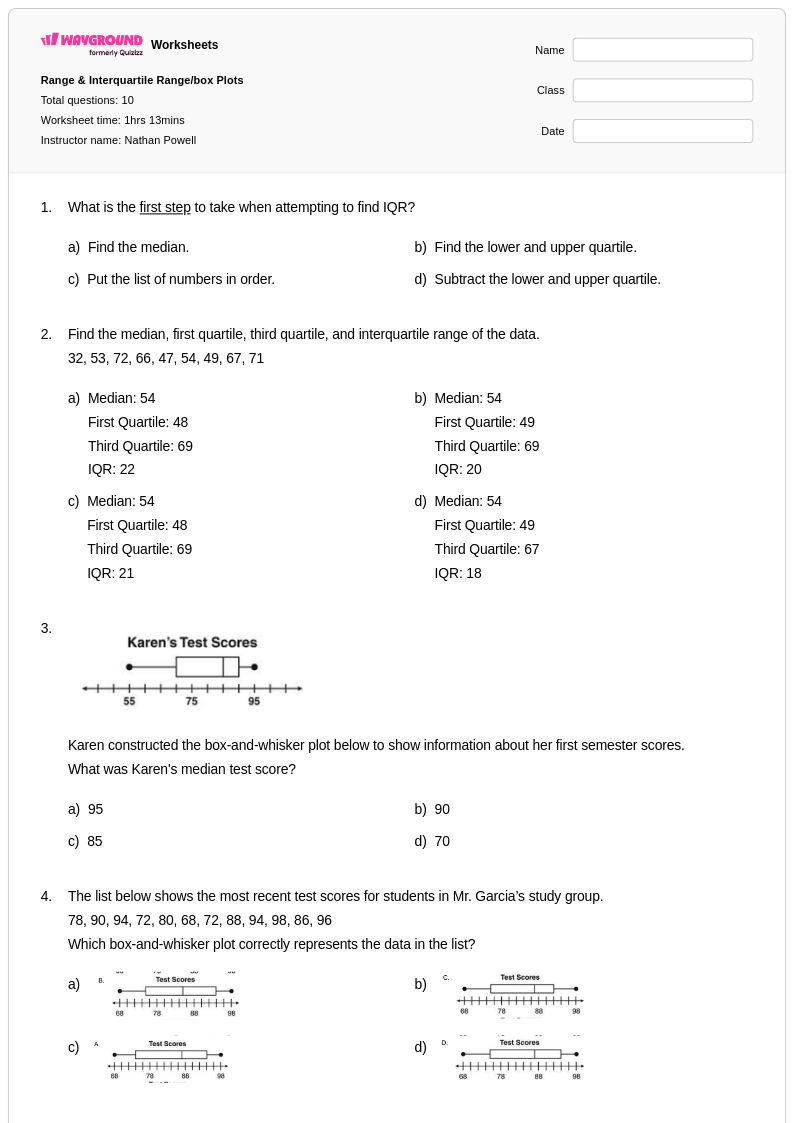
10 Q
6th
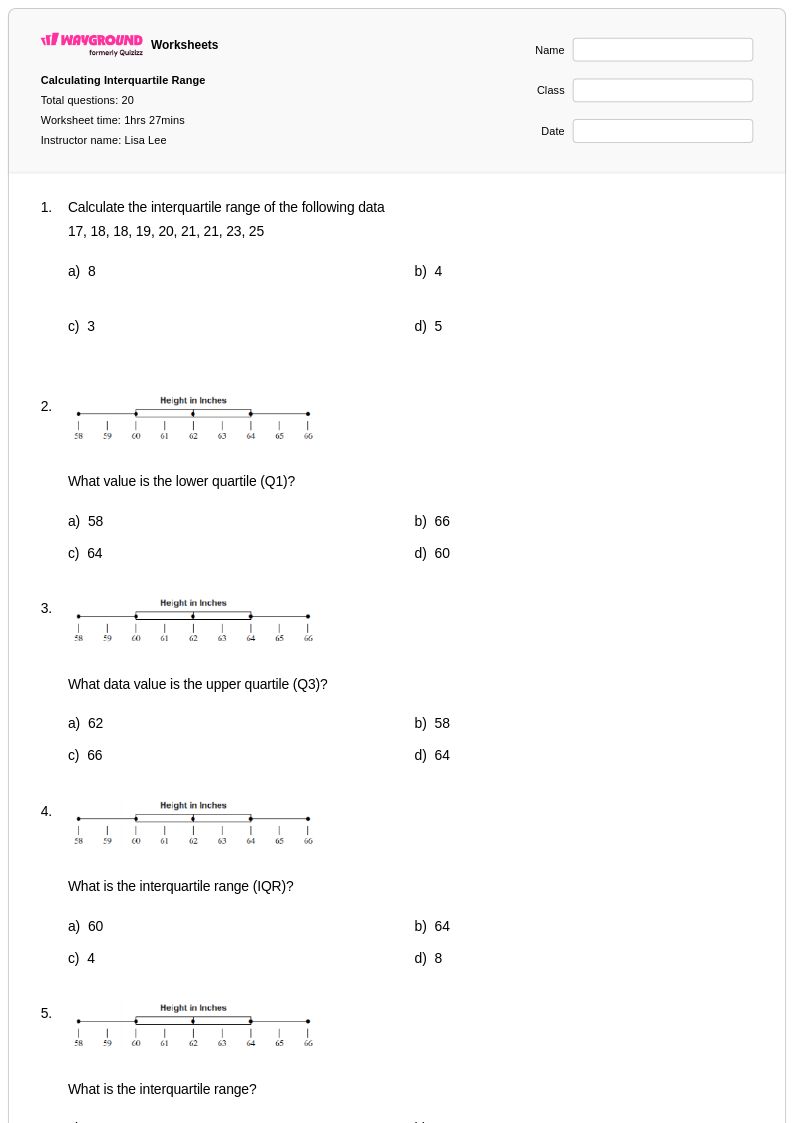
20 Q
6th
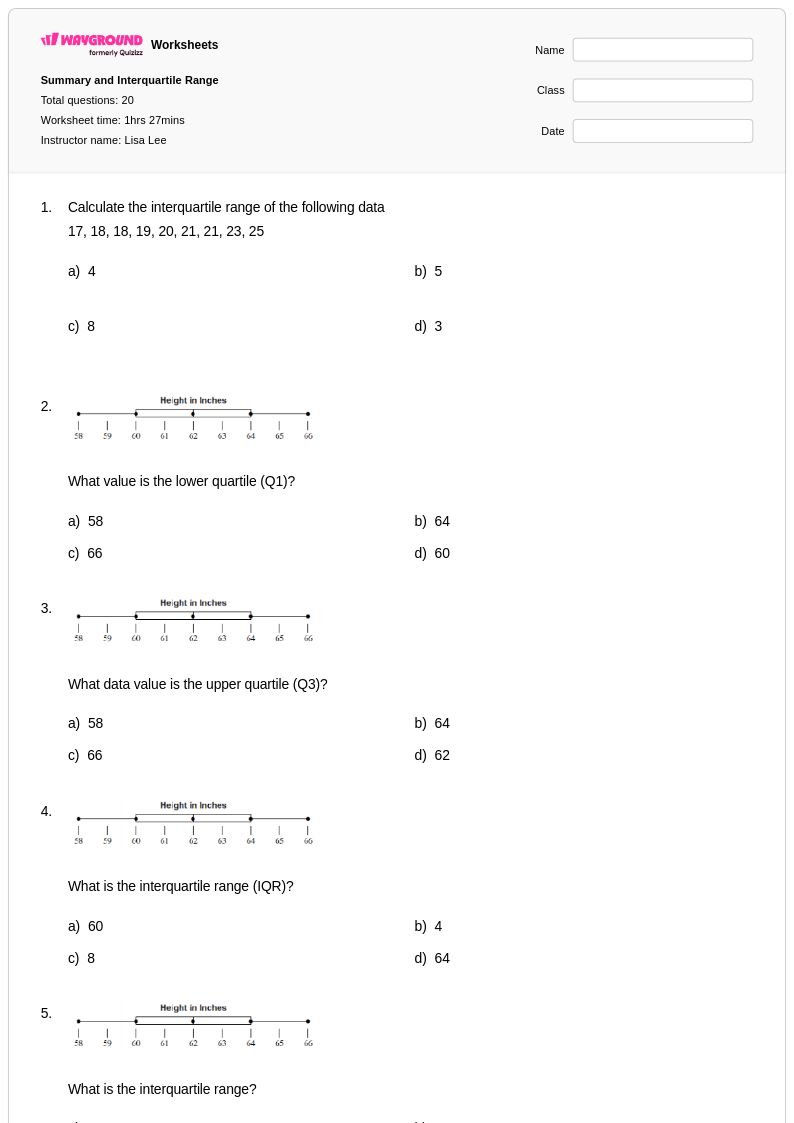
20 Q
6th
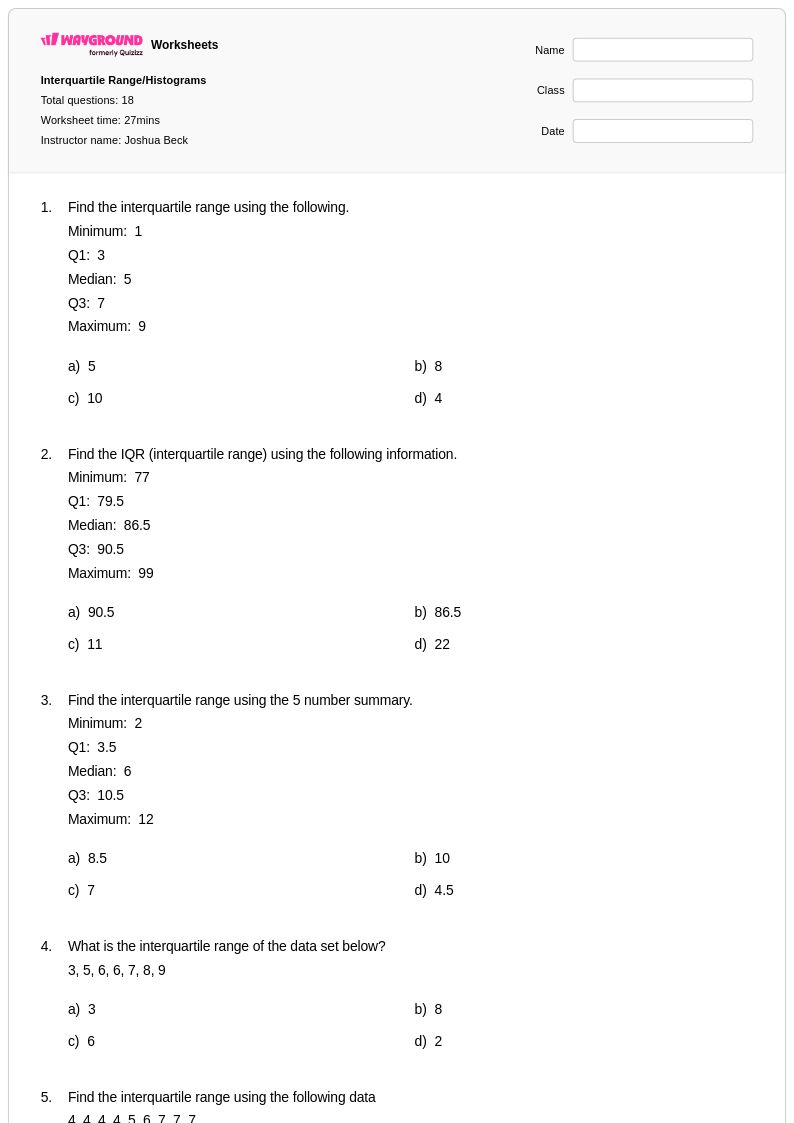
18 Q
6th - 7th
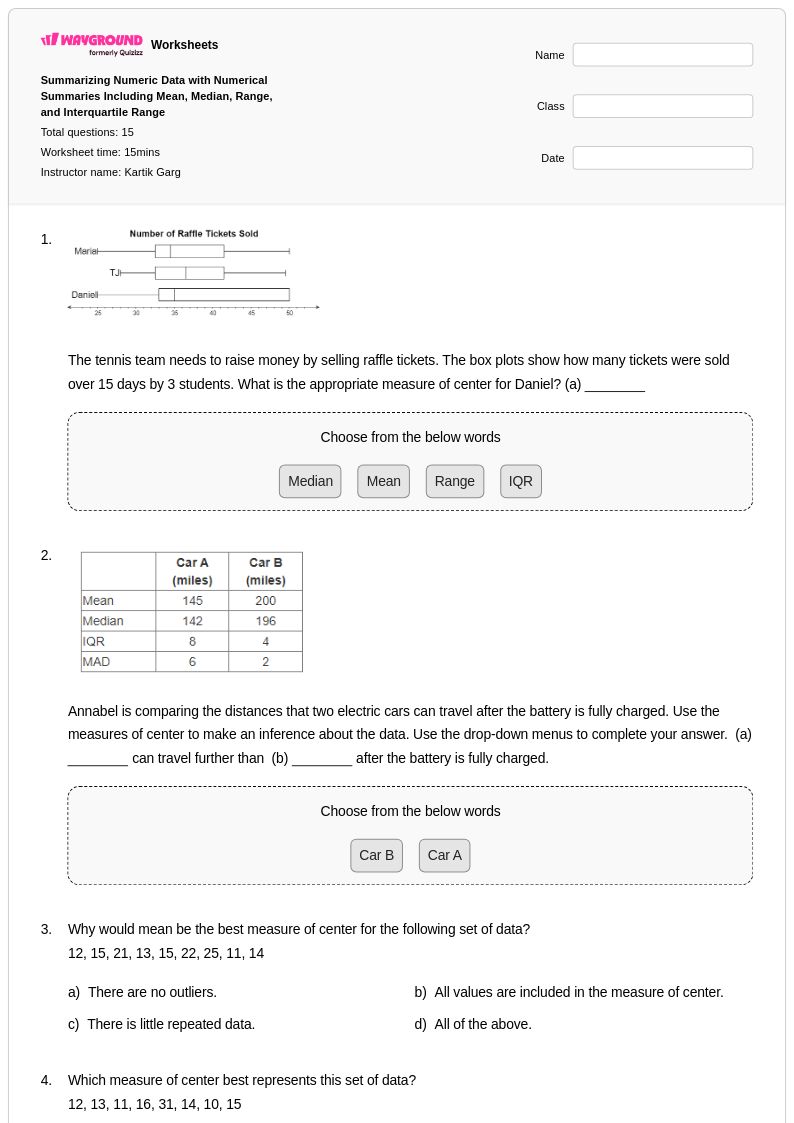
15 Q
6th
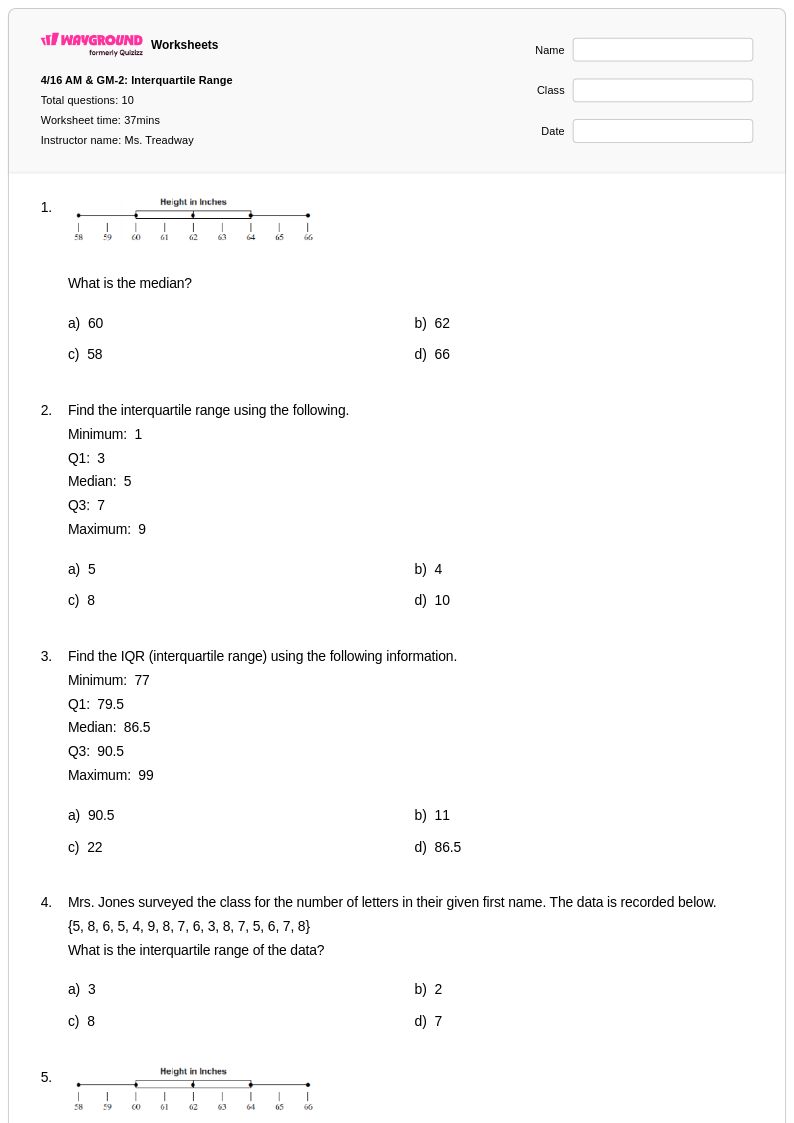
10 Q
6th
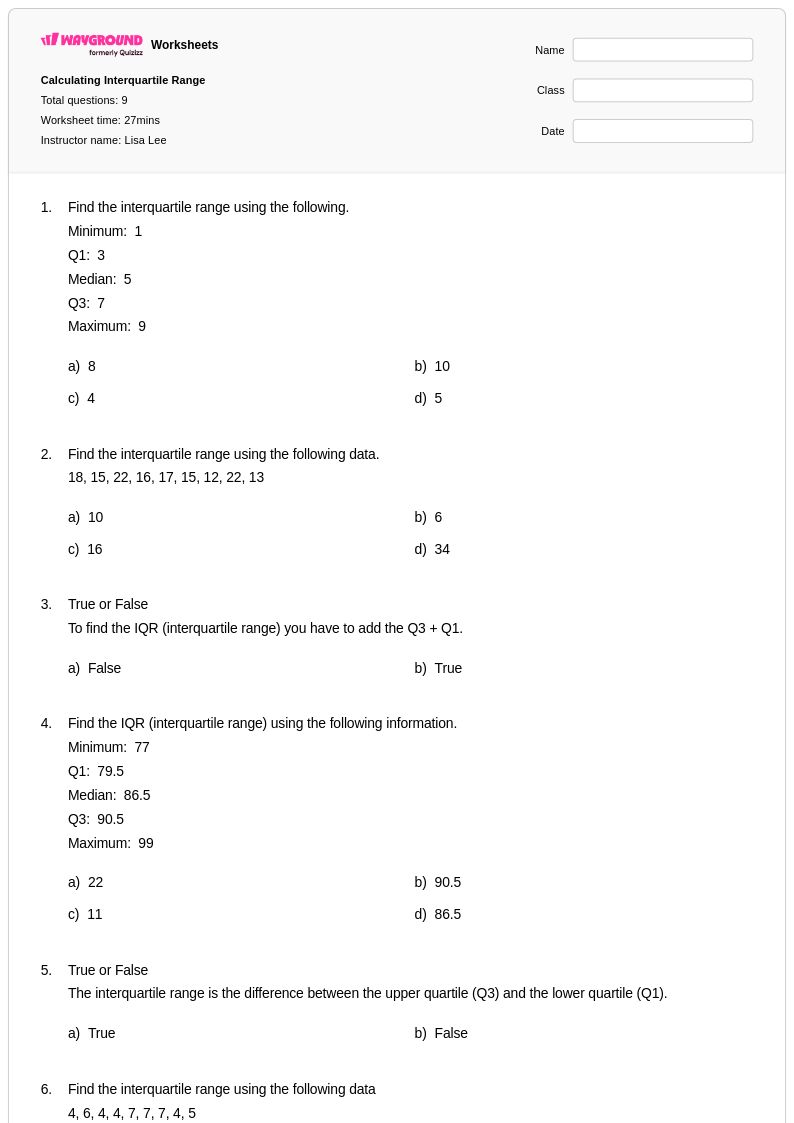
9 Q
6th
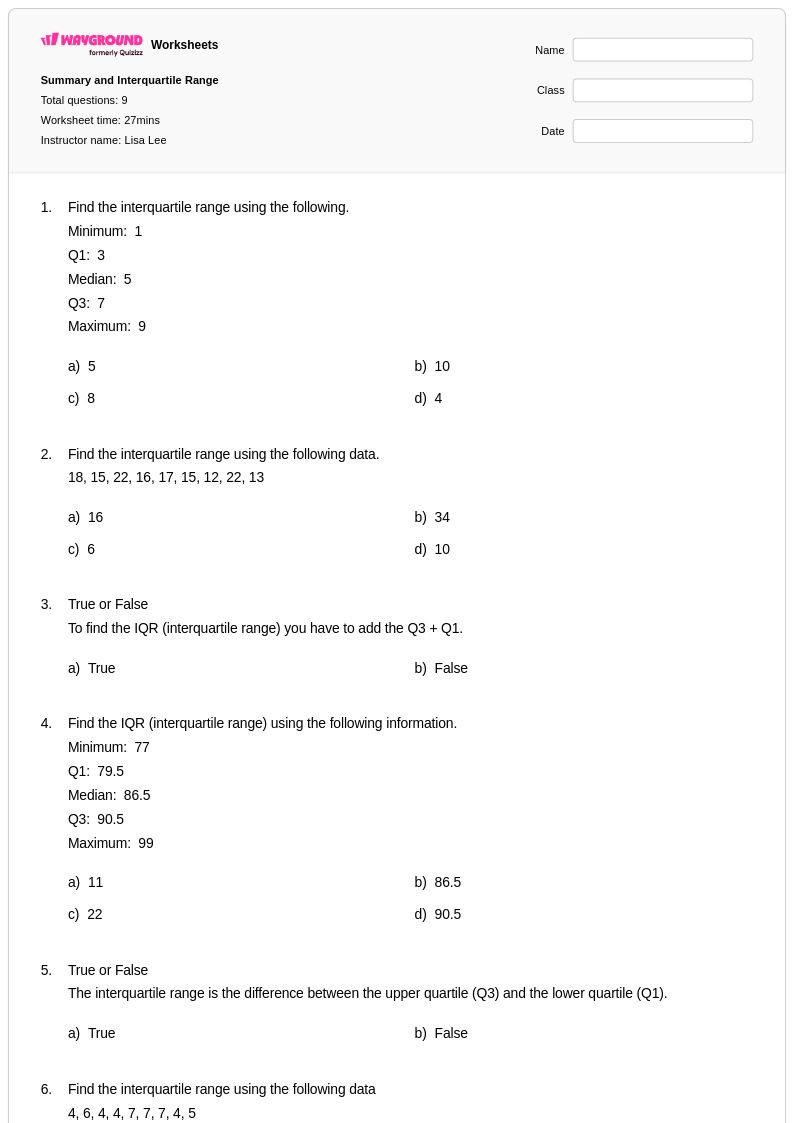
9 Q
6th
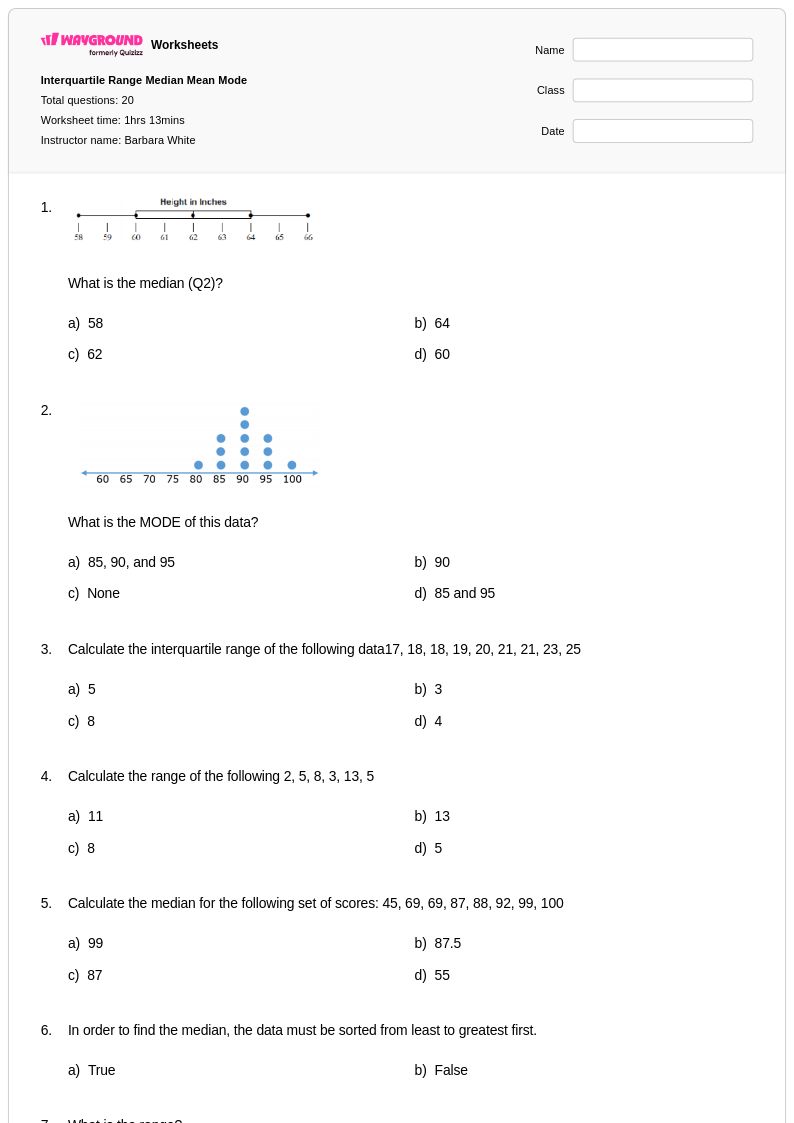
20 Q
6th
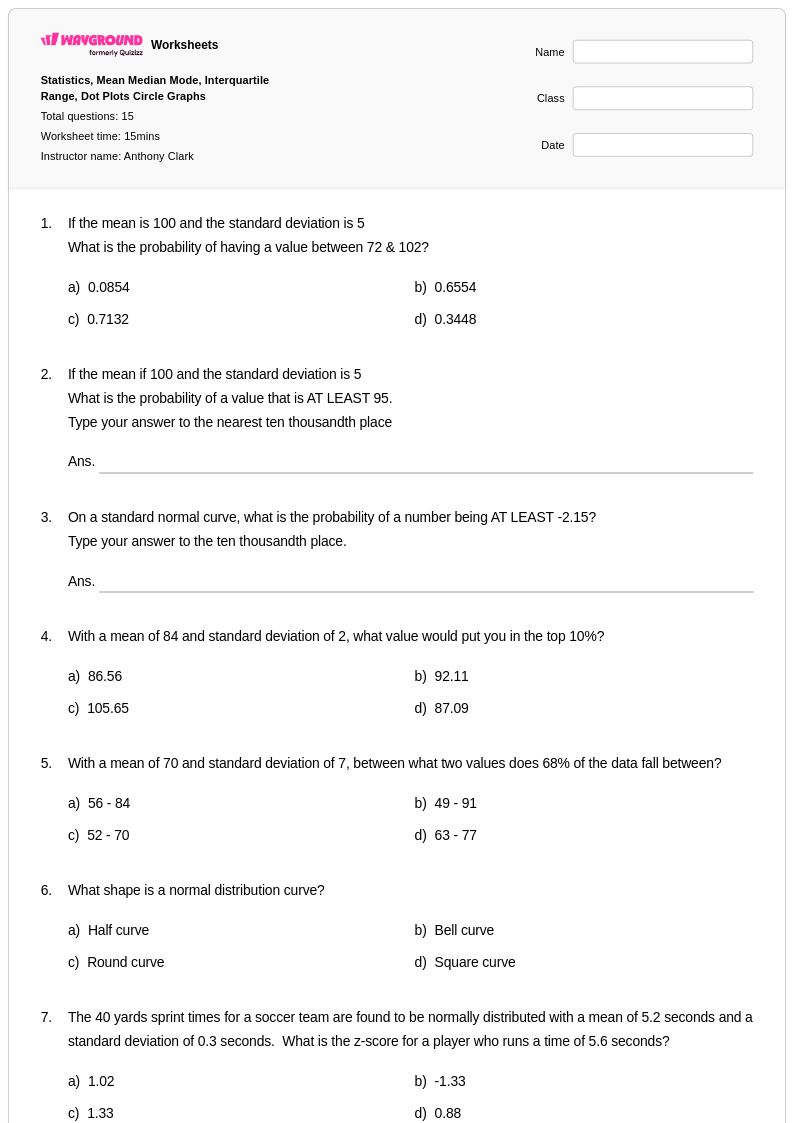
15 Q
12th - Uni
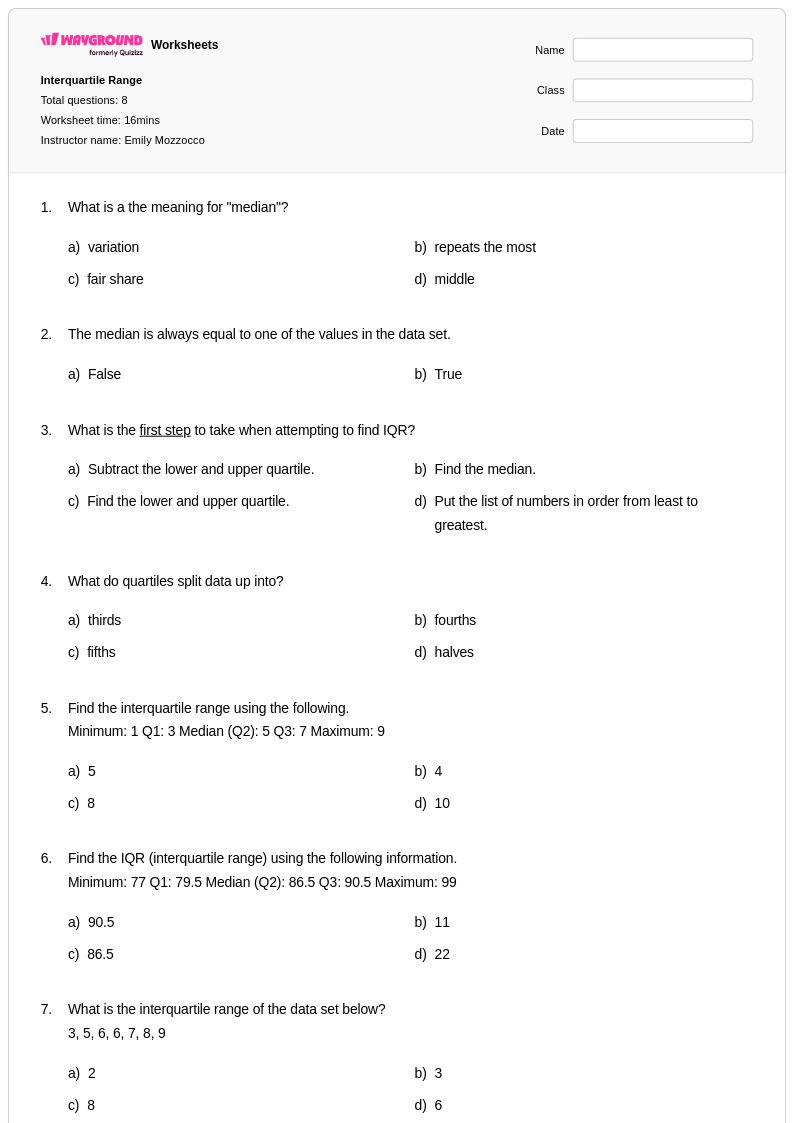
8 Q
6th - 8th
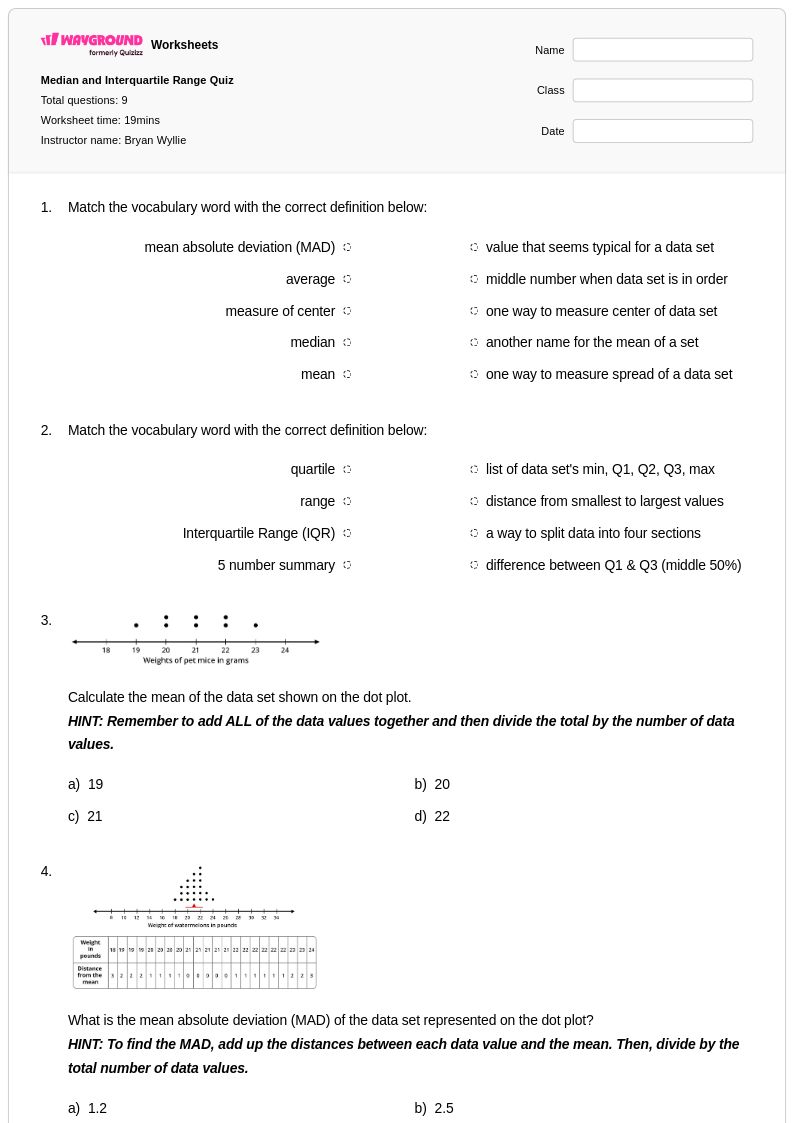
9 Q
6th
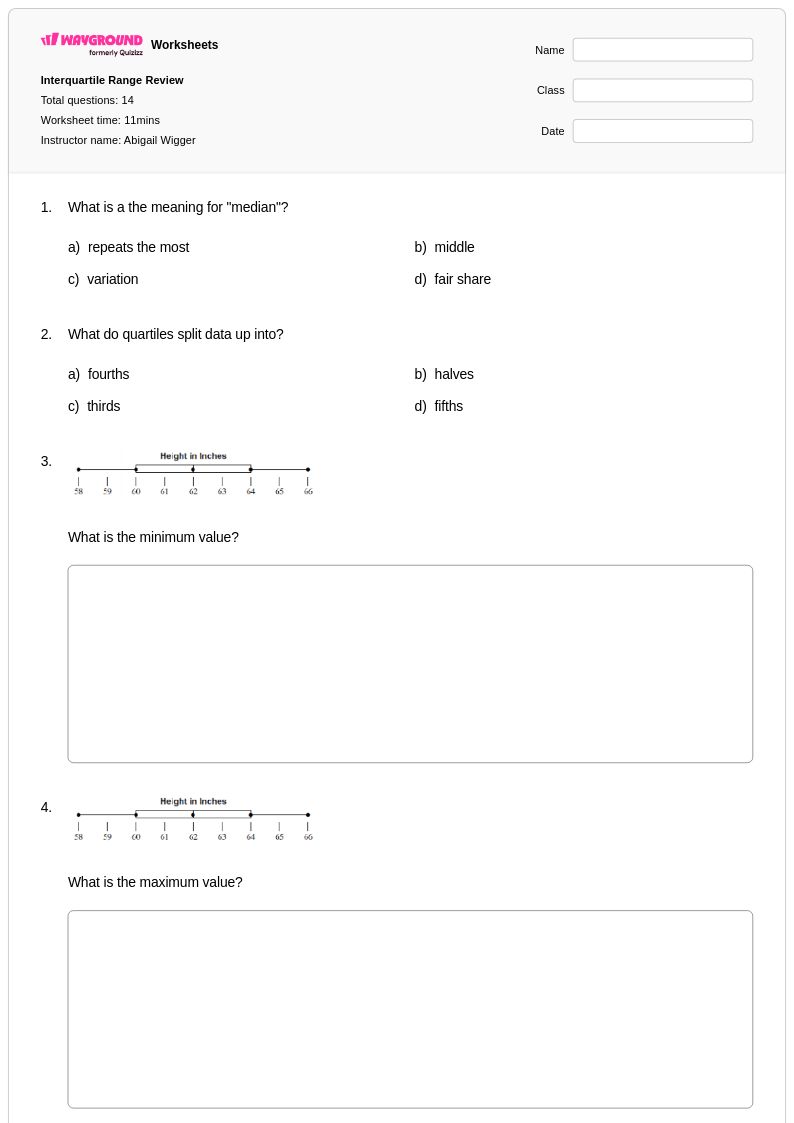
14 Q
6th - 8th
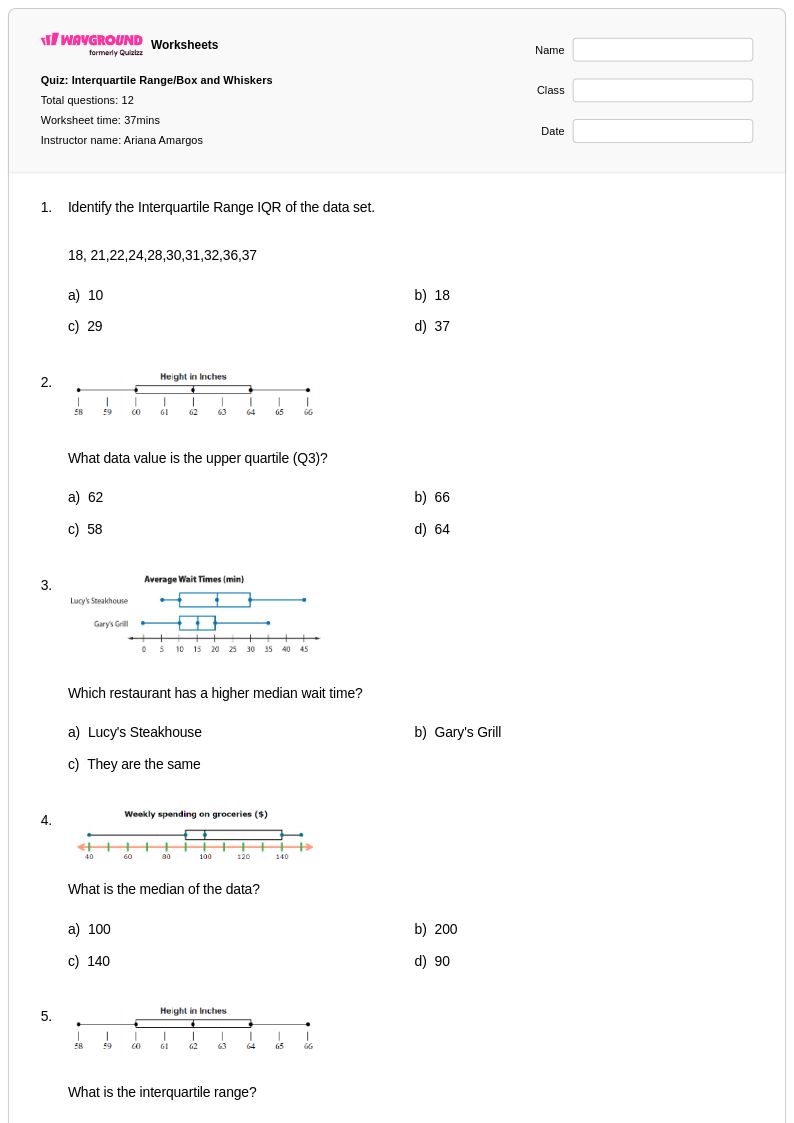
12 Q
6th - Uni
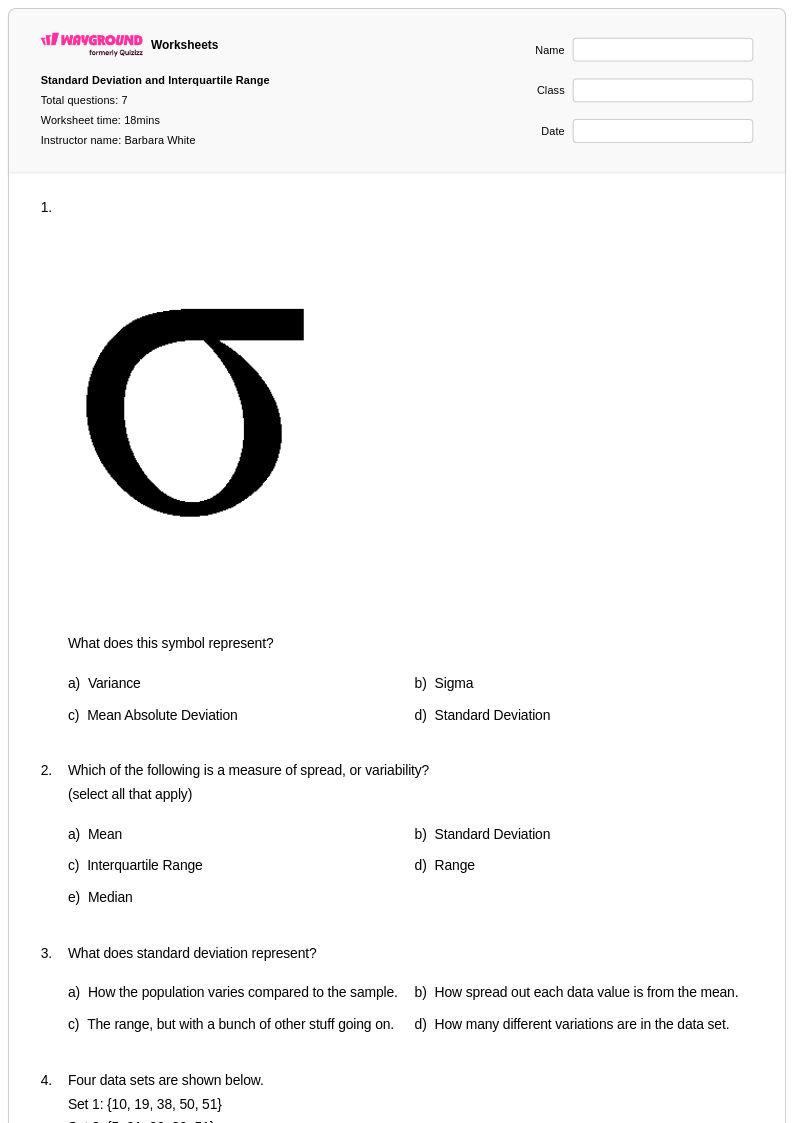
7 Q
9th
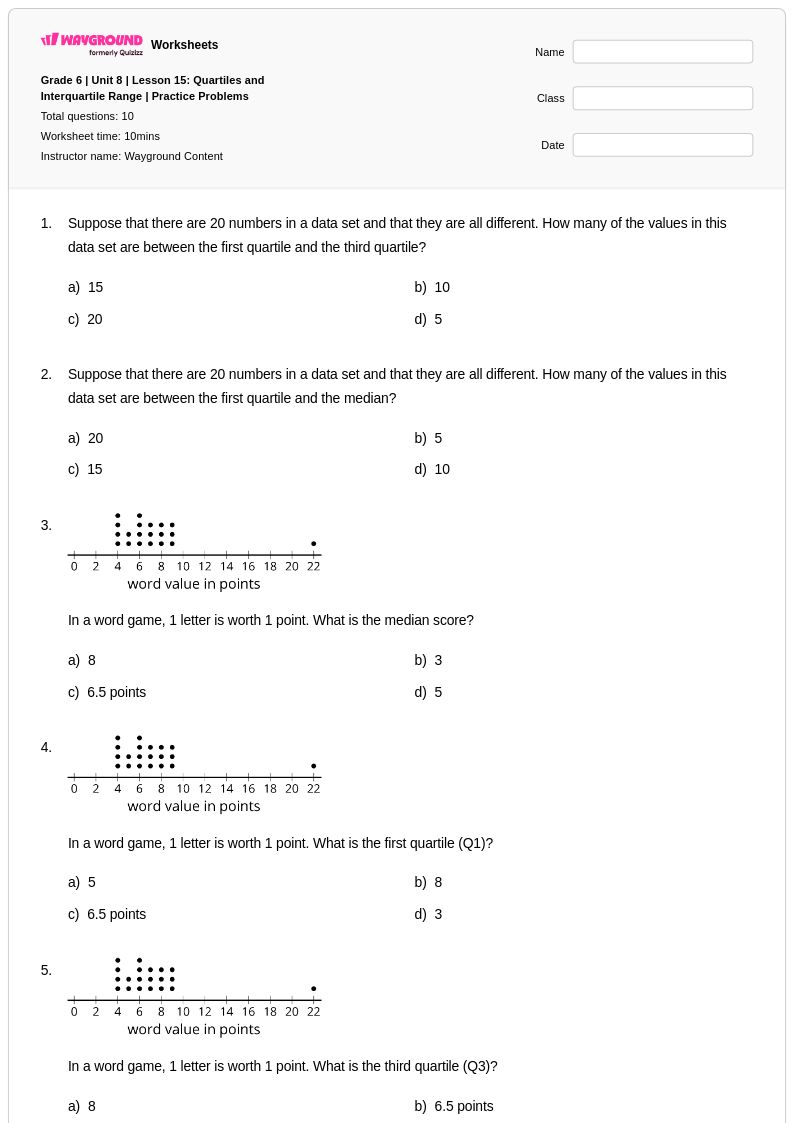
10 Q
6th - Uni
Explore Worksheets by Subjects
Explore printable Interquartile Range worksheets
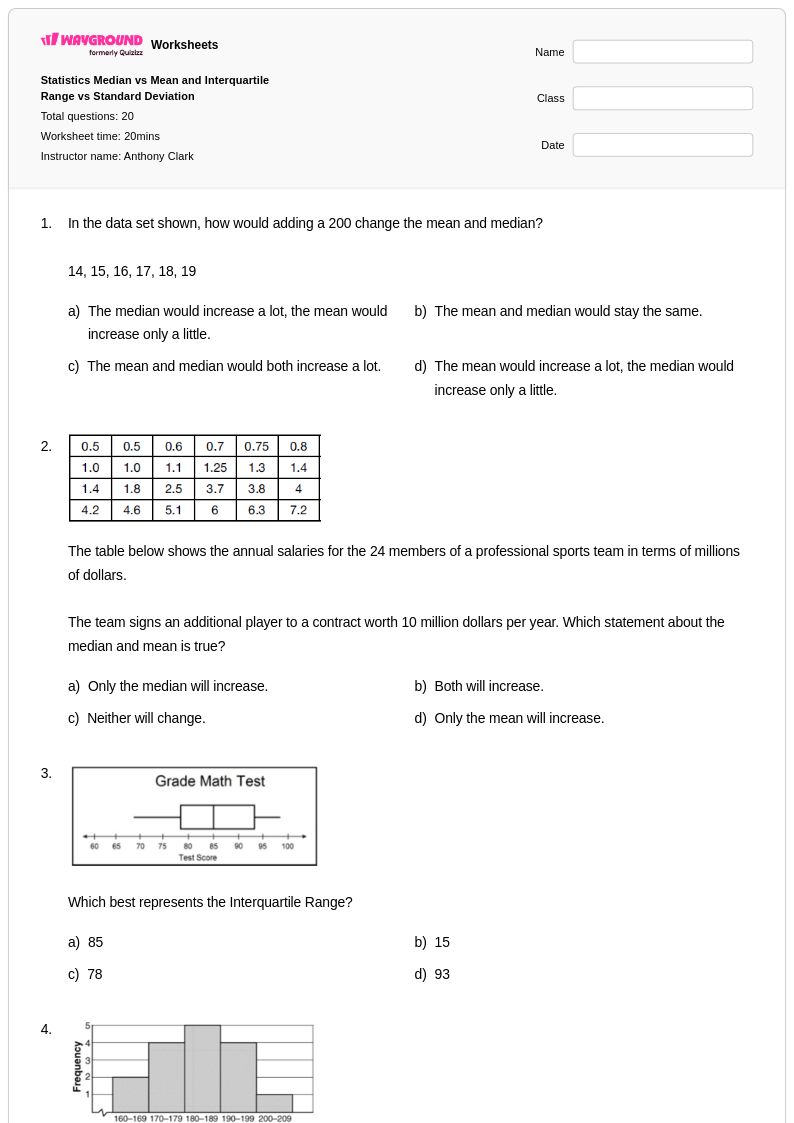
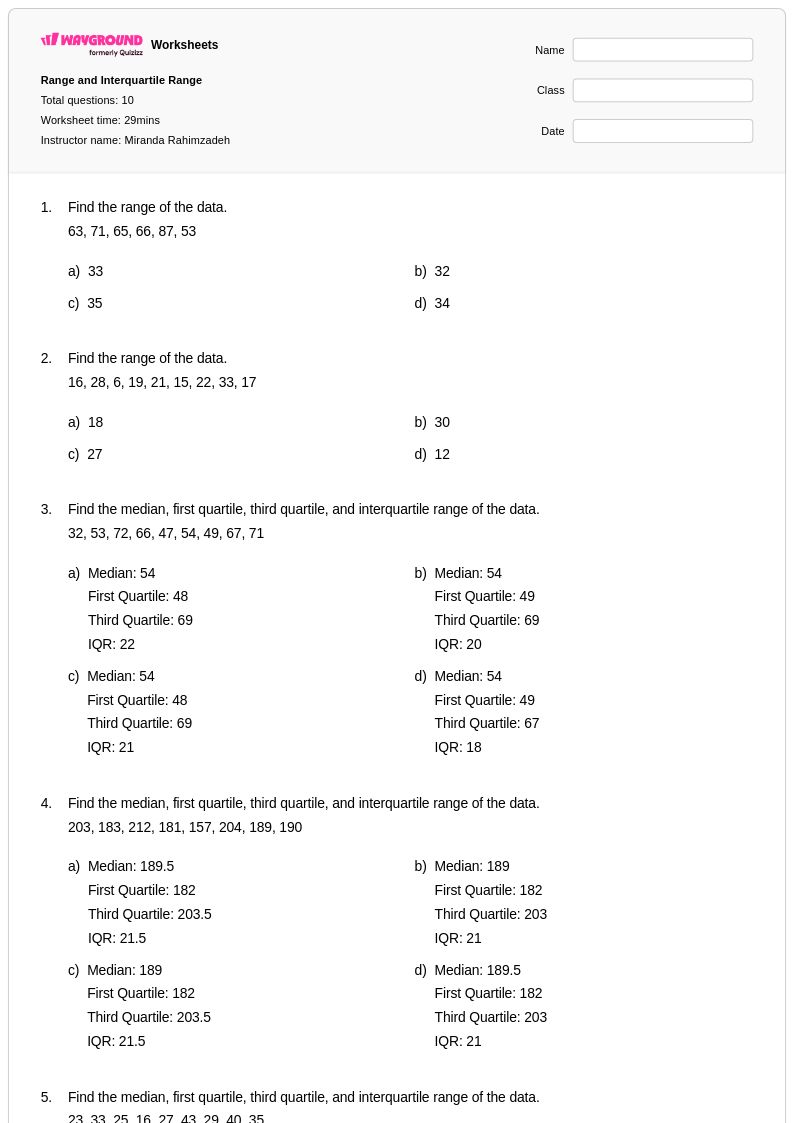
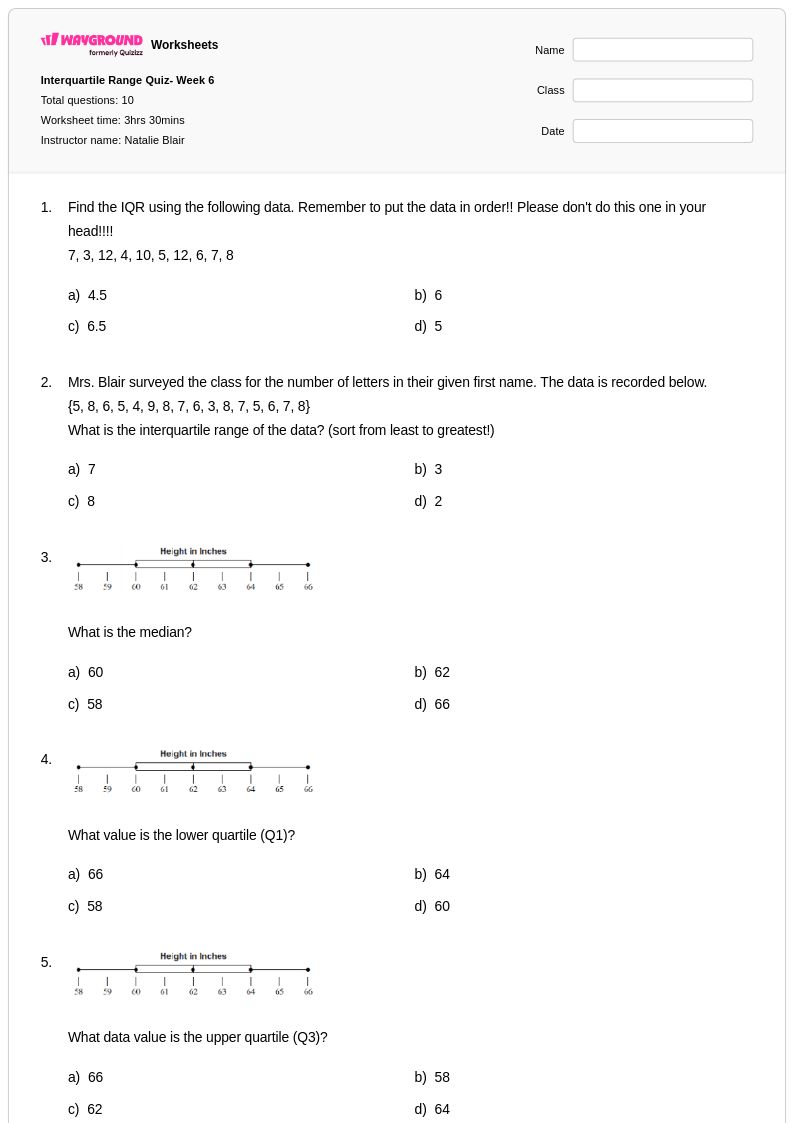
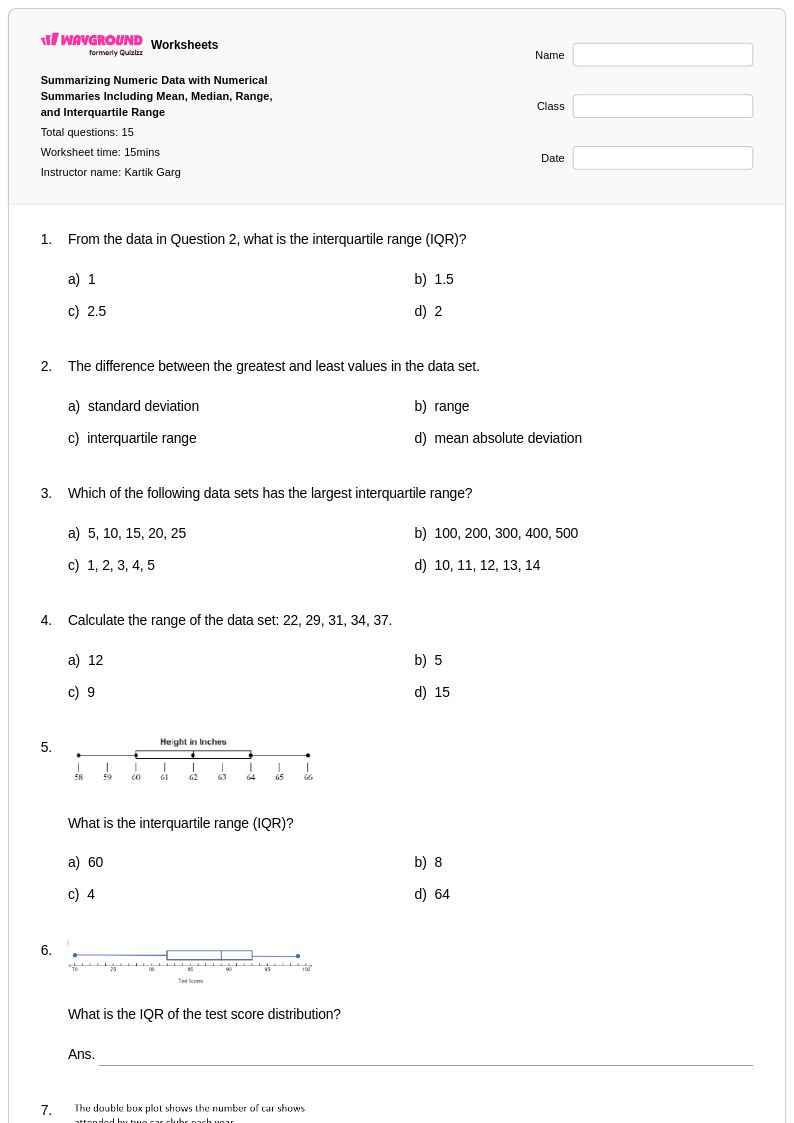
Interquartile range worksheets available through Wayground (formerly Quizizz) provide comprehensive practice with one of statistics' most fundamental measures of data spread and variability. These expertly crafted resources guide students through calculating the first quartile, third quartile, and the resulting interquartile range across diverse datasets, strengthening their understanding of how data distributes around the median. The worksheets systematically build proficiency in ordering data, identifying quartile positions, and interpreting what the interquartile range reveals about data consistency and outliers. Each printable resource includes detailed answer keys that support independent learning, while the free practice problems progress from basic calculations with small datasets to more complex scenarios involving grouped data and real-world applications, ensuring students develop both computational accuracy and conceptual understanding of this essential statistical measure.
Wayground (formerly Quizizz) empowers educators with an extensive collection of teacher-created interquartile range resources drawn from millions of contributions, featuring robust search and filtering capabilities that allow precise targeting of specific statistical concepts and difficulty levels. The platform's standards alignment ensures worksheets meet curriculum requirements, while sophisticated differentiation tools enable teachers to modify content complexity, adjust problem types, and customize datasets to match individual student needs. Available in both printable pdf formats and interactive digital versions, these flexible resources seamlessly integrate into lesson planning, provide targeted remediation for students struggling with quartile concepts, offer enrichment opportunities for advanced learners, and deliver consistent skill practice that builds statistical literacy. The comprehensive customization options allow educators to blend computational practice with data interpretation exercises, creating cohesive learning experiences that develop students' ability to analyze data distribution and variability across multiple mathematical contexts.
FAQs
How do I introduce the concept of interquartile range?
What types of problems help students practice calculating IQR?
What are the most common mistakes students make when finding the interquartile range?
How can I use this interquartile range worksheet in my class?
How does learning interquartile range fit into the math curriculum?
How can I differentiate instruction for interquartile range?