
14 Q
8th - Uni
15 Q
8th - Uni
21 Q
8th
15 Q
8th
11 Q
8th
15 Q
8th - Uni
20 Q
8th - Uni
16 Q
8th
10 Q
8th - Uni
15 Q
8th - Uni
20 Q
8th - Uni
15 Q
8th - Uni
14 Q
8th - Uni
20 Q
8th - Uni
10 Q
8th
19 Q
8th - Uni
13 Q
8th
24 Q
8th - 12th
20 Q
8th - Uni
14 Q
8th - Uni
8 Q
8th - Uni
20 Q
8th - Uni
15 Q
8th - Uni
11 Q
8th - Uni
Explore Other Subject Worksheets for year 8
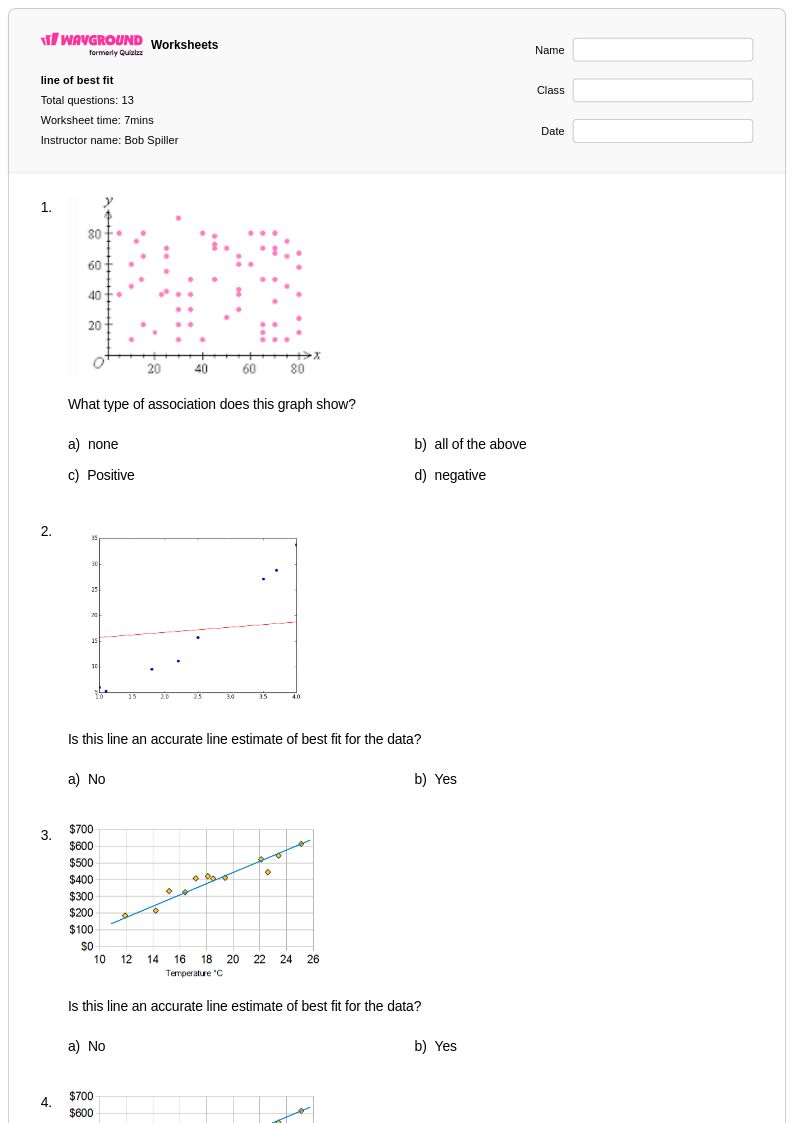
Explore printable Line of Best Fit worksheets for Year 8
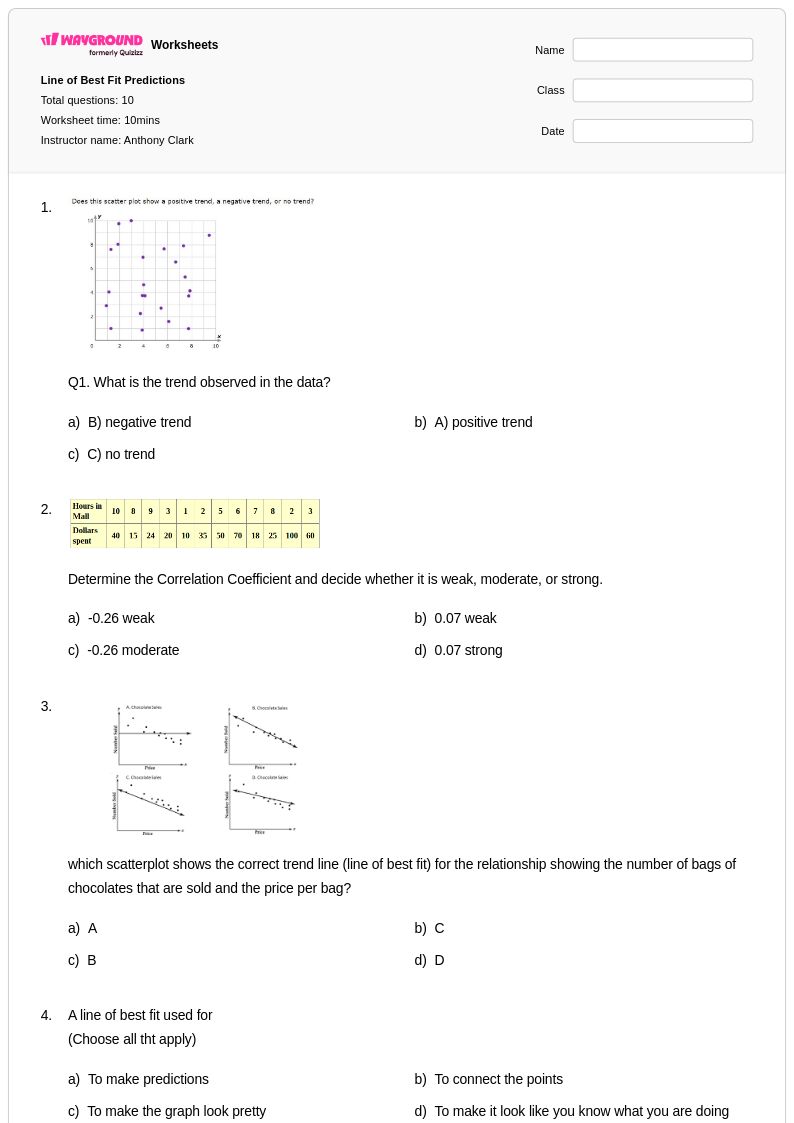
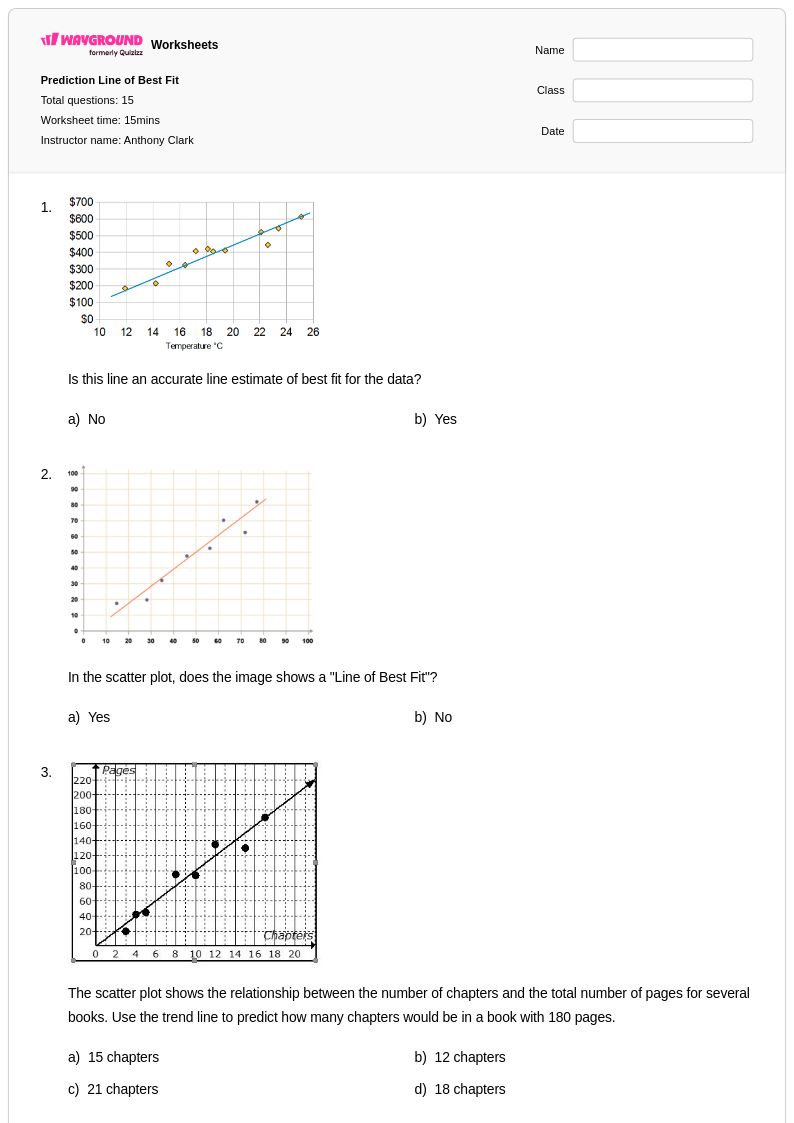
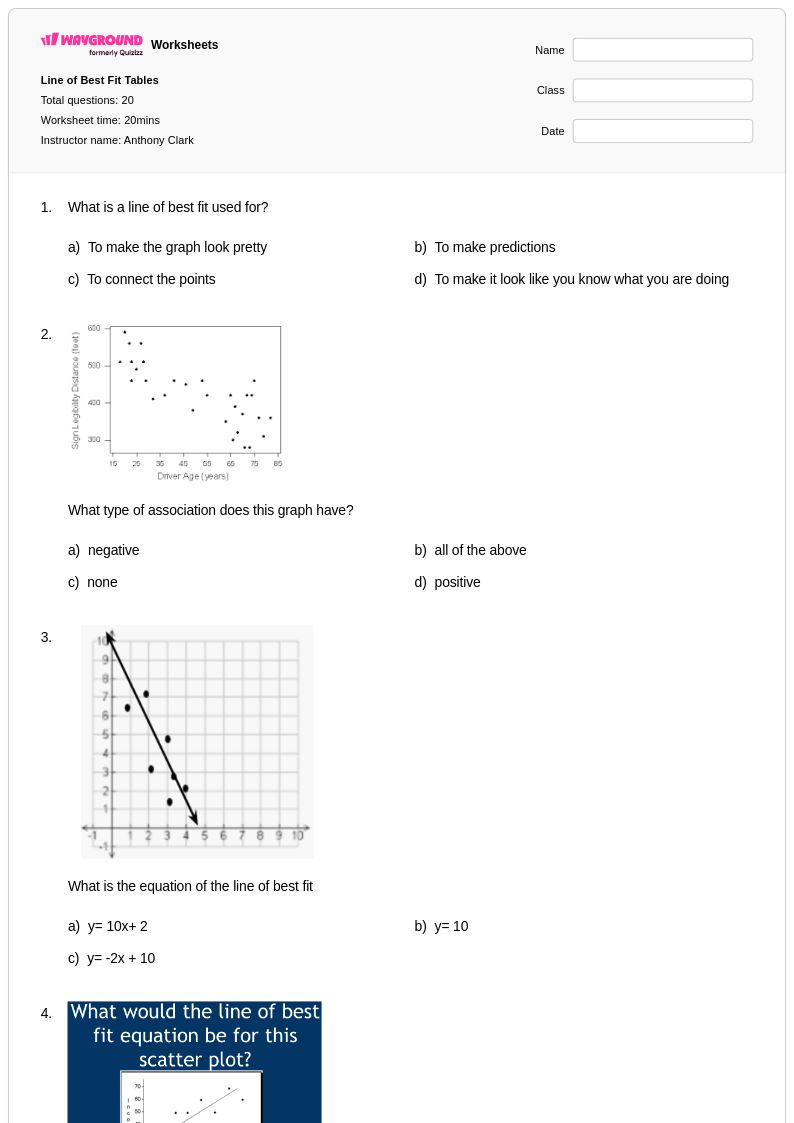
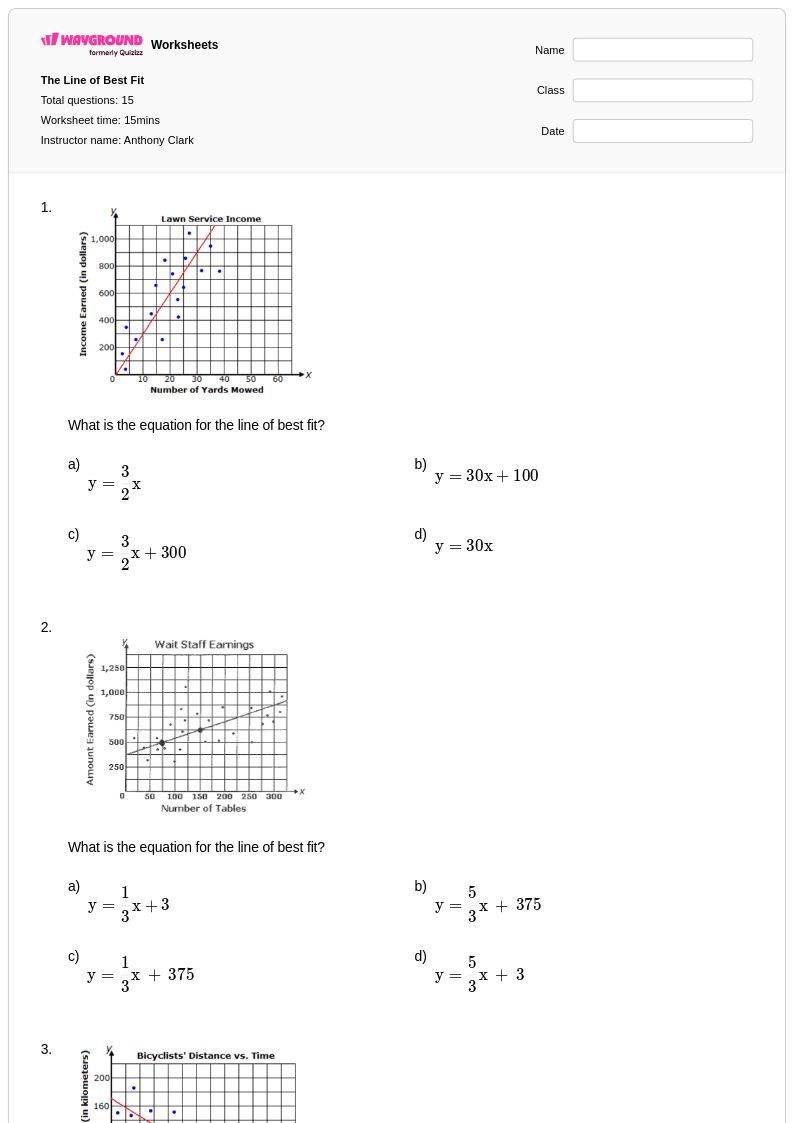
Line of best fit worksheets for Year 8 students available through Wayground provide essential practice in analyzing scatter plots and understanding linear relationships in data sets. These comprehensive worksheets strengthen critical mathematical skills including plotting coordinate points, identifying correlation patterns, drawing trend lines through data clusters, and making predictions based on linear models. Students work through carefully structured practice problems that build proficiency in determining whether correlations are positive, negative, or show no relationship, while developing the analytical thinking needed to interpret real-world data scenarios. Each worksheet collection includes detailed answer keys and is available as free printable pdf resources, allowing educators to seamlessly integrate these materials into their probability and statistics curriculum.
Wayground's extensive collection of line of best fit worksheets draws from millions of teacher-created resources, offering robust search and filtering capabilities that help educators quickly locate materials aligned with specific learning standards and student needs. The platform's differentiation tools enable teachers to customize worksheets for various skill levels, supporting both remediation for struggling learners and enrichment opportunities for advanced students ready to tackle more complex data analysis challenges. Available in both printable and digital formats including downloadable pdfs, these resources provide the flexibility teachers need for diverse classroom environments and learning preferences. This comprehensive approach to worksheet organization and delivery streamlines lesson planning while ensuring students receive targeted practice in interpreting scatter plots, calculating correlation coefficients, and applying linear regression concepts essential for mathematical literacy in data analysis.