
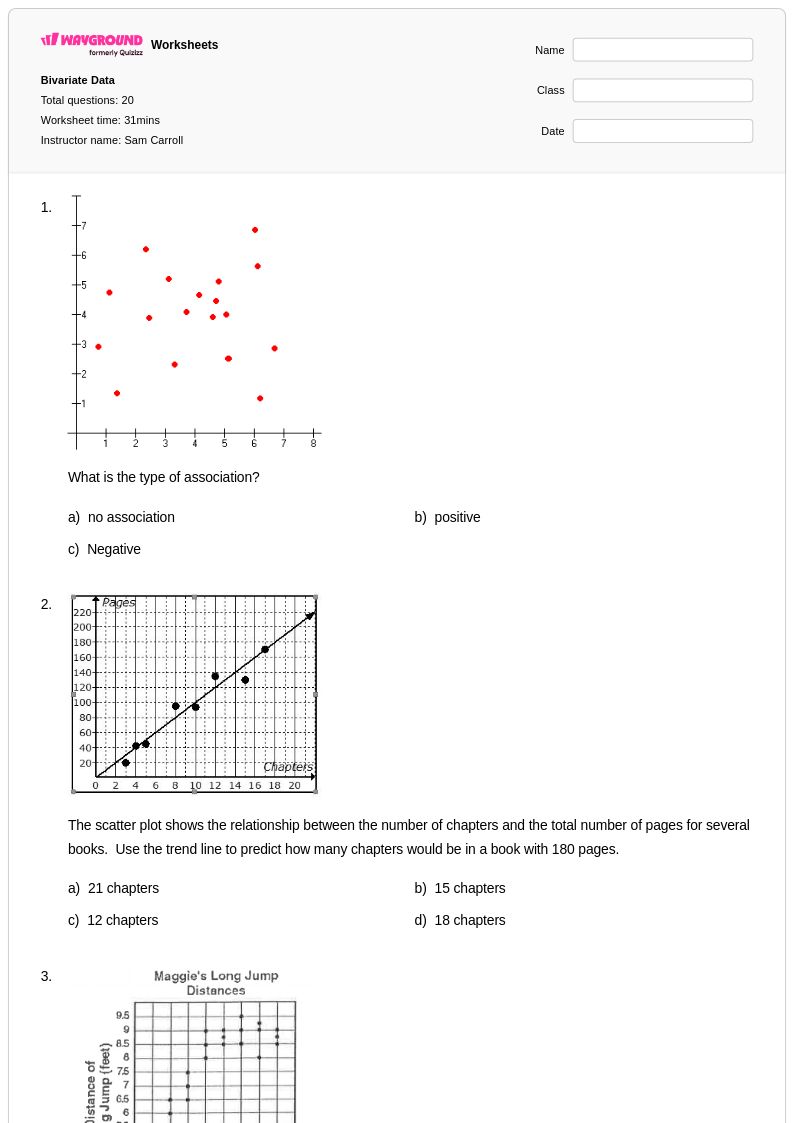
20 Hỏi
9th - 11th
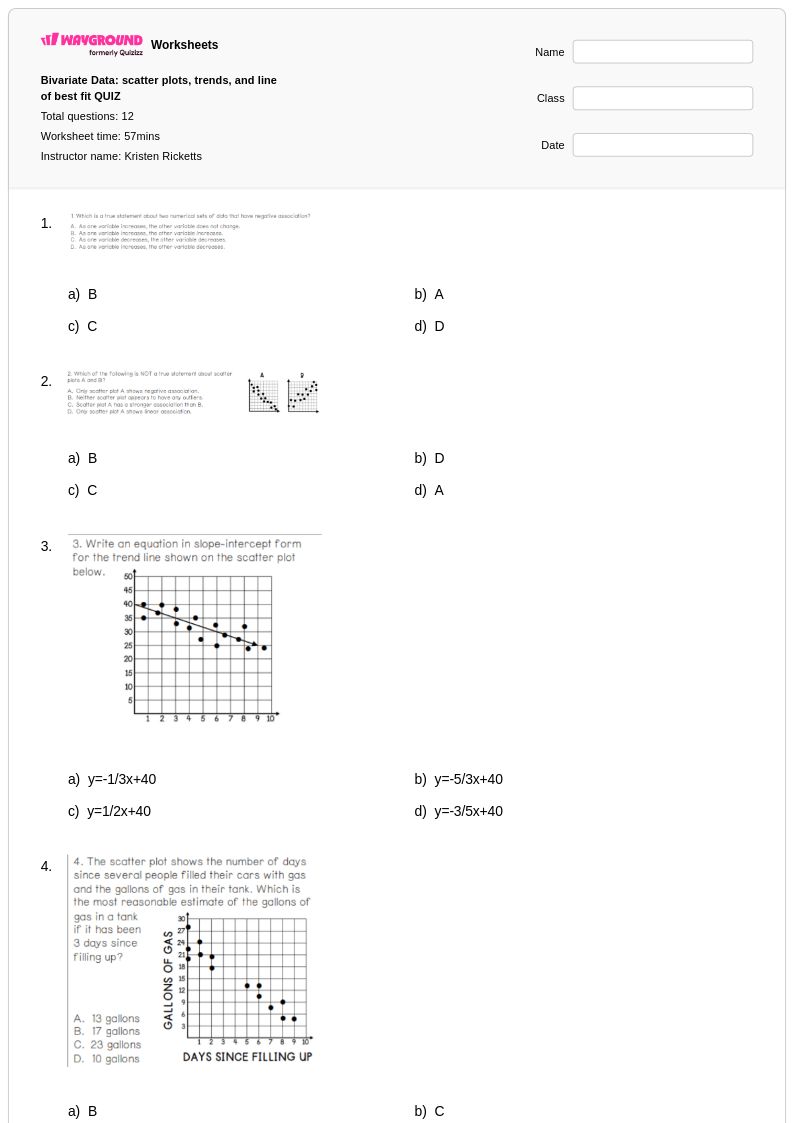
12 Hỏi
8th
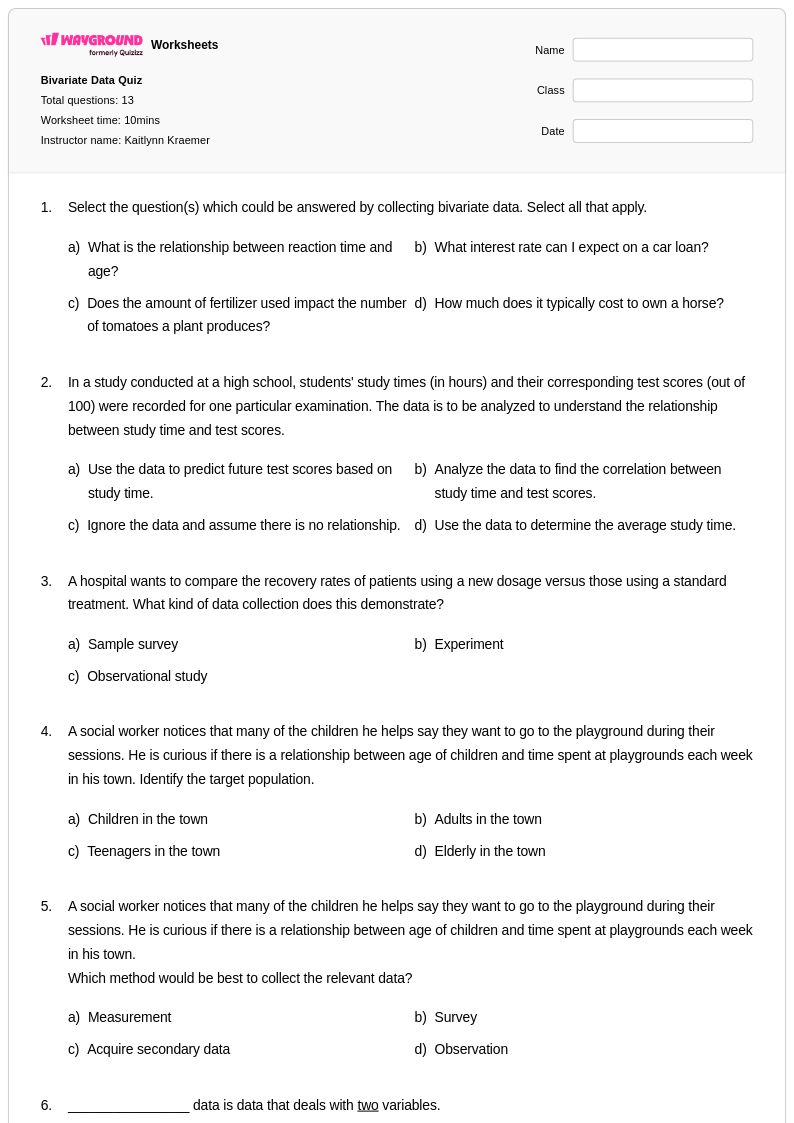
13 Hỏi
9th - Uni
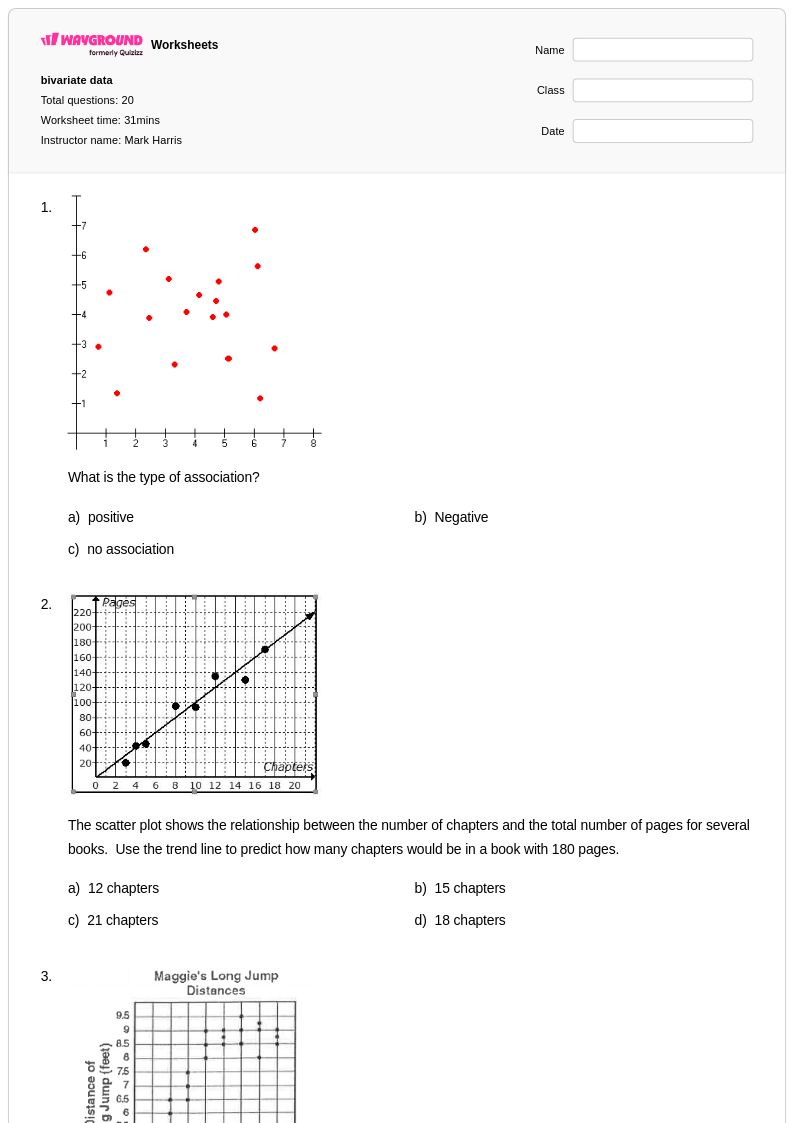
20 Hỏi
11th

16 Hỏi
8th

40 Hỏi
8th
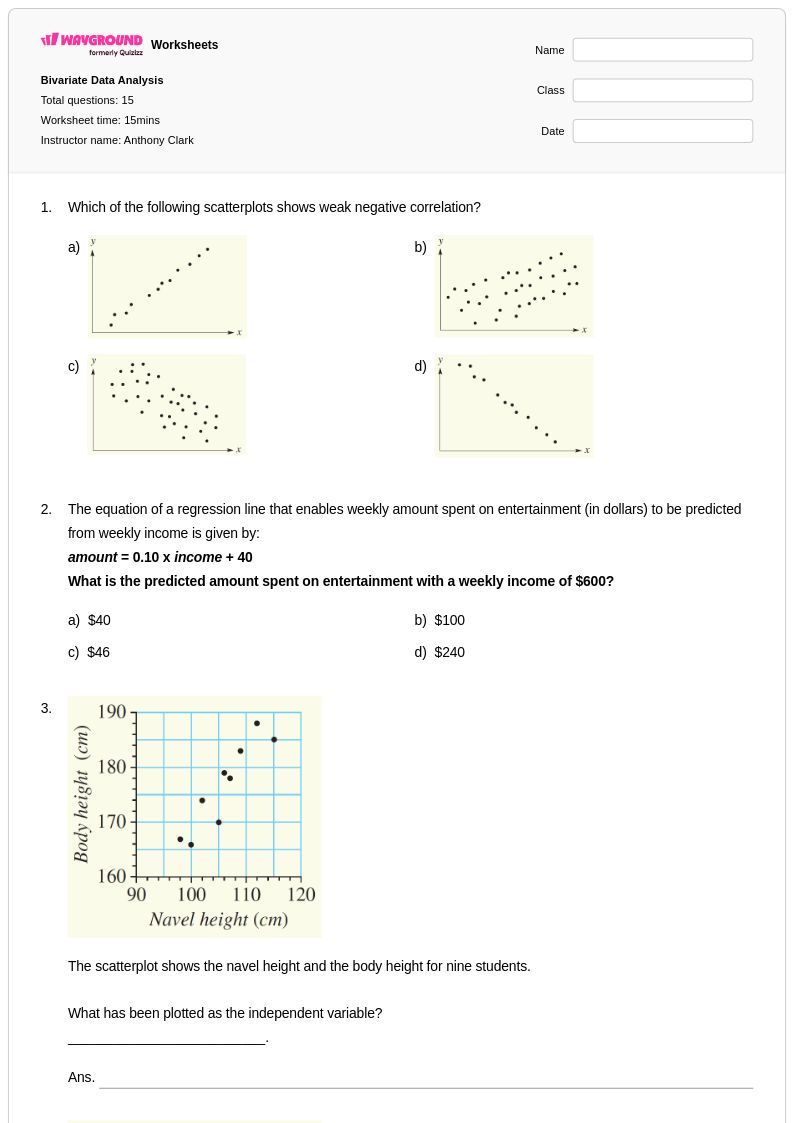
15 Hỏi
12th - Uni
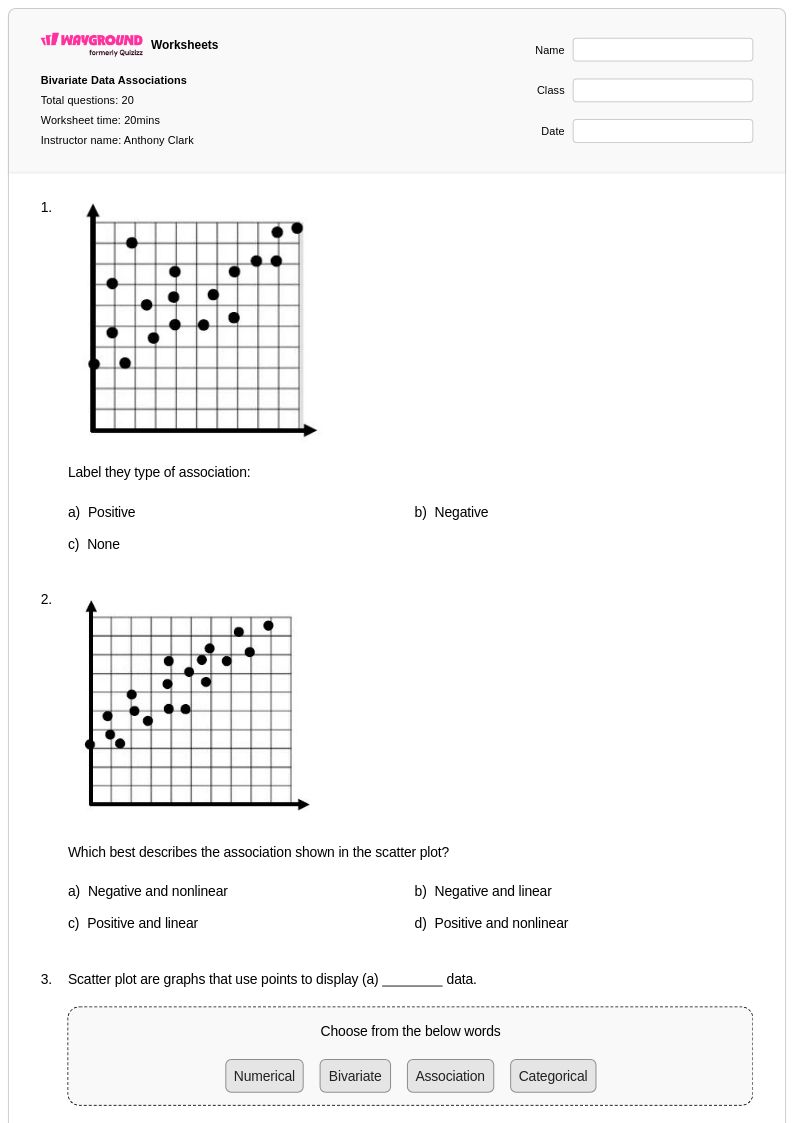
20 Hỏi
8th - Uni
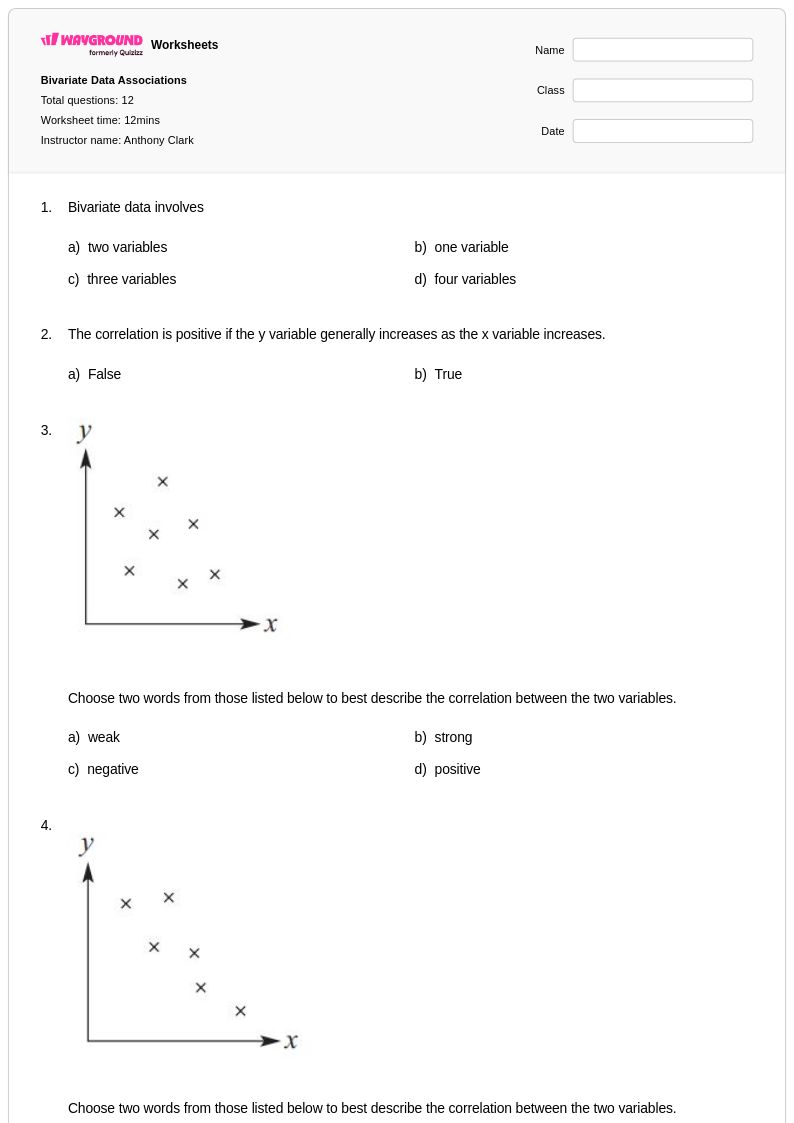
12 Hỏi
8th - Uni
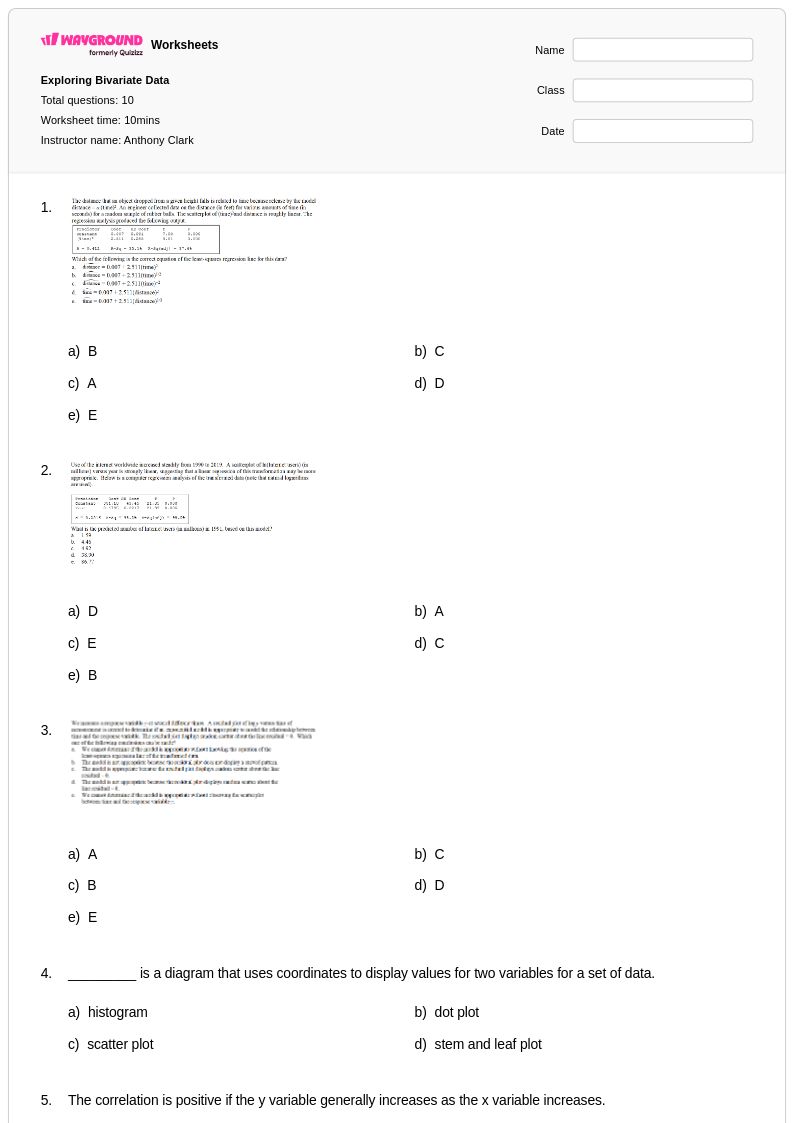
10 Hỏi
11th - Uni
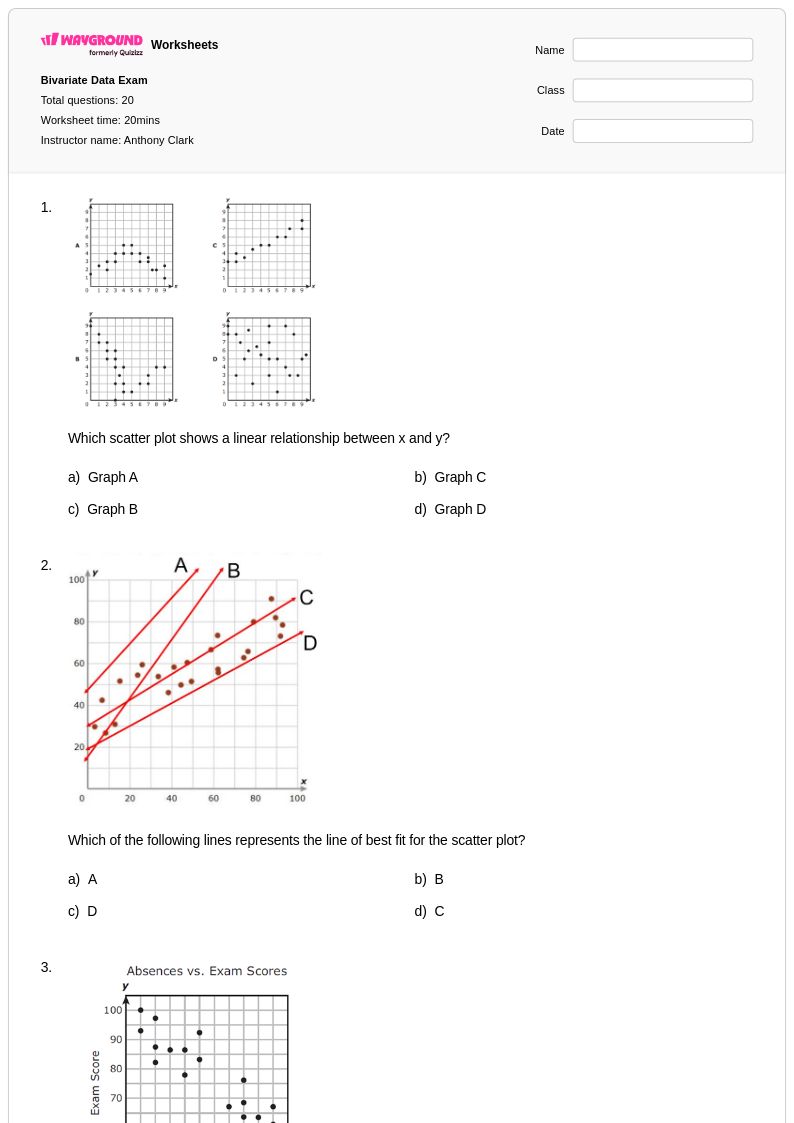
20 Hỏi
8th - Uni
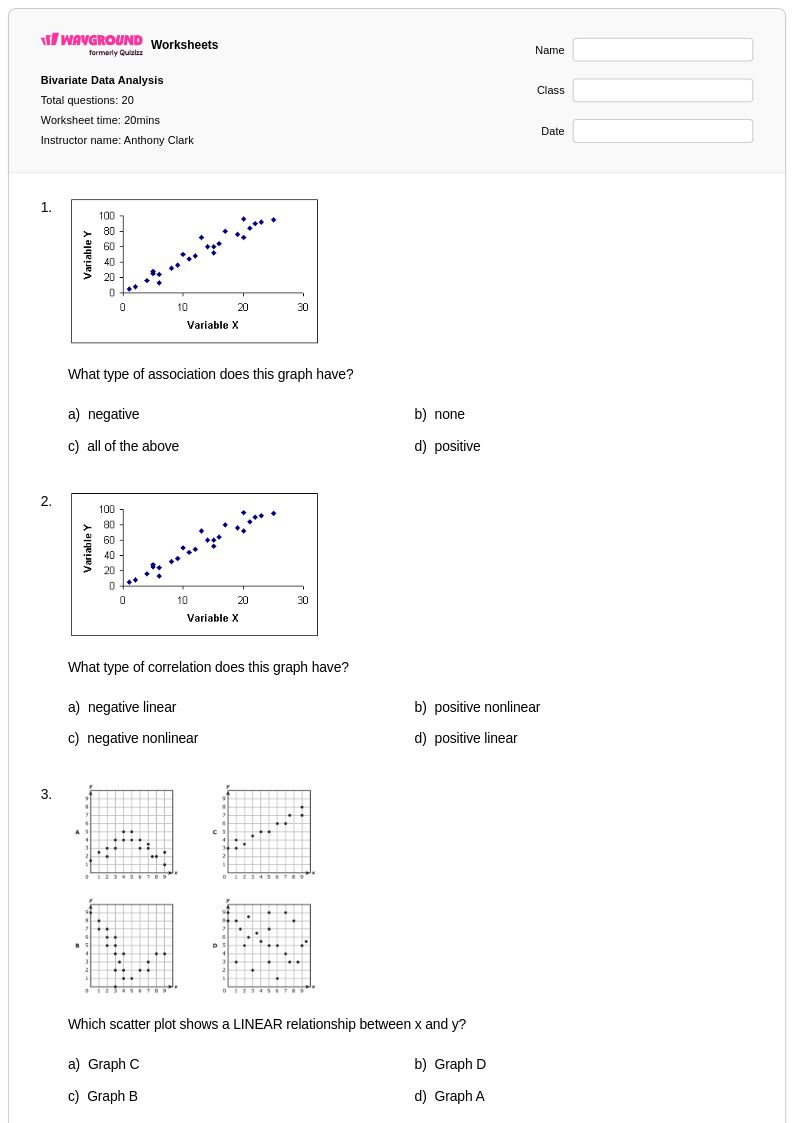
20 Hỏi
12th - Uni
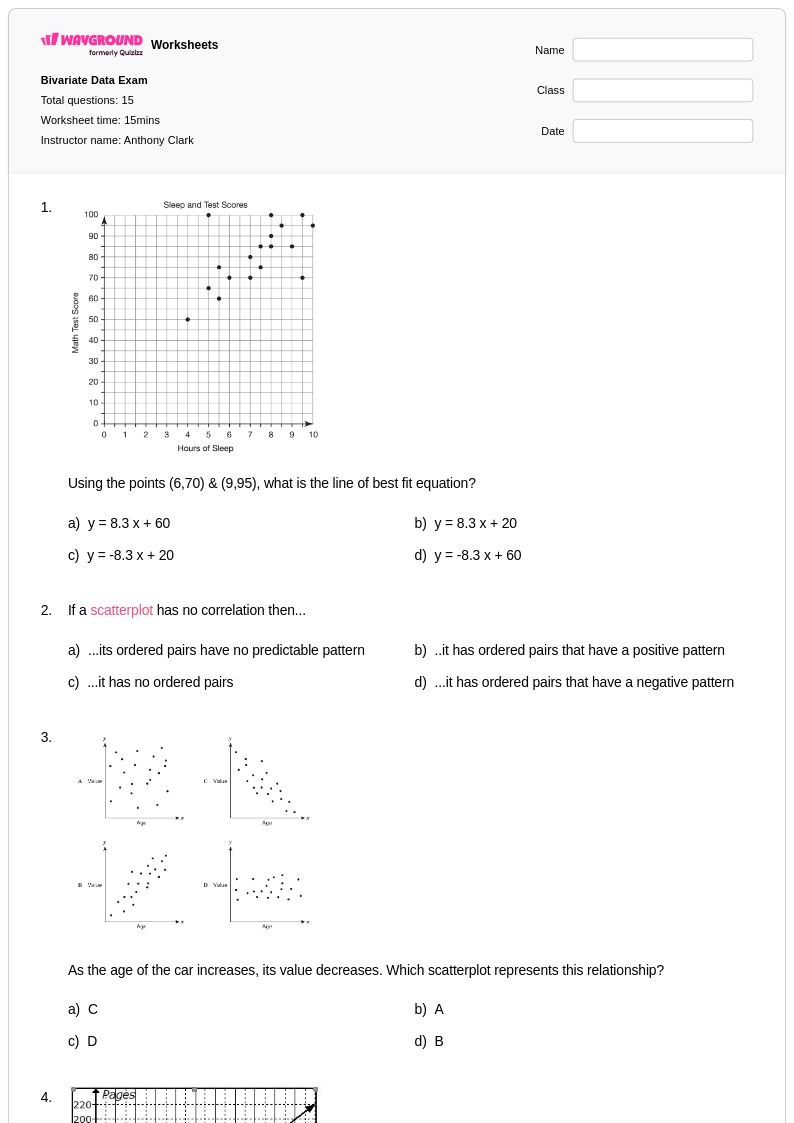
15 Hỏi
8th - Uni
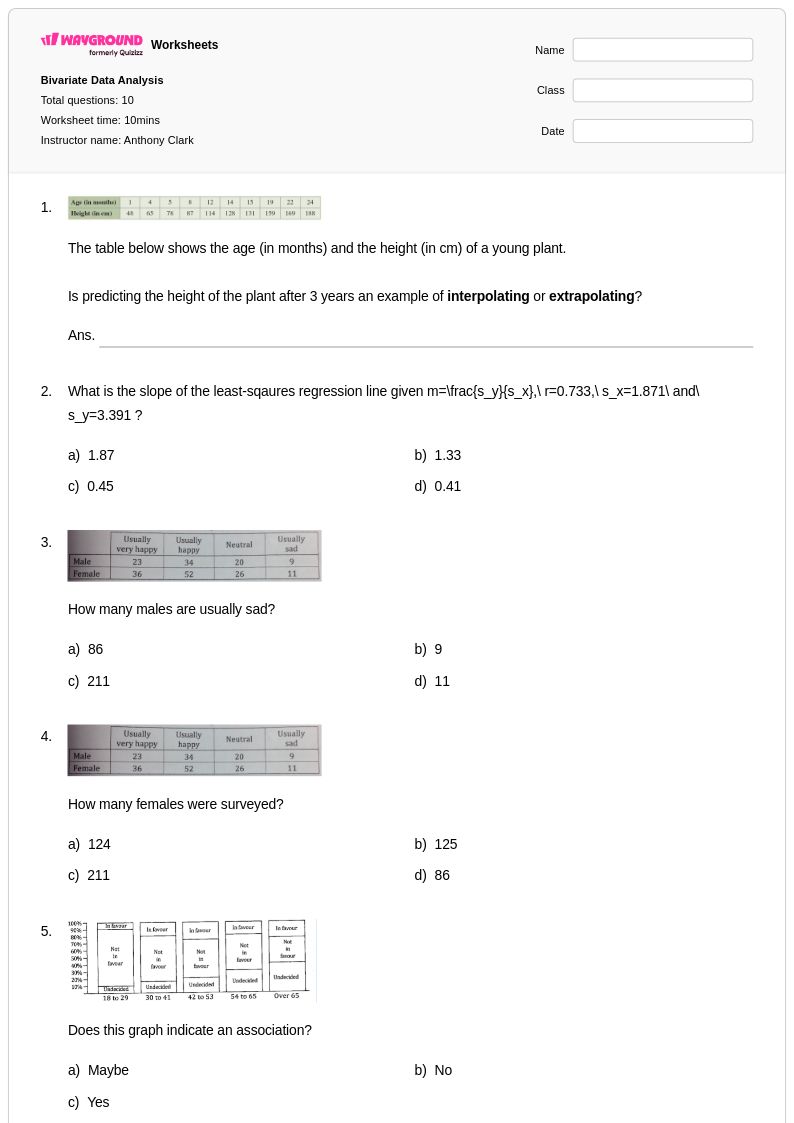
10 Hỏi
12th - Uni
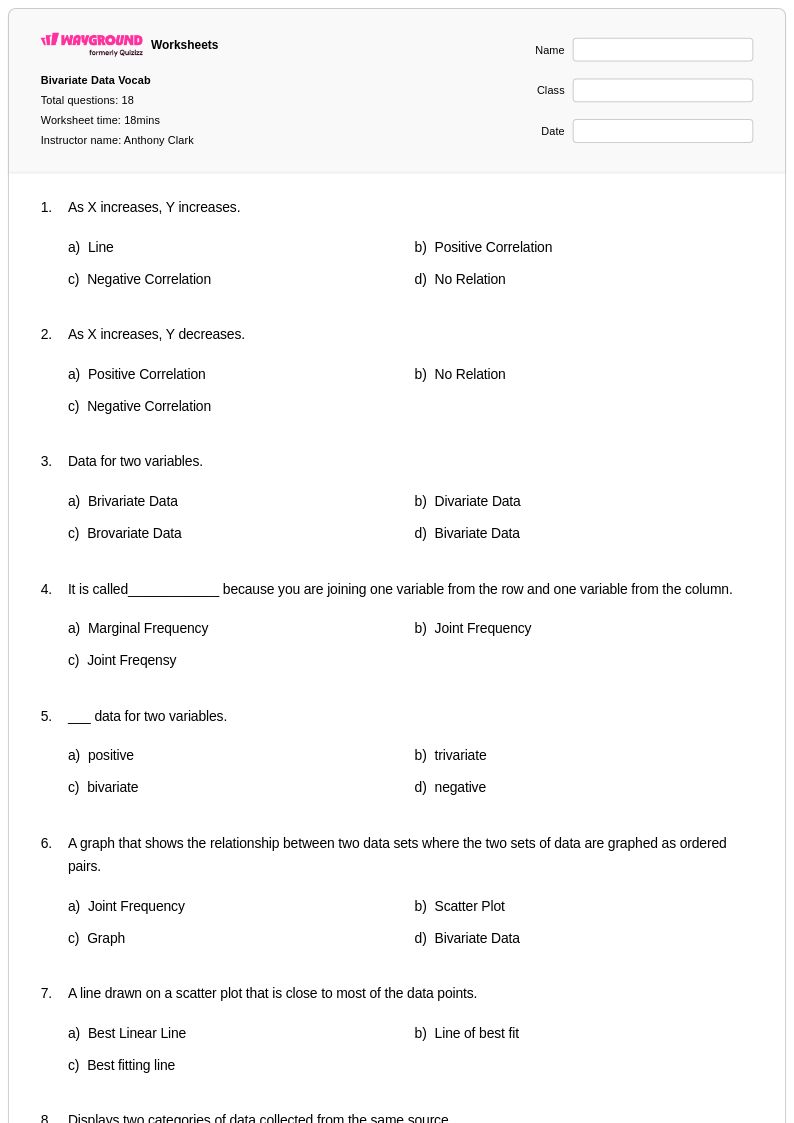
18 Hỏi
8th - Uni
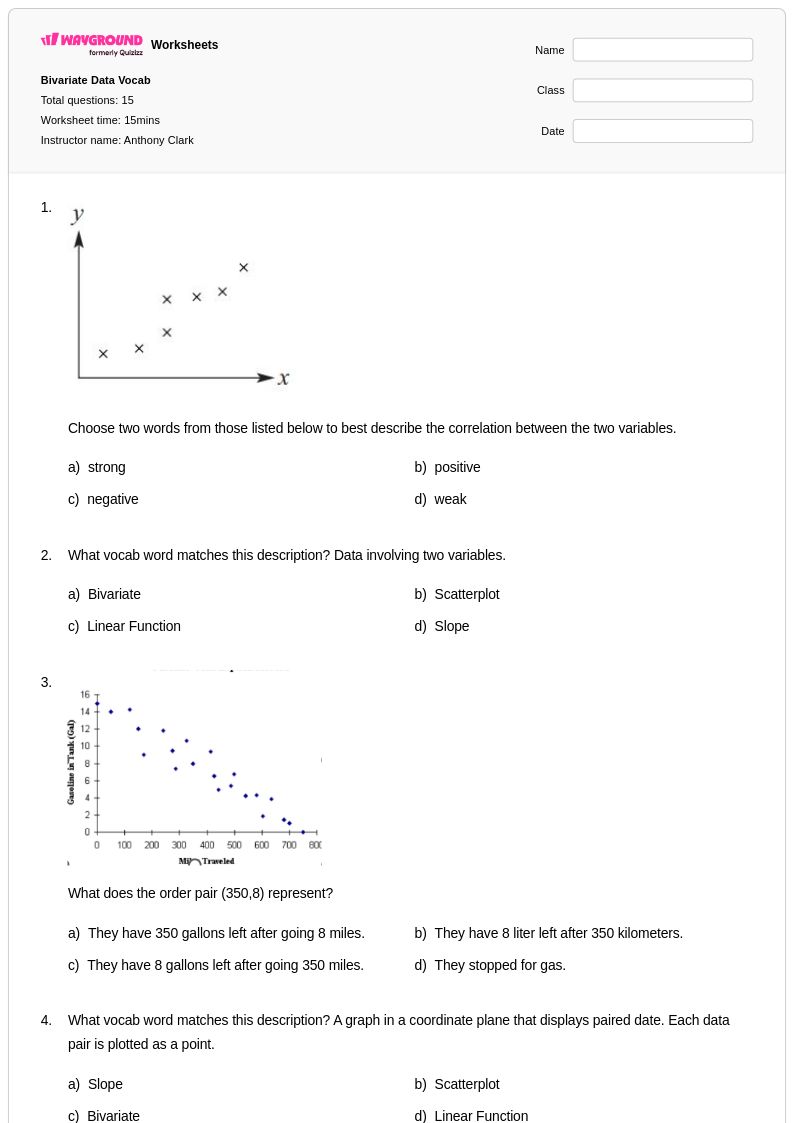
15 Hỏi
8th - Uni
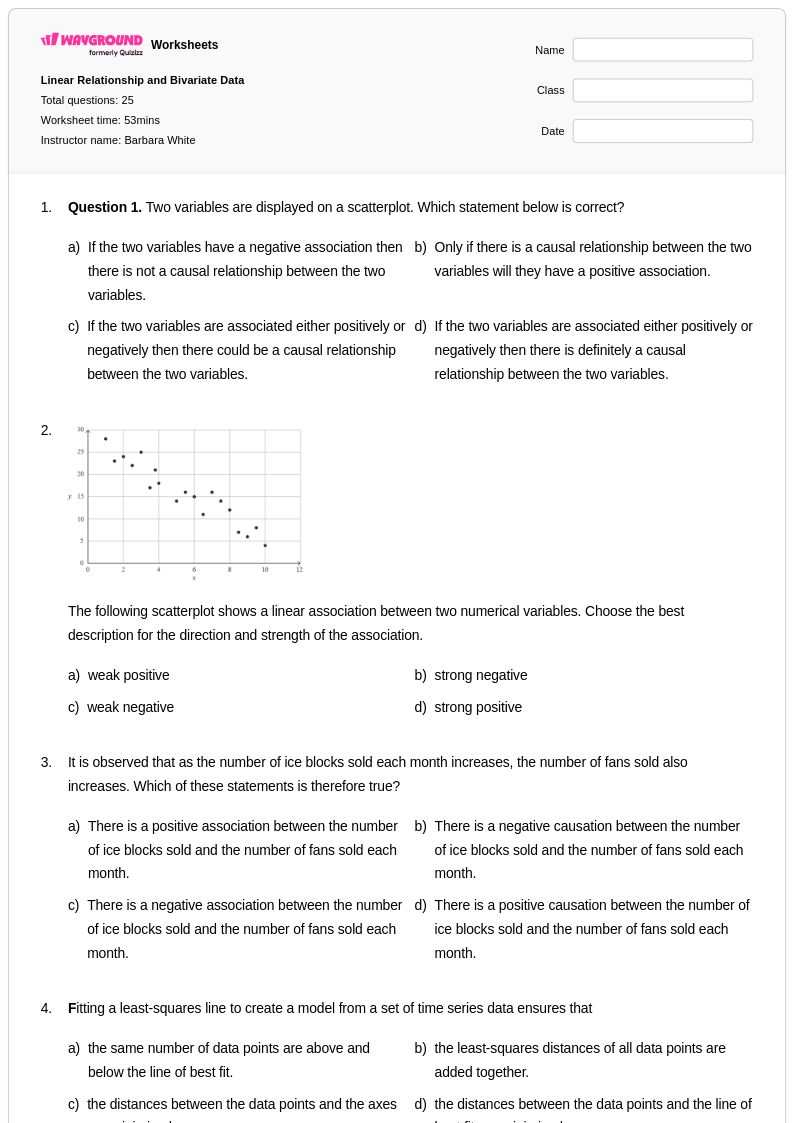
25 Hỏi
11th - Uni
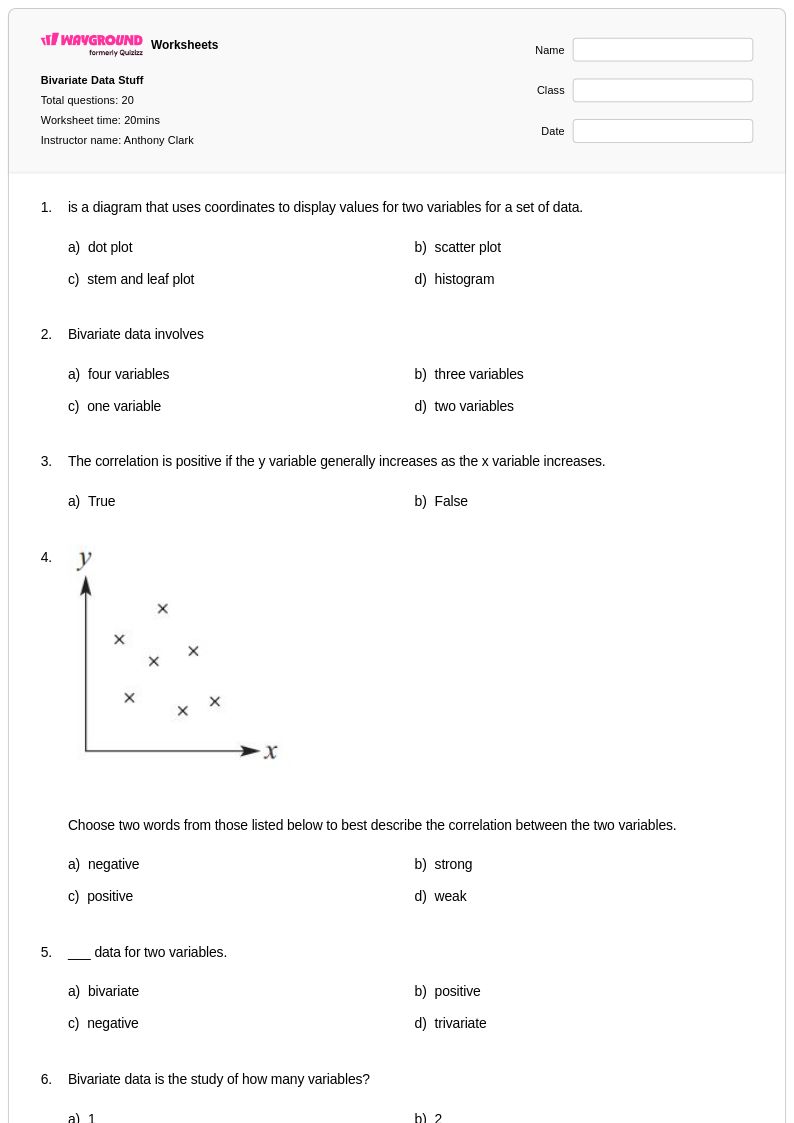
20 Hỏi
8th - Uni
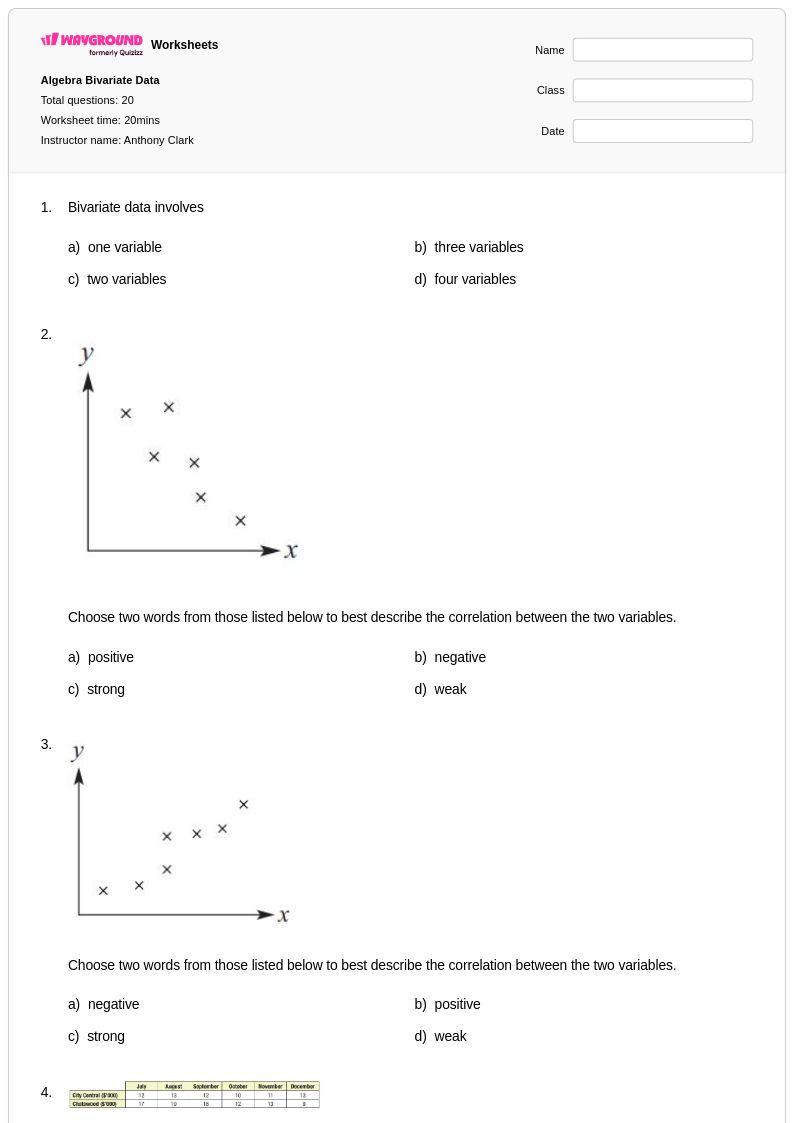
20 Hỏi
8th - Uni
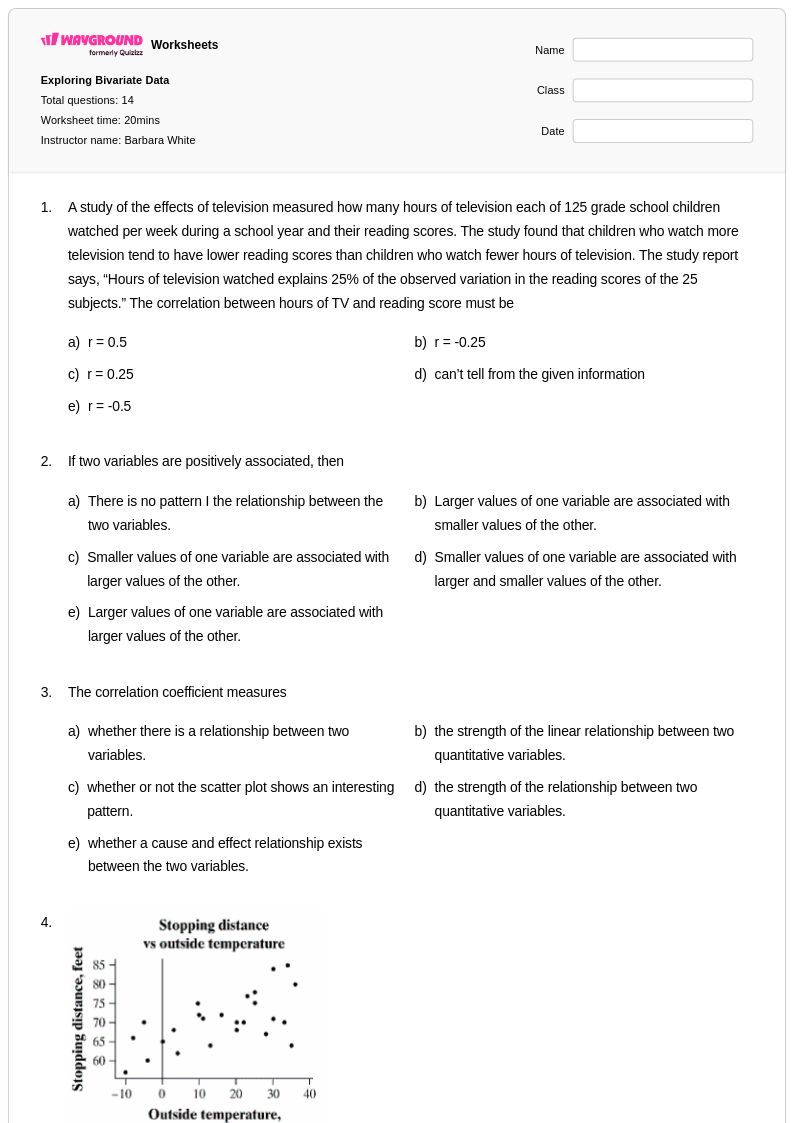
14 Hỏi
10th - 12th
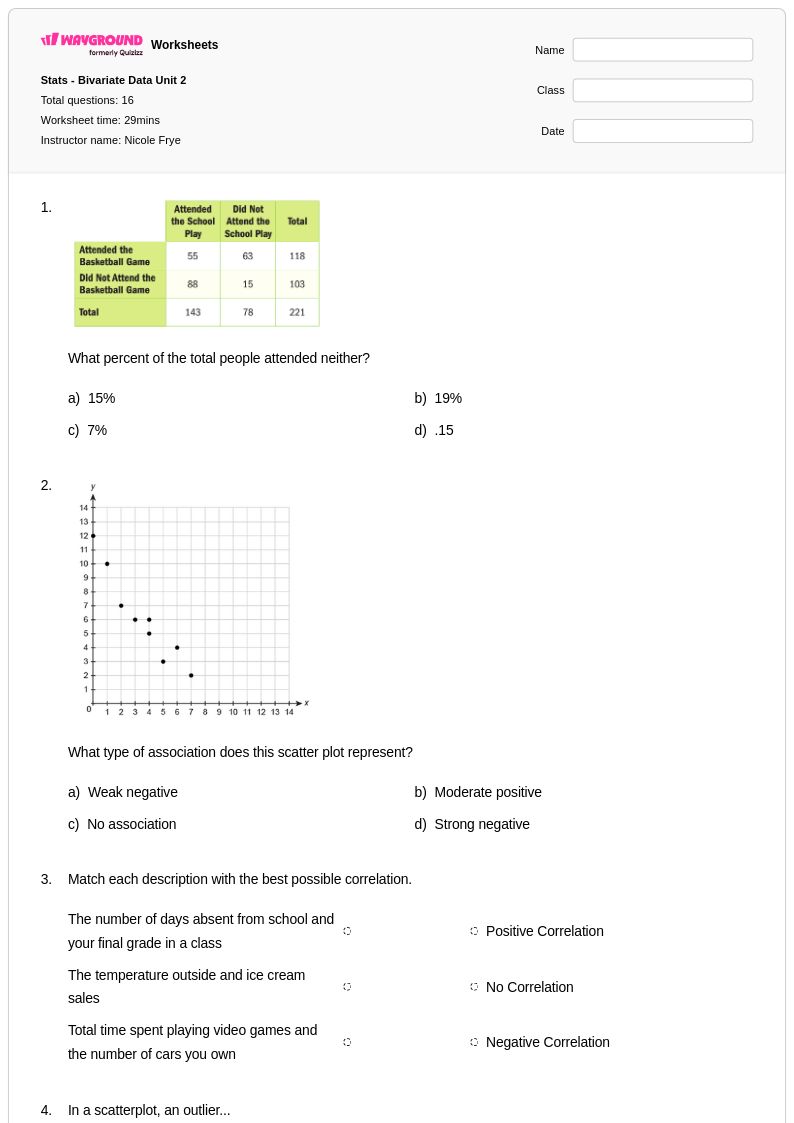
16 Hỏi
12th
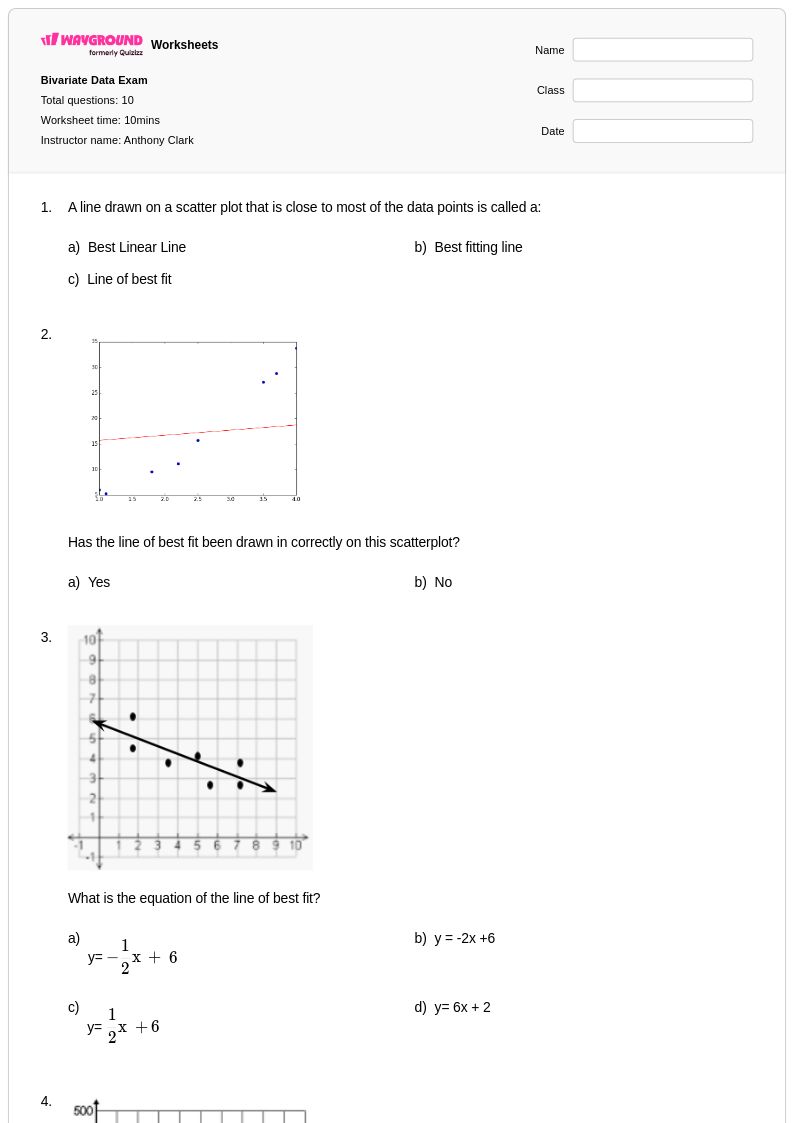
10 Hỏi
8th - Uni
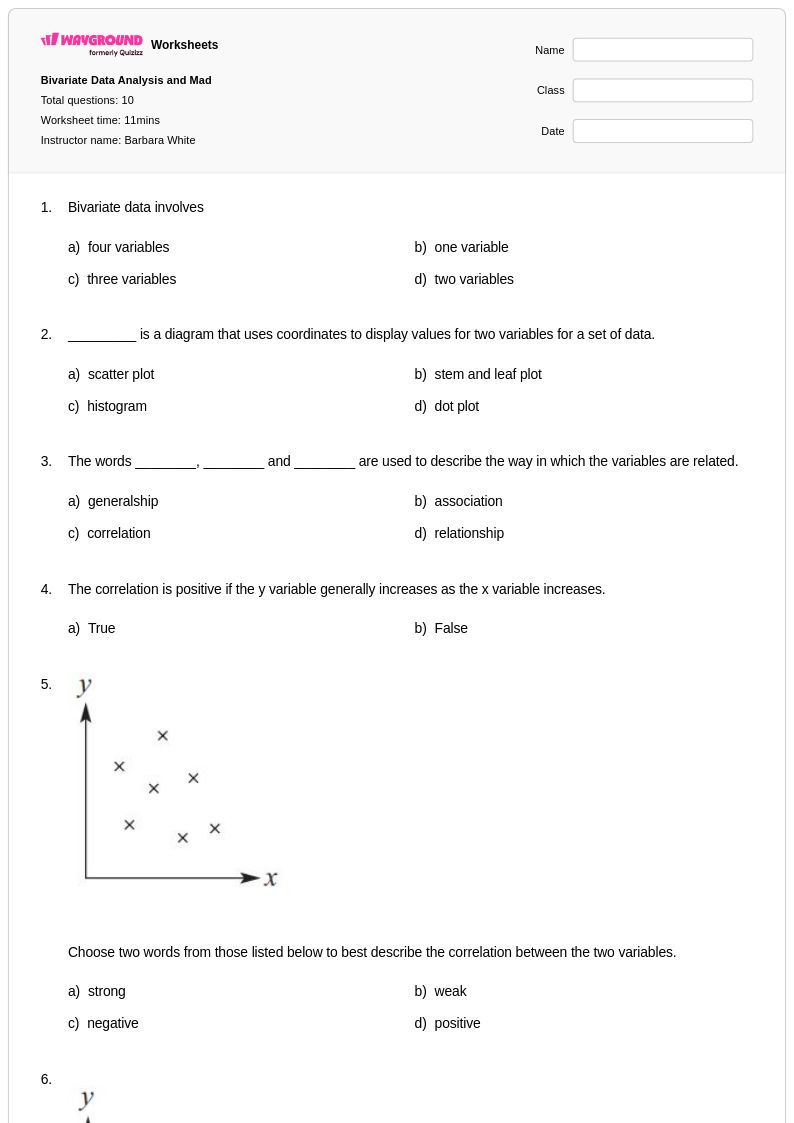
10 Hỏi
10th
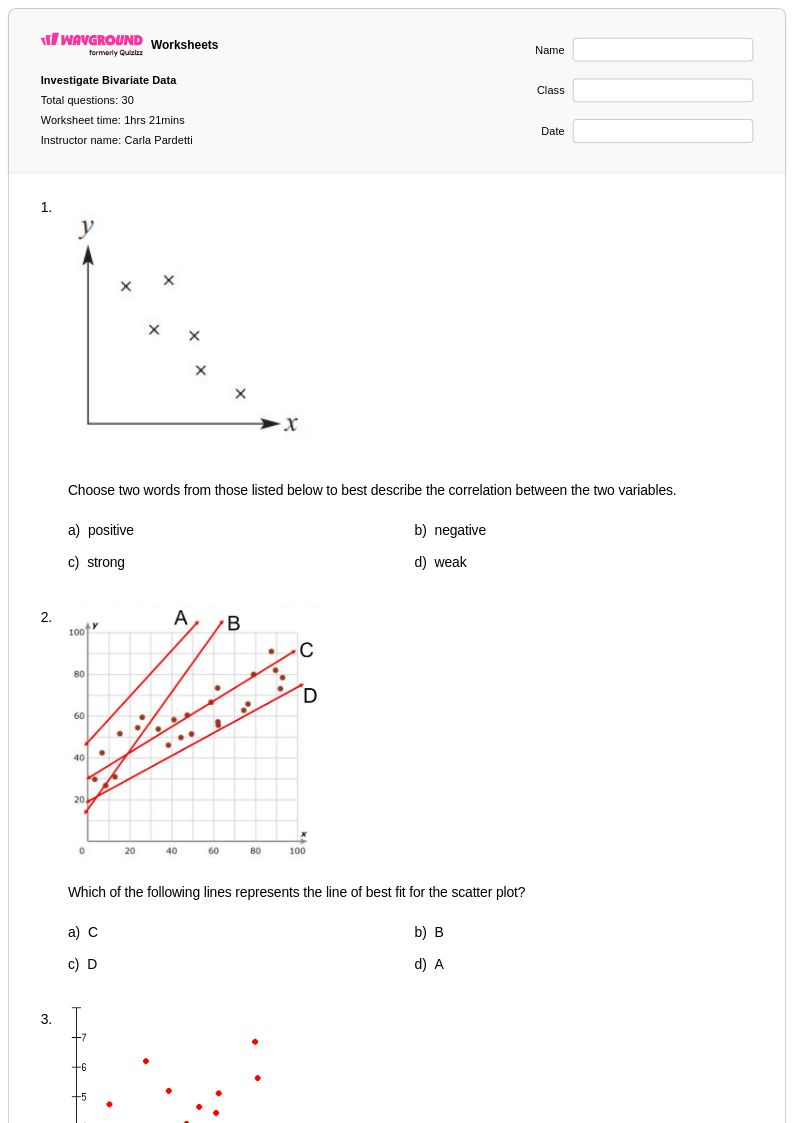
30 Hỏi
8th
Khám phá bảng tính theo chủ đề
Explore printable Bivariate Data worksheets
Bivariate data worksheets available through Wayground (formerly Quizizz) provide comprehensive practice opportunities for students to master the analysis of relationships between two quantitative variables. These expertly crafted resources strengthen essential statistical skills including scatter plot interpretation, correlation coefficient calculation, line of best fit determination, and residual analysis. The practice problems systematically guide learners through identifying patterns in paired data sets, distinguishing between strong and weak correlations, and understanding the difference between correlation and causation. Each worksheet collection includes detailed answer keys and is available as free printable pdf resources, enabling students to work independently while building confidence in their ability to analyze complex statistical relationships and draw meaningful conclusions from bivariate datasets.
Wayground (formerly Quizizz) empowers educators with millions of teacher-created bivariate data worksheet resources that seamlessly integrate into any statistics curriculum through robust search and filtering capabilities. The platform's standards-aligned materials support differentiated instruction by offering varying levels of complexity, from introductory scatter plot analysis to advanced regression techniques, all available in both printable and digital pdf formats. Teachers can customize existing worksheets or create original materials using the platform's flexible tools, making lesson planning more efficient while ensuring targeted skill practice for remediation and enrichment activities. The extensive collection enables educators to provide consistent practice with correlation analysis, trend identification, and data interpretation across diverse learning environments, supporting both individual student needs and whole-class statistical literacy development.
FAQs
How do I teach students to analyze bivariate data?
What exercises help students practice bivariate data analysis?
What mistakes do students commonly make with bivariate data?
How can I use a bivariate data worksheet from Wayground?
How does bivariate data fit into Common Core math?
How can I differentiate bivariate data practice?