
Tópicos recomendados para você
- Color Sorting
- Data Representation
- Data Tables
- Graphing Data
- Organizing Data
- Qualitative Data
- Reading Charts
- Reading Graphs
- Reading Tables
- Sorting by Size
- Tally Graphs
- Tally Marks
- Tape Diagrams
- Types of Graphs
- Venn Diagrams
- X and Y Axes
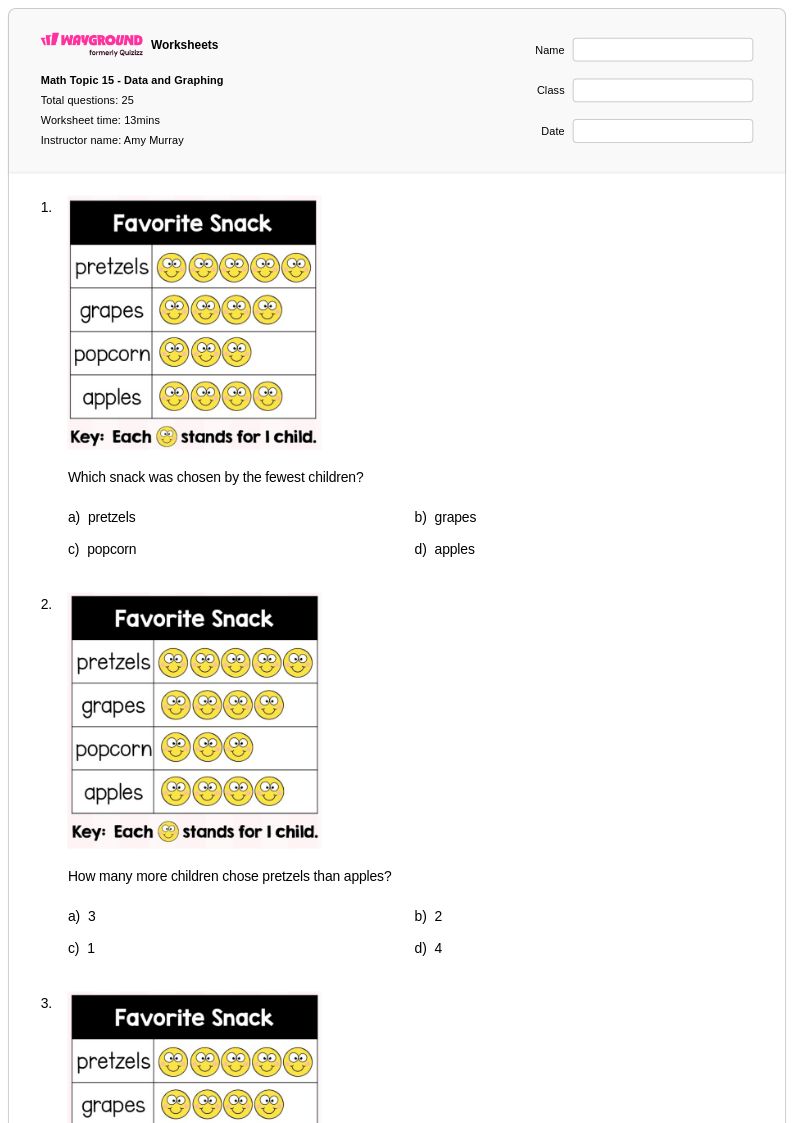
25Q
2nd
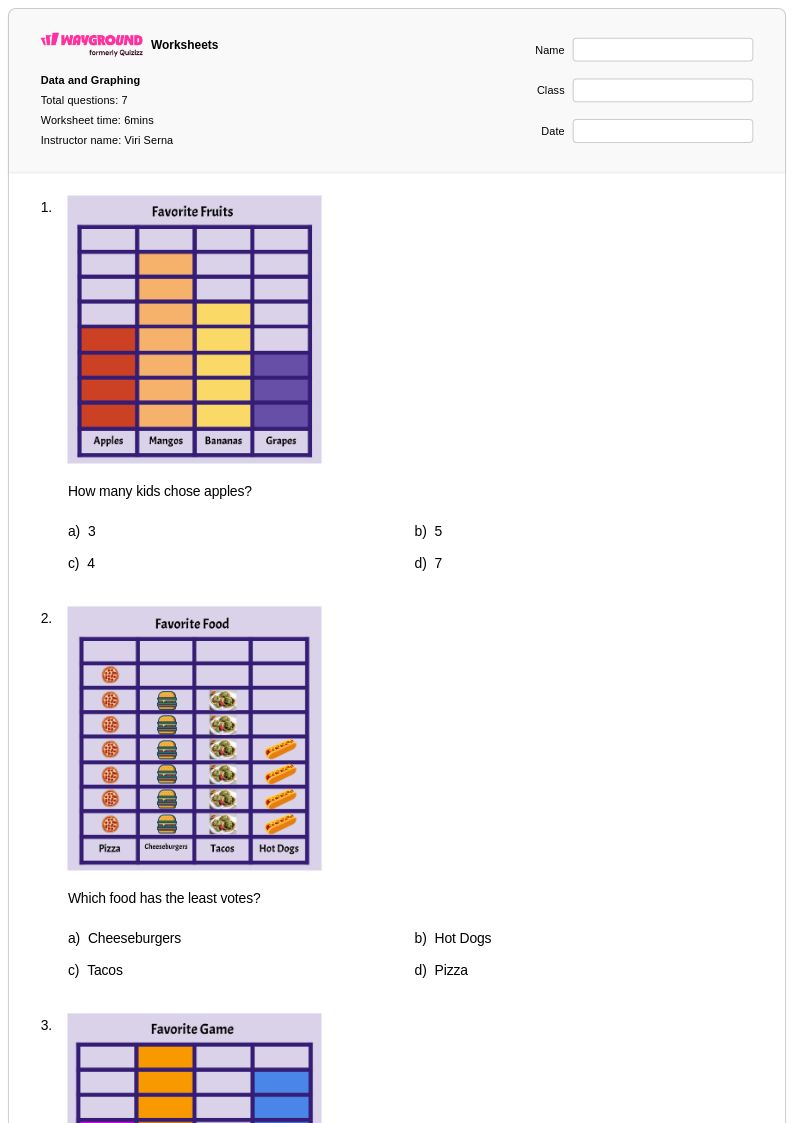
7Q
2nd
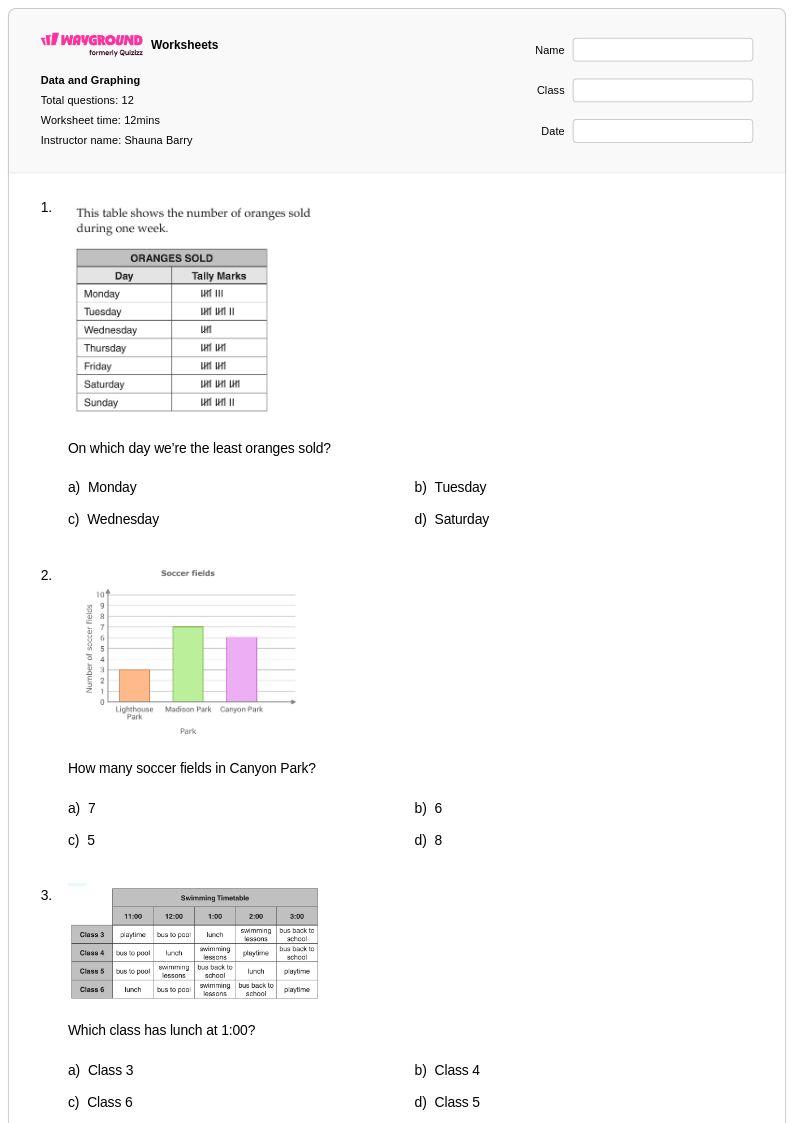
12Q
2nd - 4th
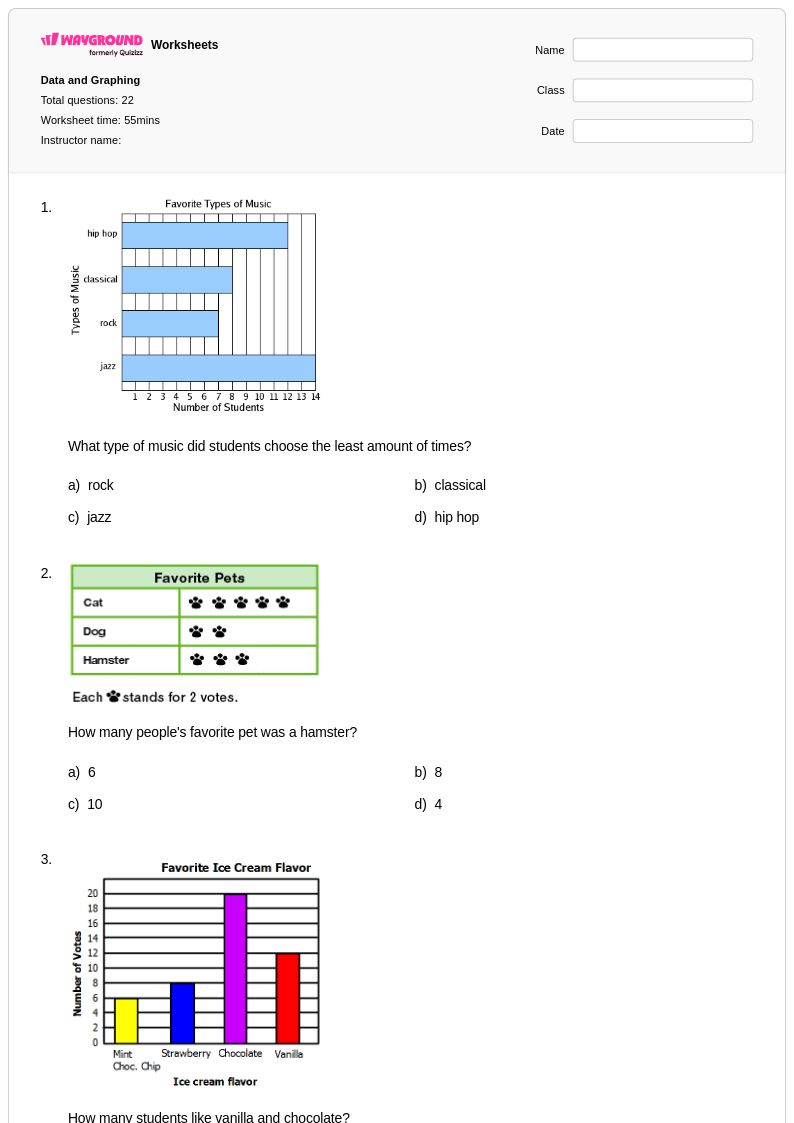
22Q
2nd - 4th
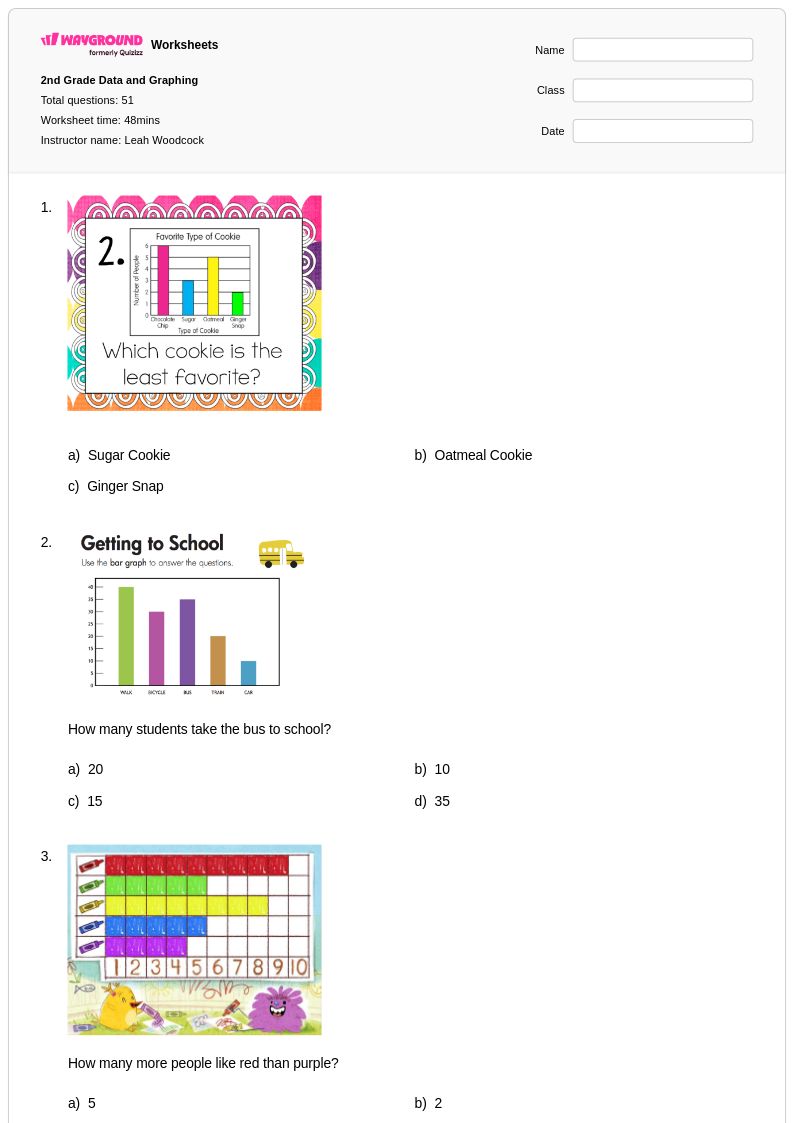
51Q
2nd
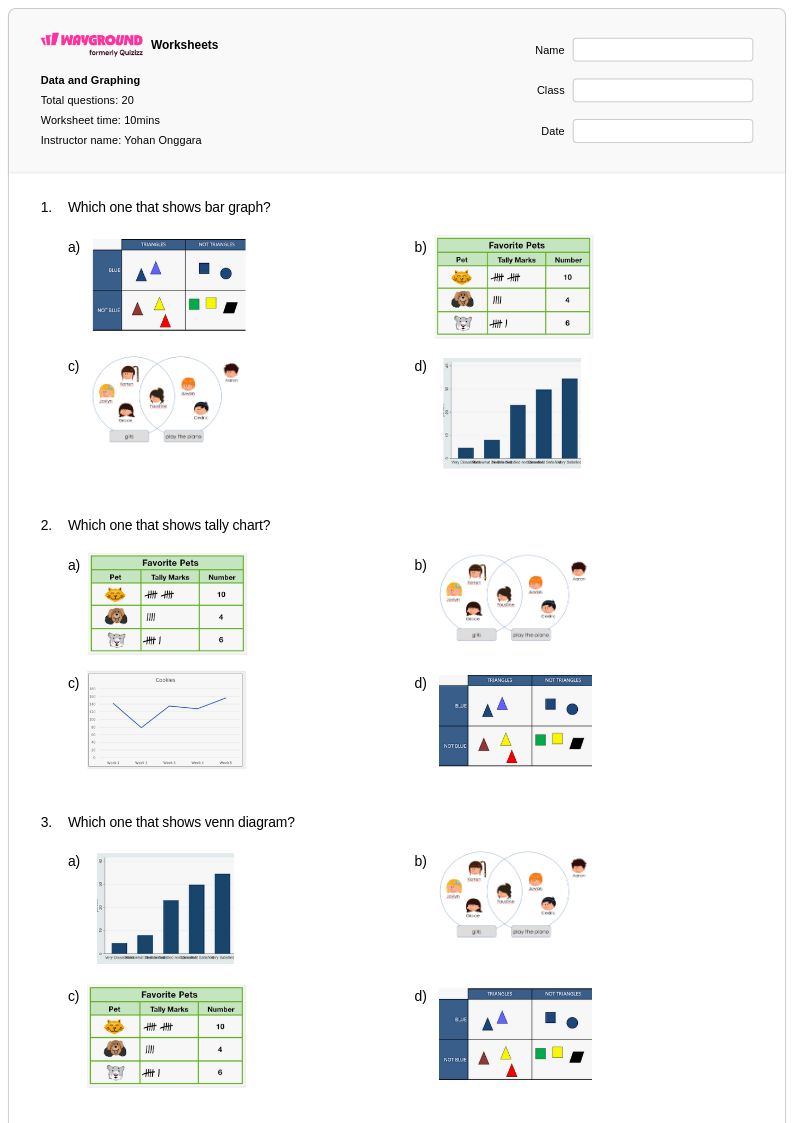
20Q
1st - 2nd
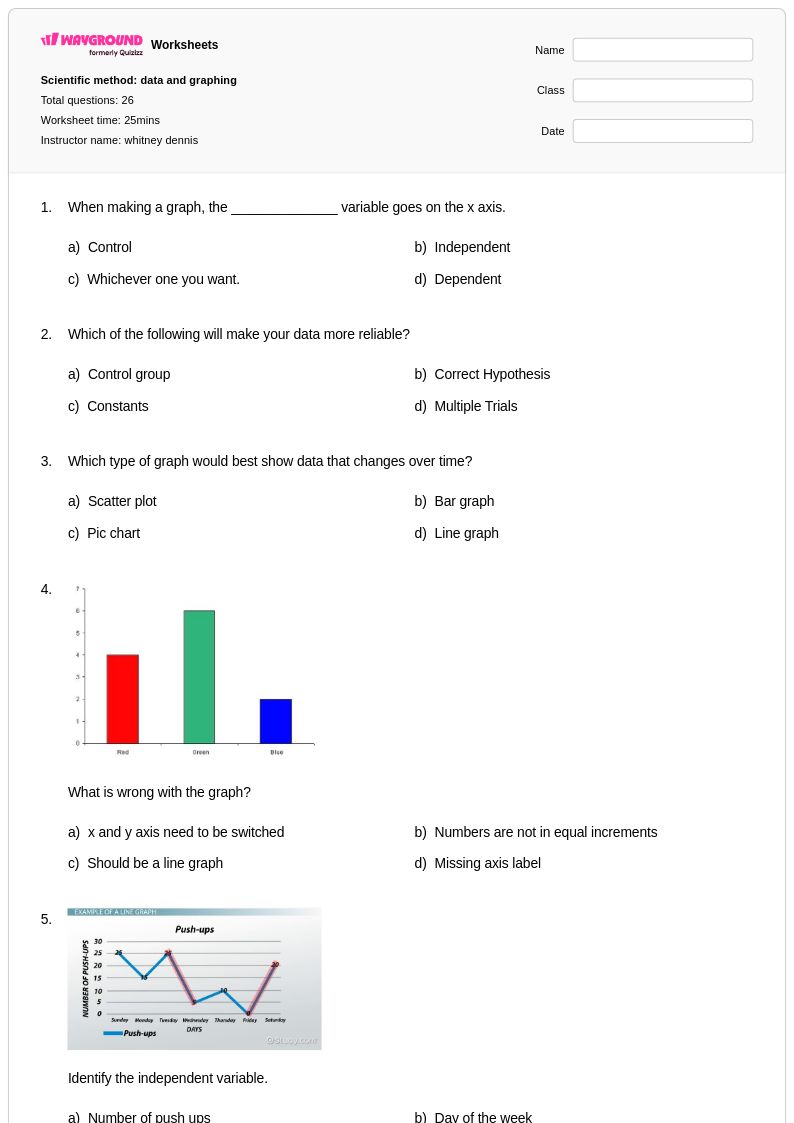
26Q
2nd - 9th
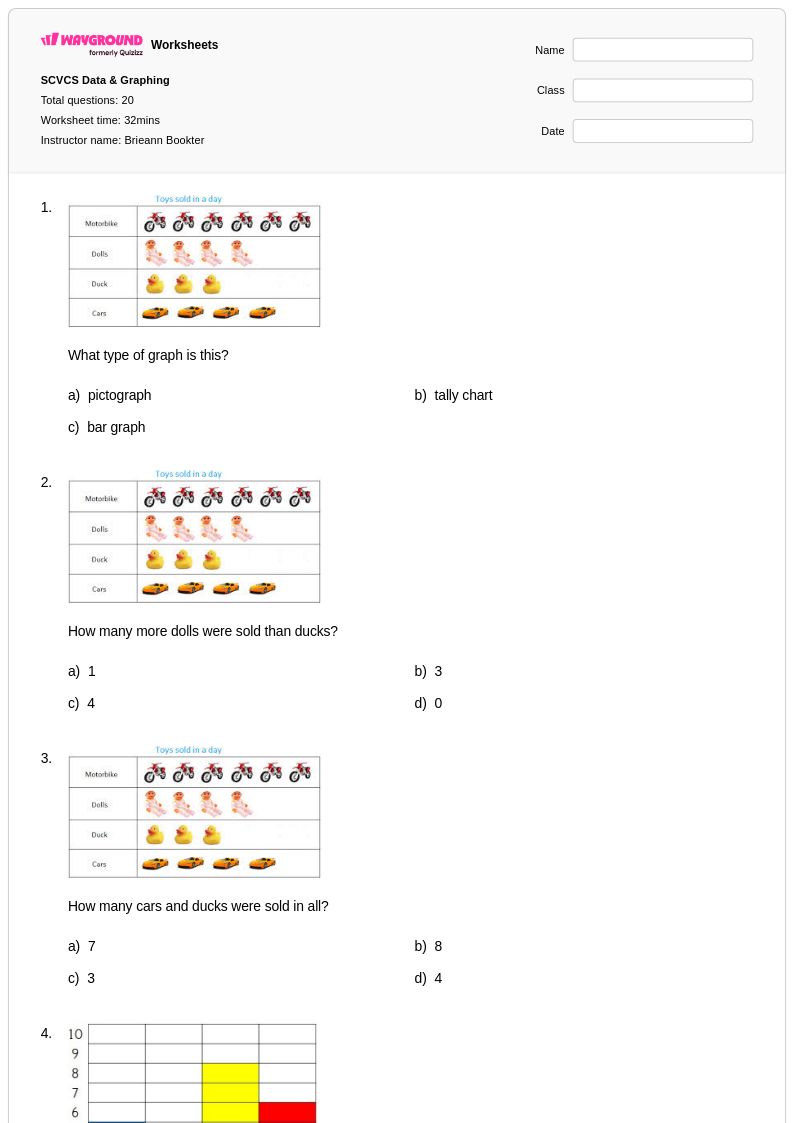
20Q
2nd
15Q
2nd
10Q
2nd
30Q
2nd - 3rd
11Q
2nd - 5th
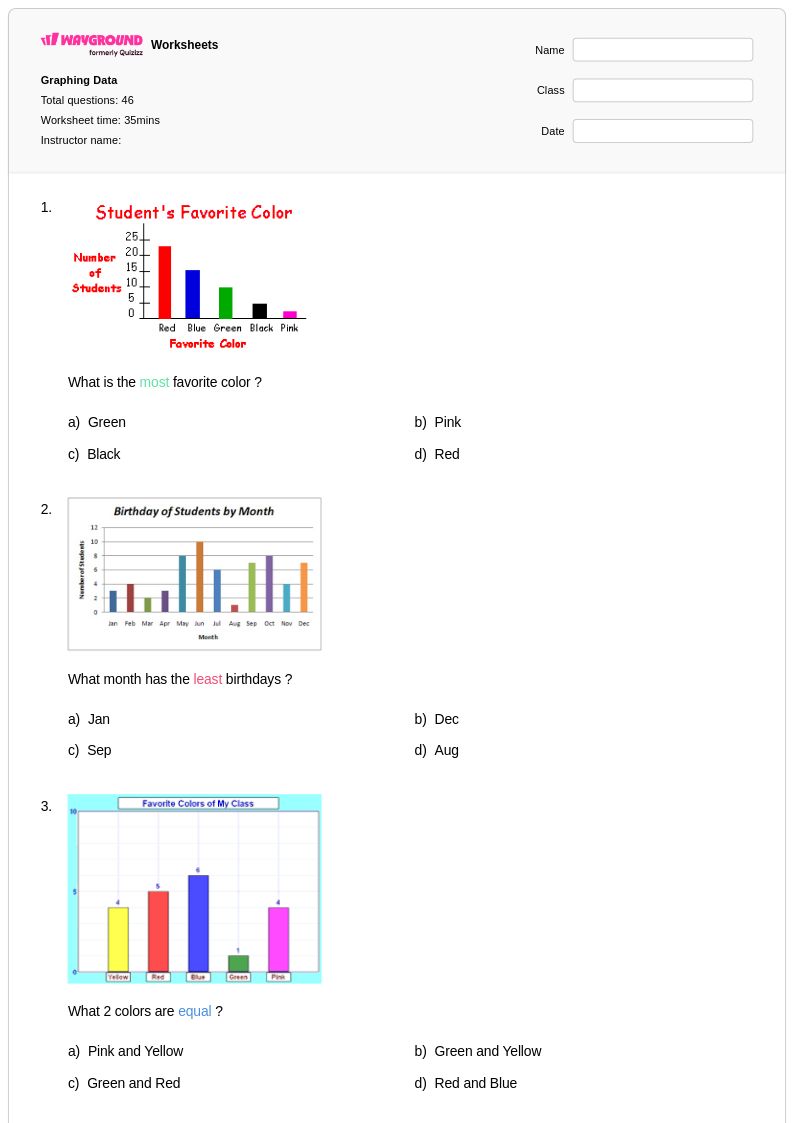
46Q
2nd
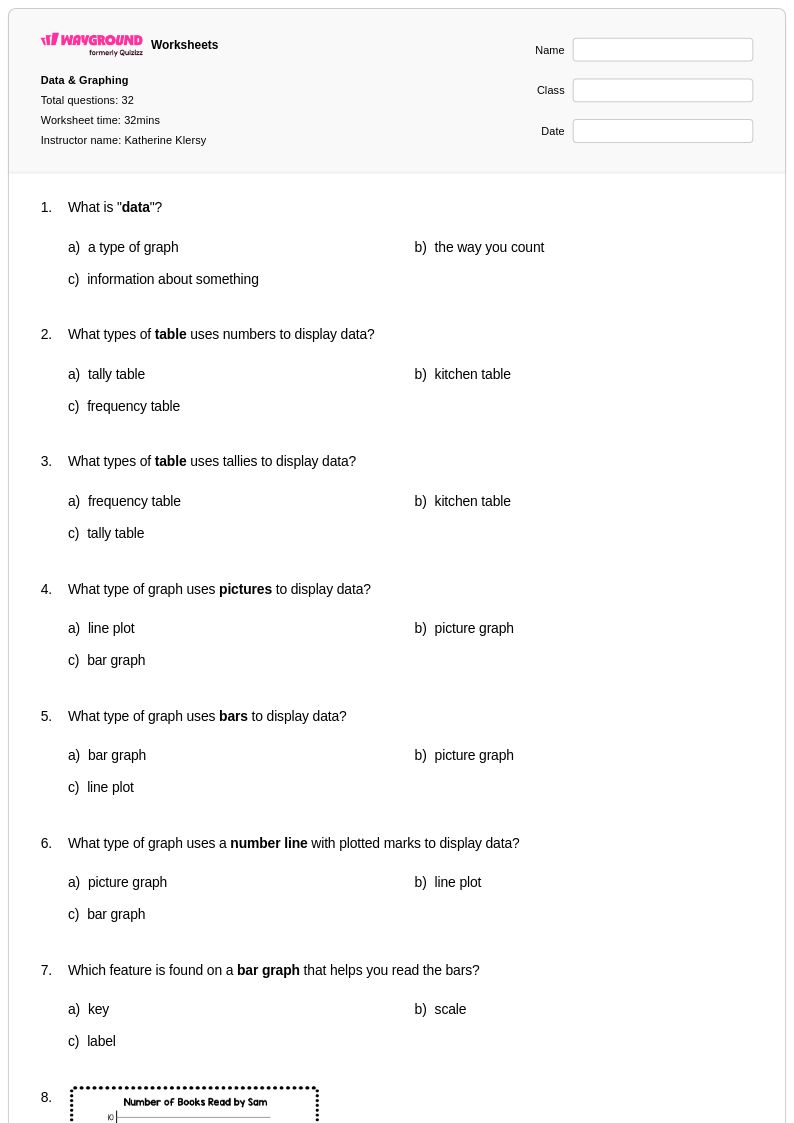
32Q
2nd - 3rd
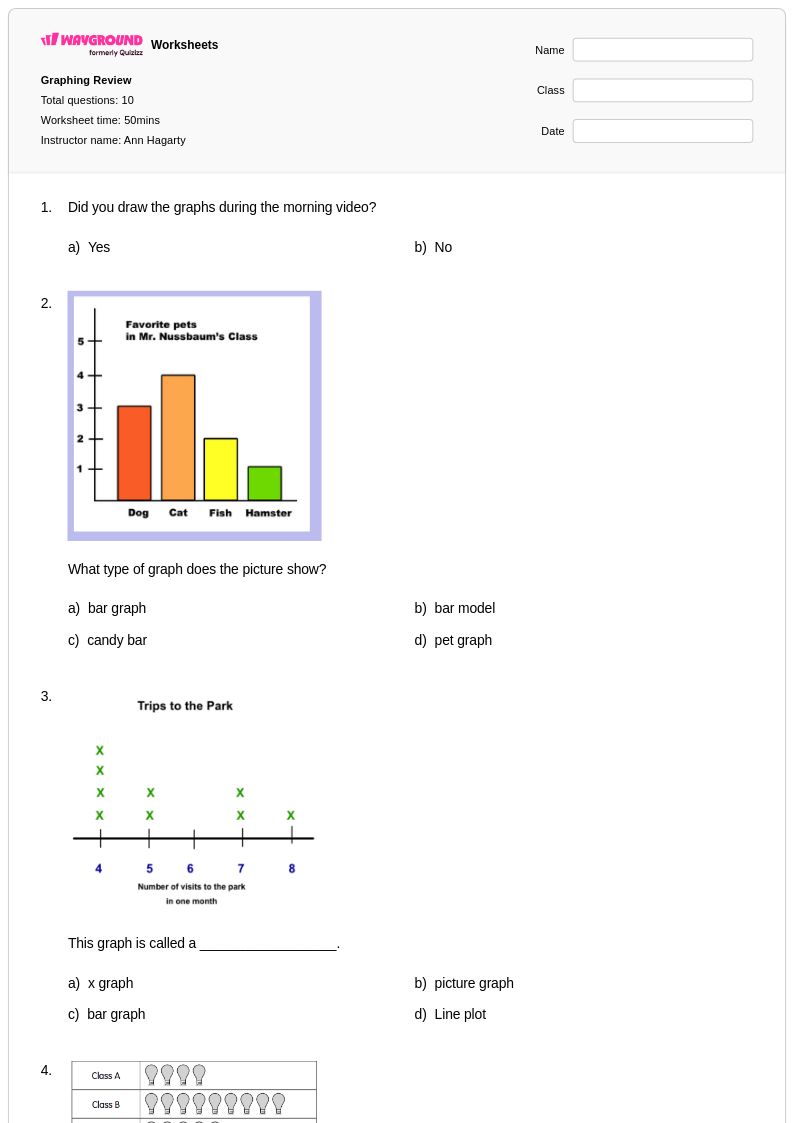
10Q
2nd - 3rd
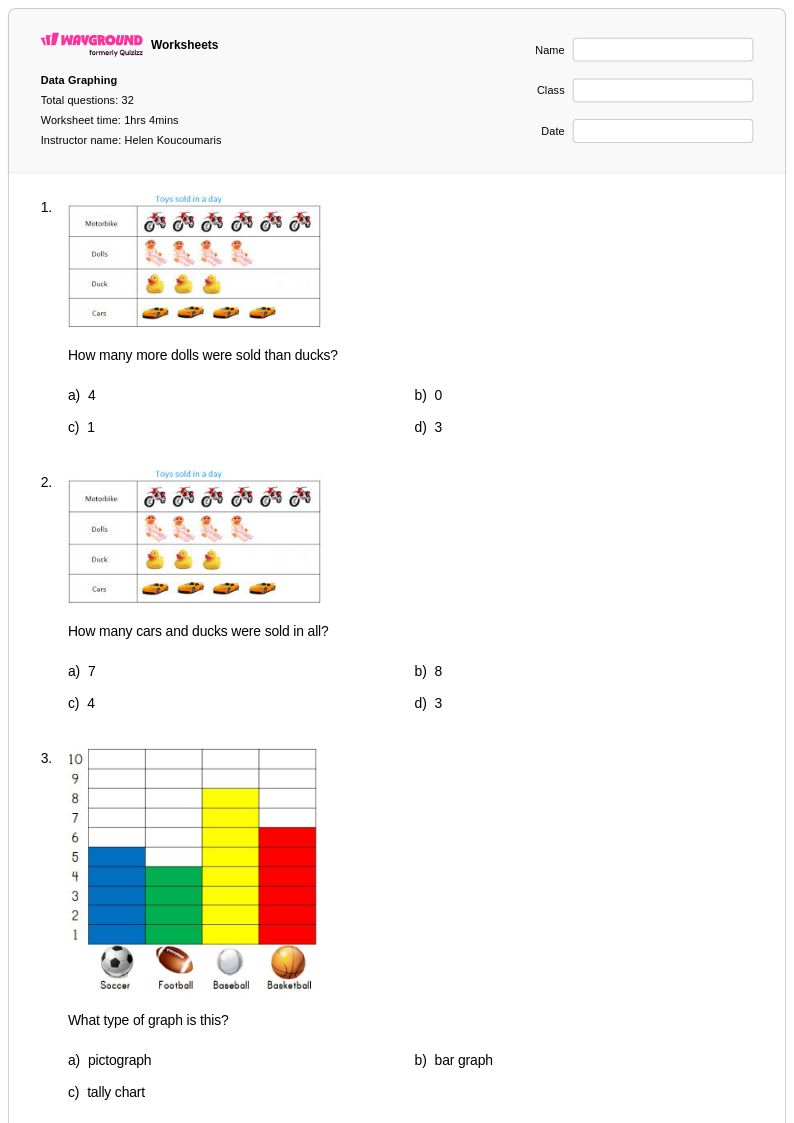
32Q
2nd
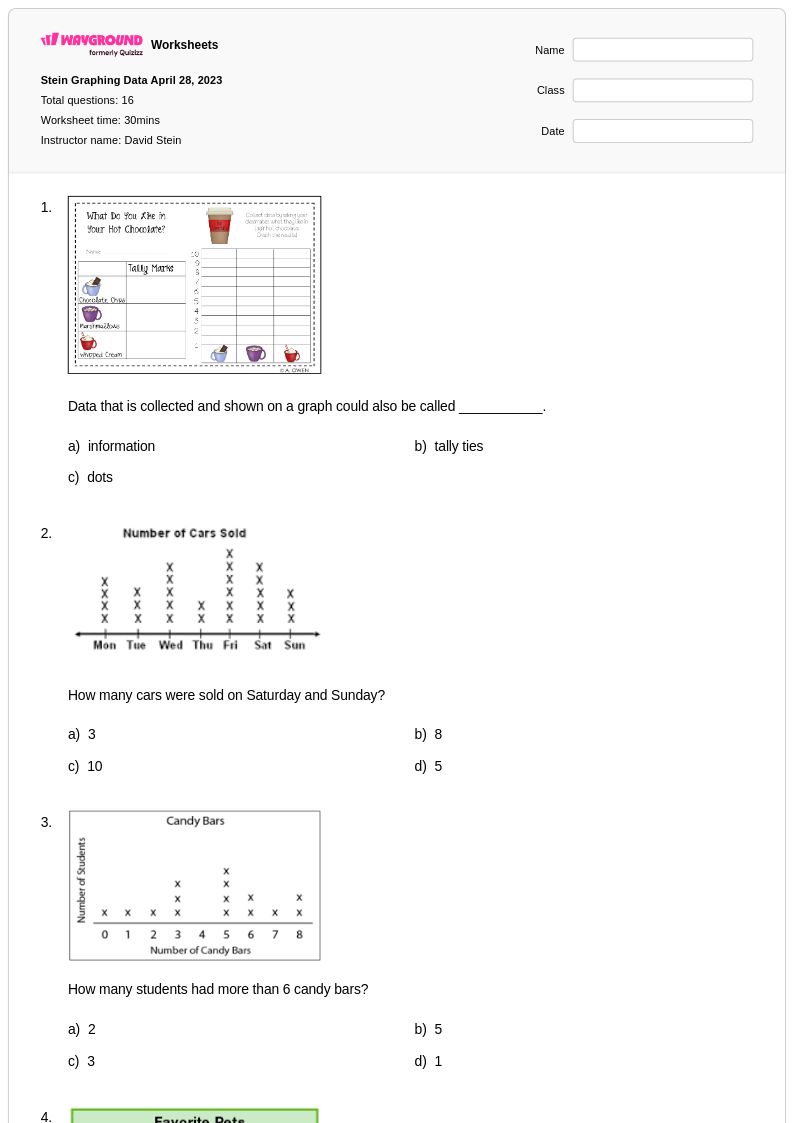
16Q
2nd
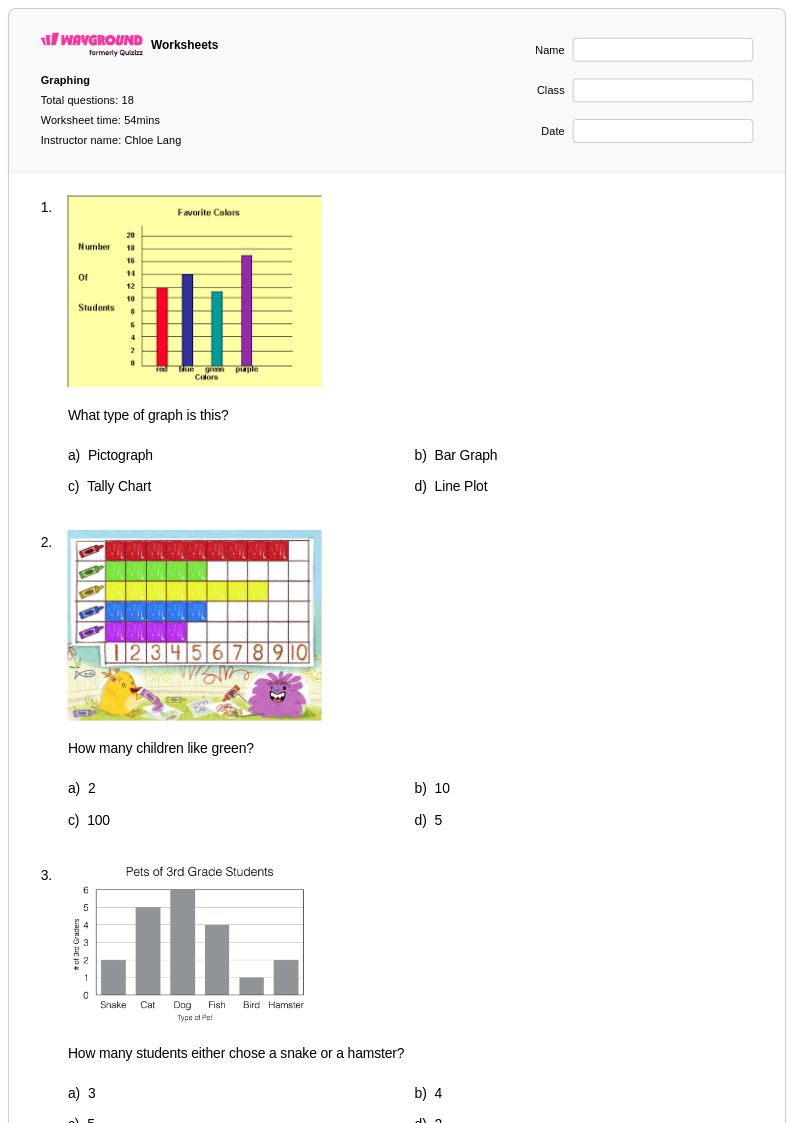
18Q
2nd - 4th
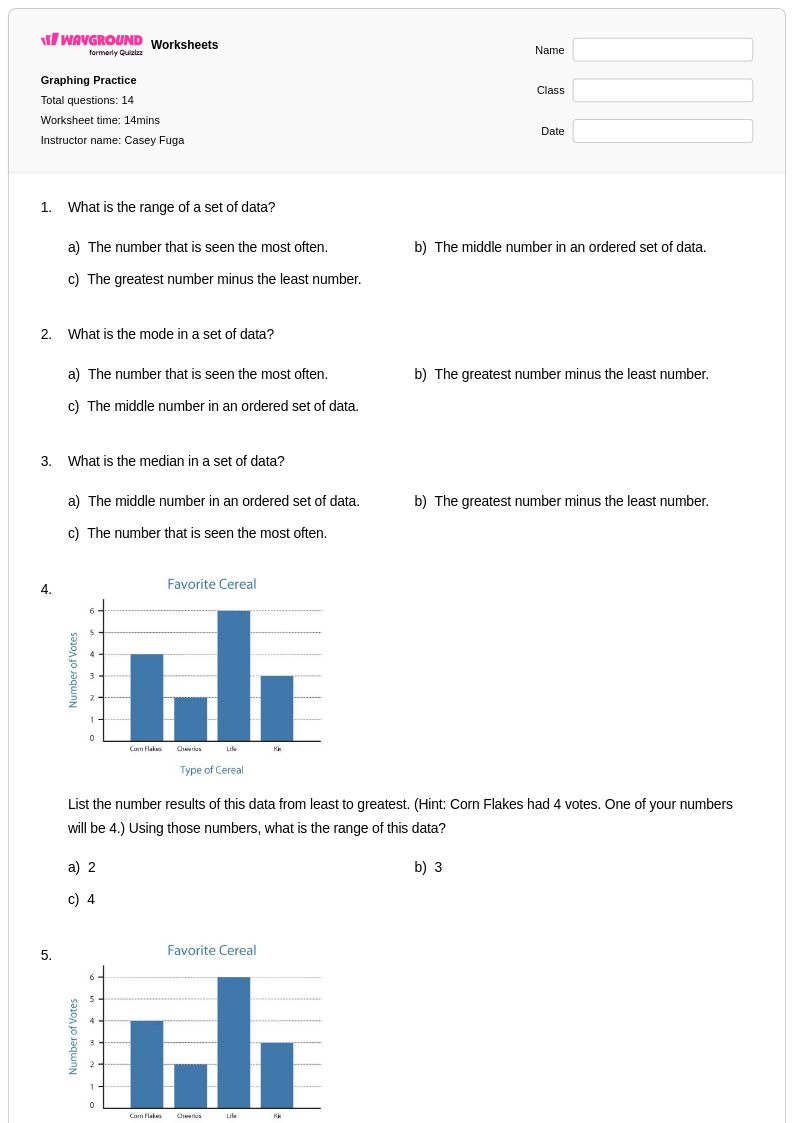
14Q
2nd
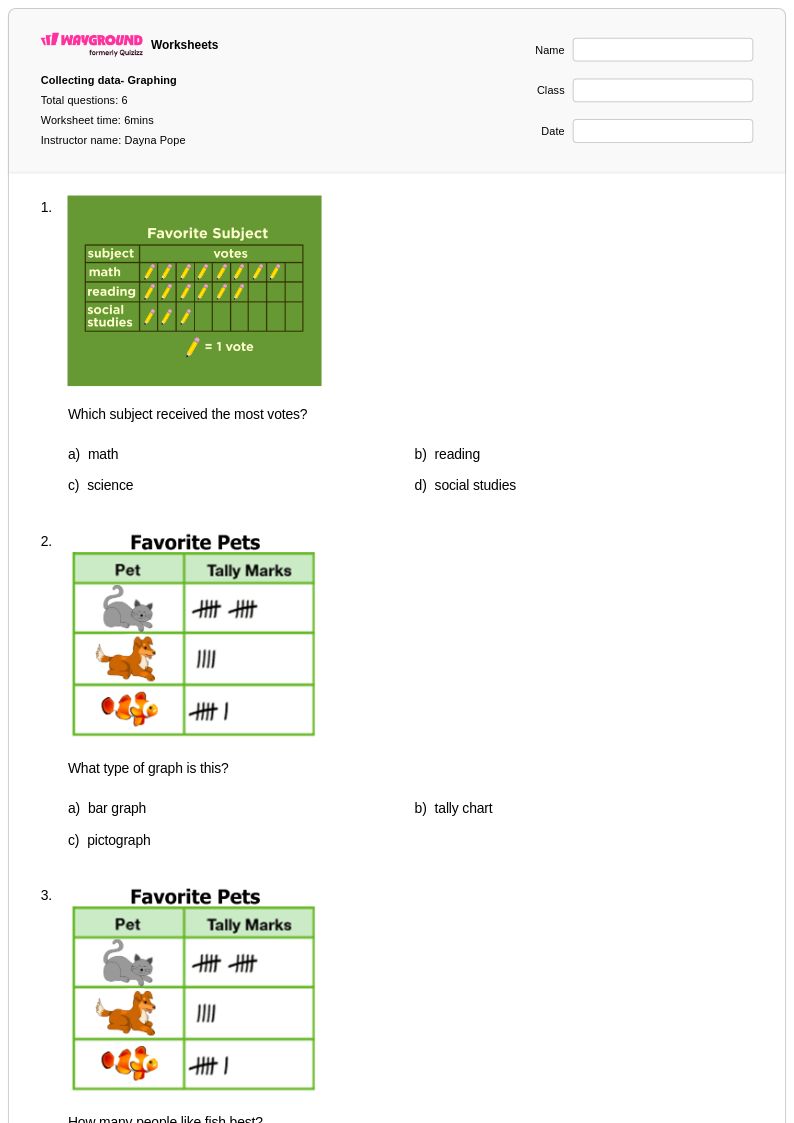
6Q
2nd - 3rd
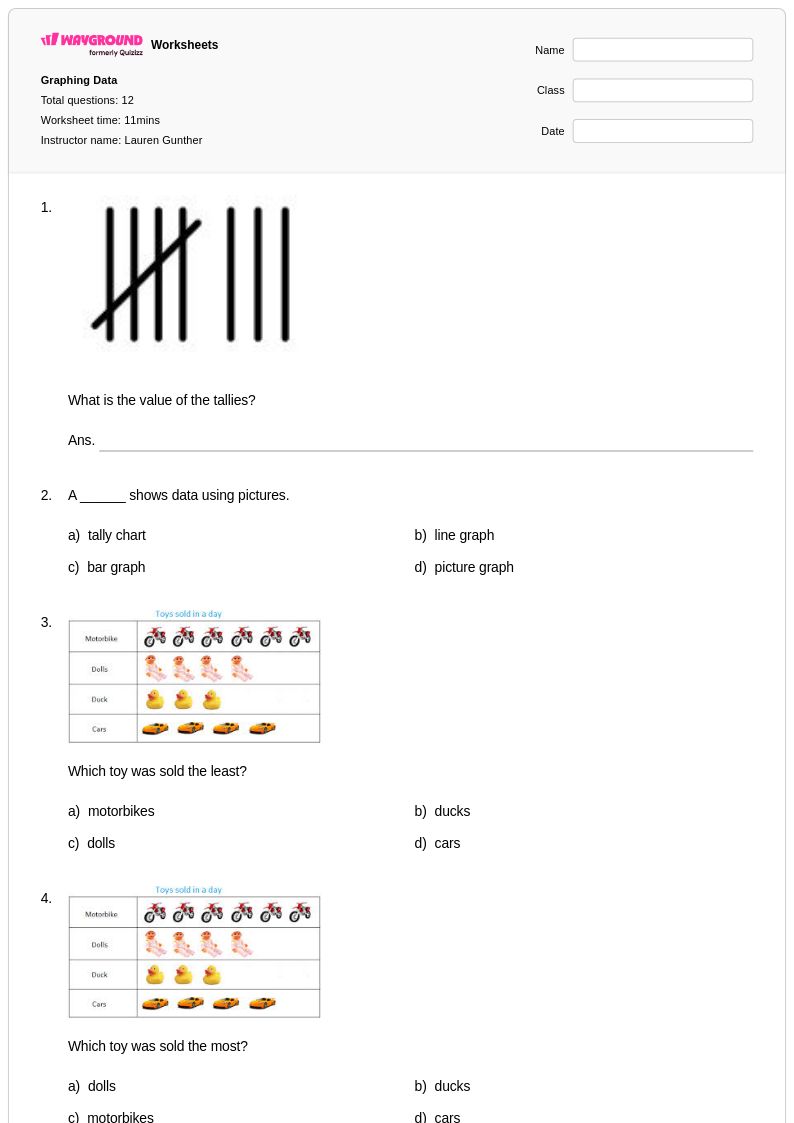
12Q
KG - 2nd
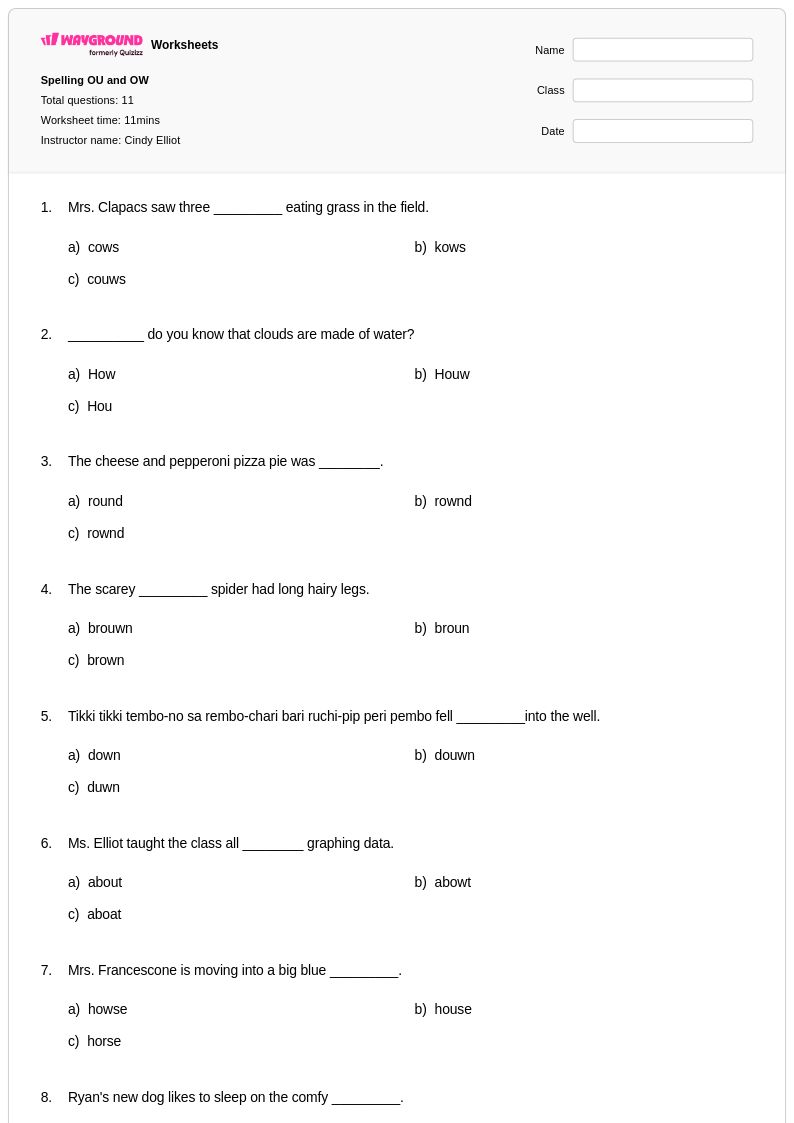
11Q
2nd
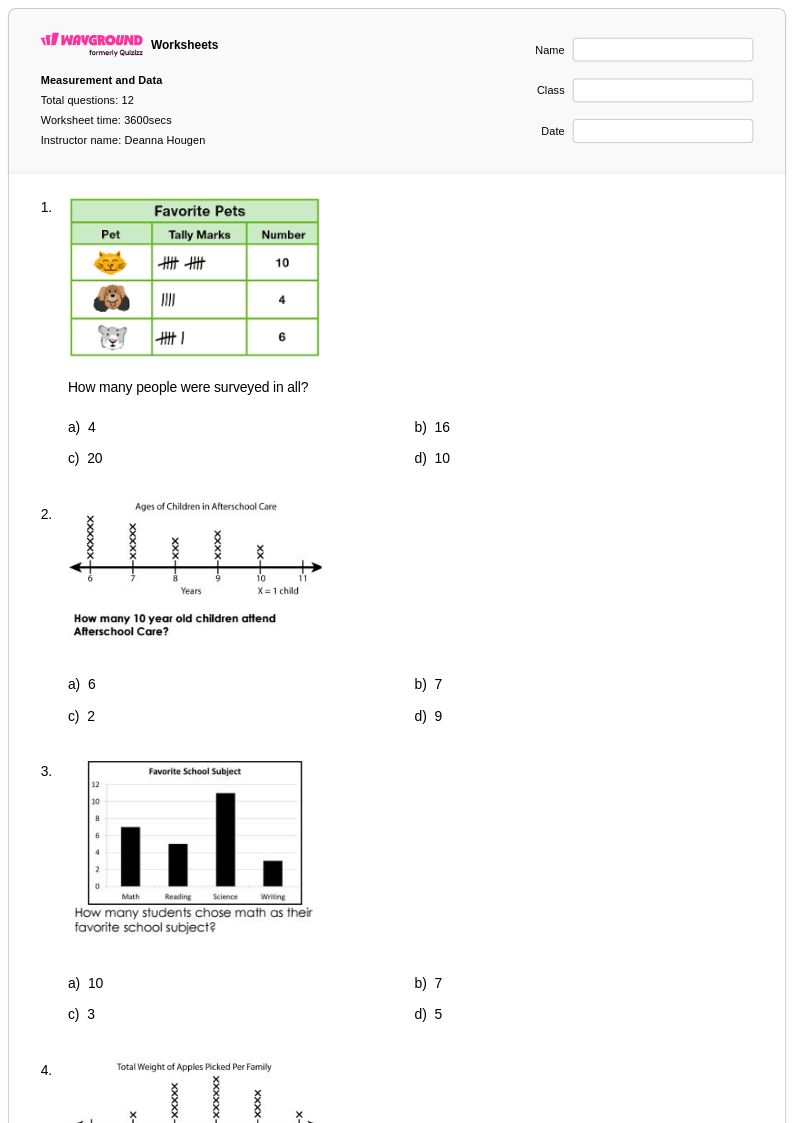
12Q
2nd
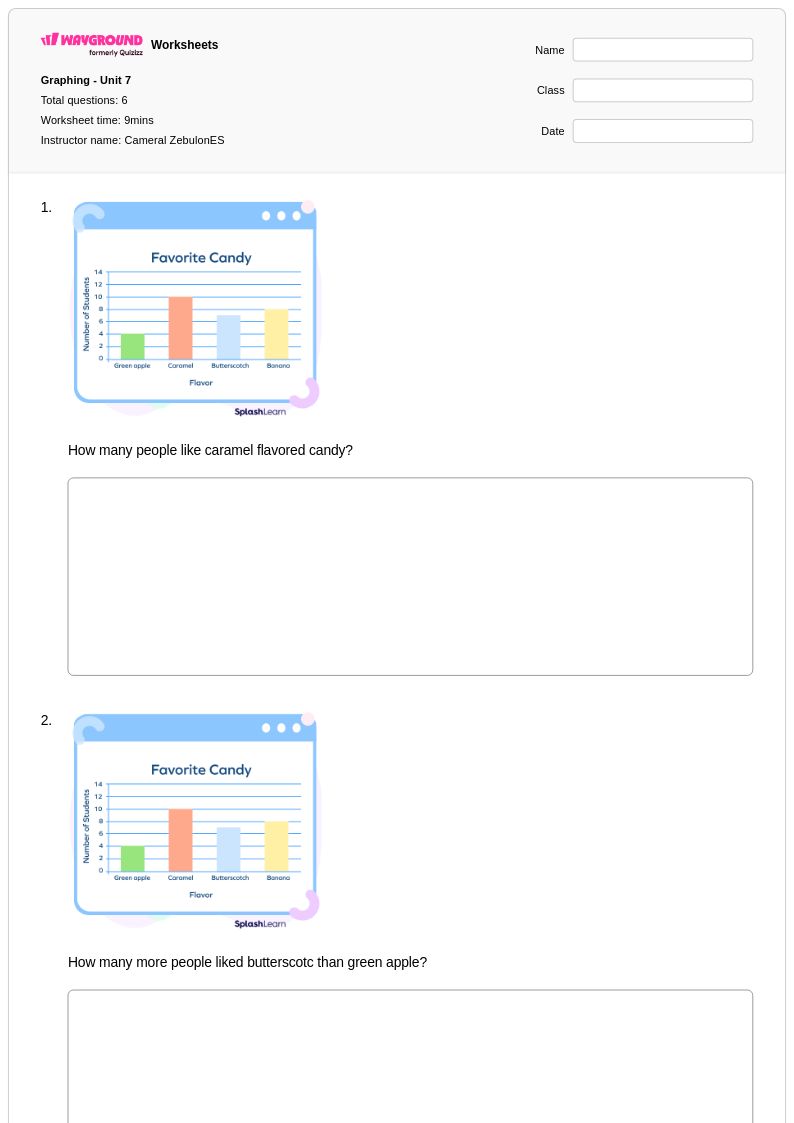
6Q
2nd
Explore planilhas Data and Graphing por notas
Explore planilhas Data and Graphing para grade 2 por tópico
Explore outras planilhas de assuntos para grade 2
Explore printable Data and Graphing worksheets for Grade 2
Data and graphing worksheets for Grade 2 students available through Wayground (formerly Quizizz) provide essential foundation-building practice in organizing, interpreting, and representing information visually. These comprehensive resources strengthen critical mathematical thinking skills by guiding young learners through hands-on experiences with collecting data, creating simple charts and graphs, and drawing conclusions from visual representations. The worksheets feature age-appropriate scenarios such as counting favorite pets, tracking weather patterns, or organizing classroom survey results, making abstract concepts tangible and engaging. Each printable resource includes structured practice problems that progressively build complexity, from basic sorting and counting activities to creating pictographs and bar graphs, with accompanying answer keys that support both independent learning and guided instruction in pdf format.
Wayground (formerly Quizizz) empowers educators with an extensive collection of teacher-created data and graphing resources specifically designed for Grade 2 mathematics instruction. The platform's millions of worksheets offer robust search and filtering capabilities that align with curriculum standards, enabling teachers to quickly locate materials that match specific learning objectives and skill levels. Advanced differentiation tools allow instructors to customize content difficulty and presentation style to meet diverse student needs, while flexible formatting options provide both digital and printable versions for seamless classroom integration. These comprehensive features streamline lesson planning and assessment preparation, supporting targeted remediation for struggling learners and enrichment opportunities for advanced students, ensuring every second-grade student develops strong foundational skills in data analysis and graphical representation.
FAQs
How do I teach data and graphing to second graders?
What exercises help second graders practice data and graphing?
What mistakes do second graders commonly make with pictographs and bar graphs?
How can I use Wayground Grade 2 data and graphing worksheets?
How does Grade 2 data and graphing align with Common Core math?
How can I differentiate Grade 2 data and graphing practice?