
18 Q
12th
15 Q
12th
11 Q
9th - 12th
10 Q
9th - 12th
9 Q
9th - 12th
12 Q
9th - 12th
15 Q
9th - 12th
25 Q
12th
32 Q
12th
16 Q
5th - Uni
20 Q
7th - Uni
14 Q
9th - 12th
20 Q
7th - Uni
20 Q
9th - Uni
18 Q
9th - 12th
14 Q
12th
15 Q
9th - 12th
20 Q
12th
10 Q
9th - 12th
15 Q
11th - 12th
25 Q
9th - 12th
11 Q
9th - 12th
12 Q
8th - Uni
15 Q
12th - Uni
Explore Data Visualization Worksheets by Grades
Explore Other Subject Worksheets for grade 12
Explore printable Data Visualization worksheets for Grade 12
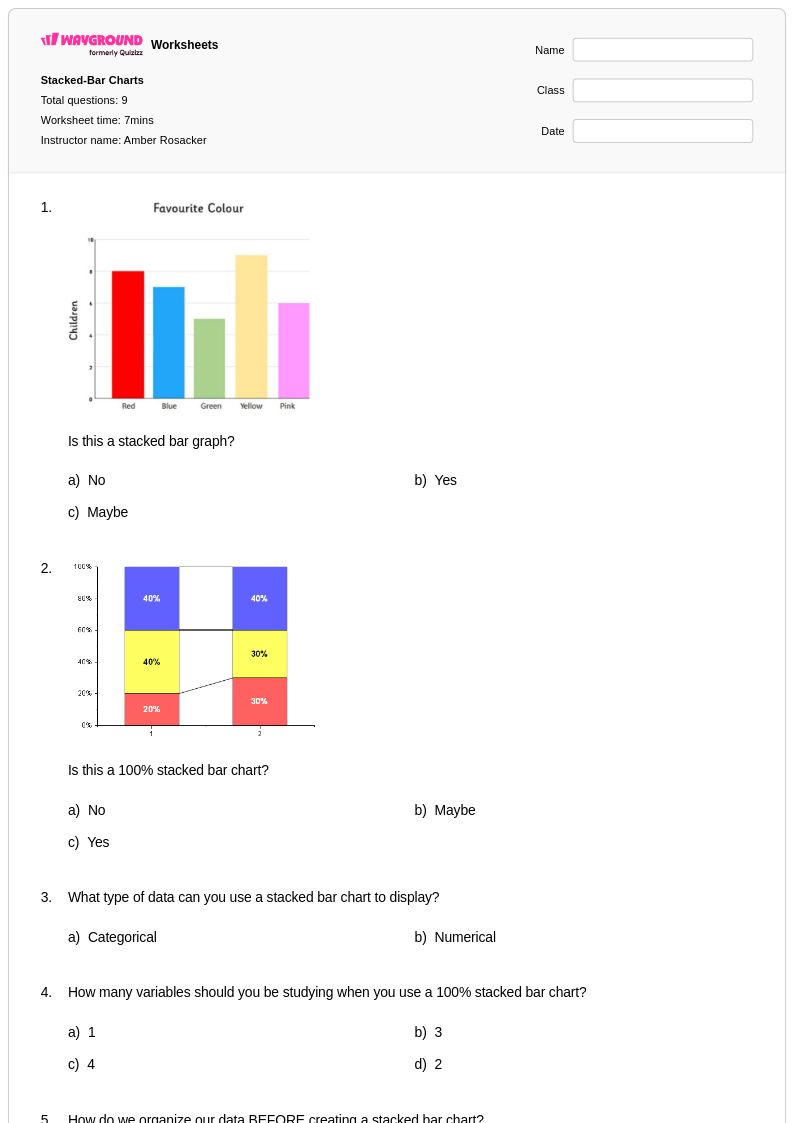
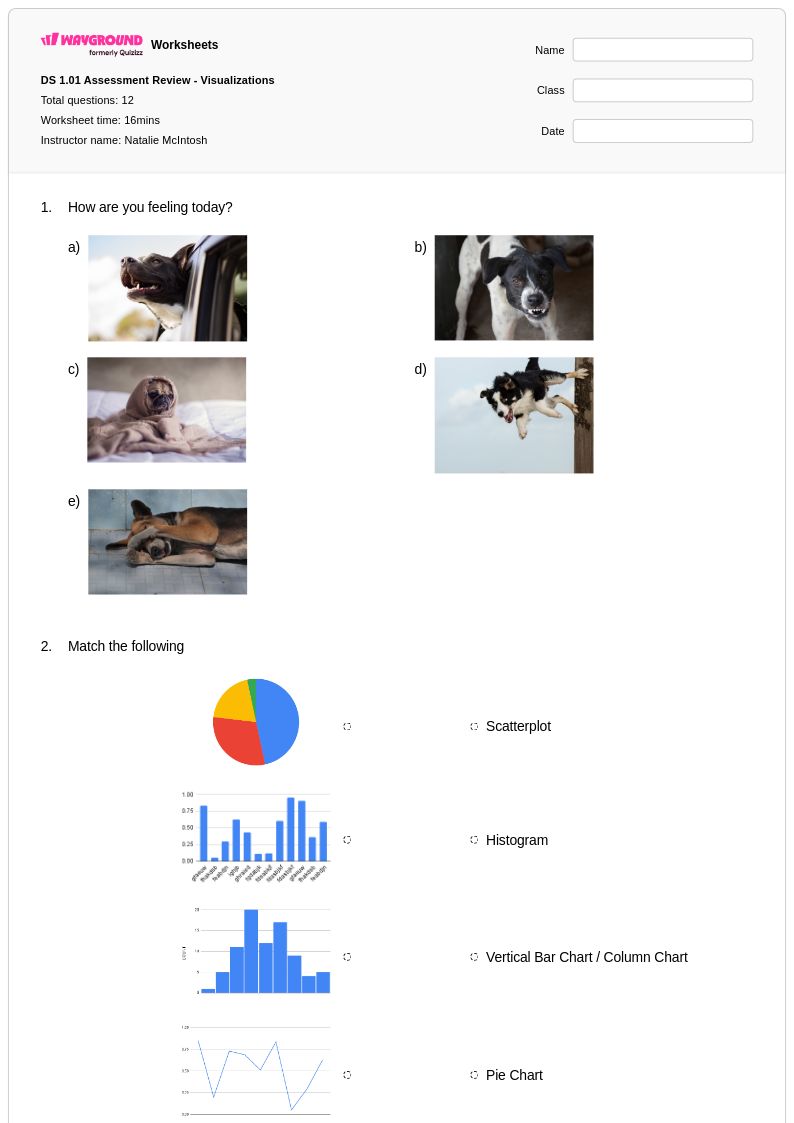
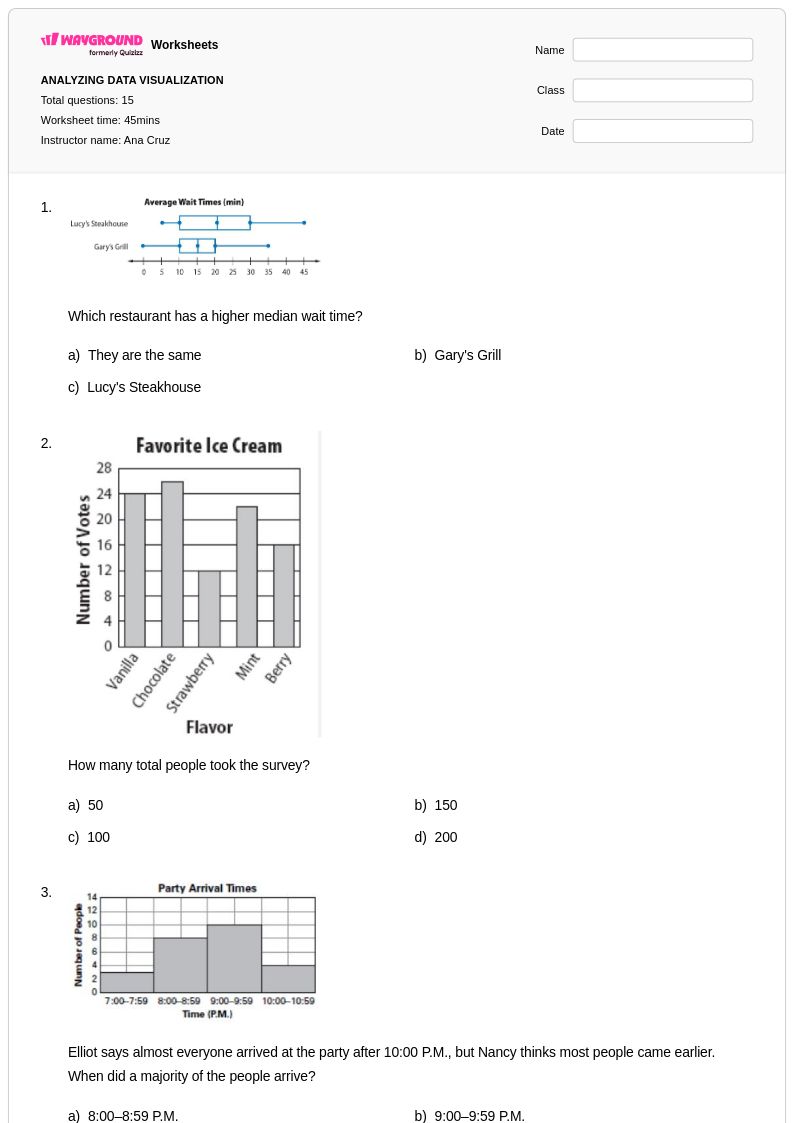
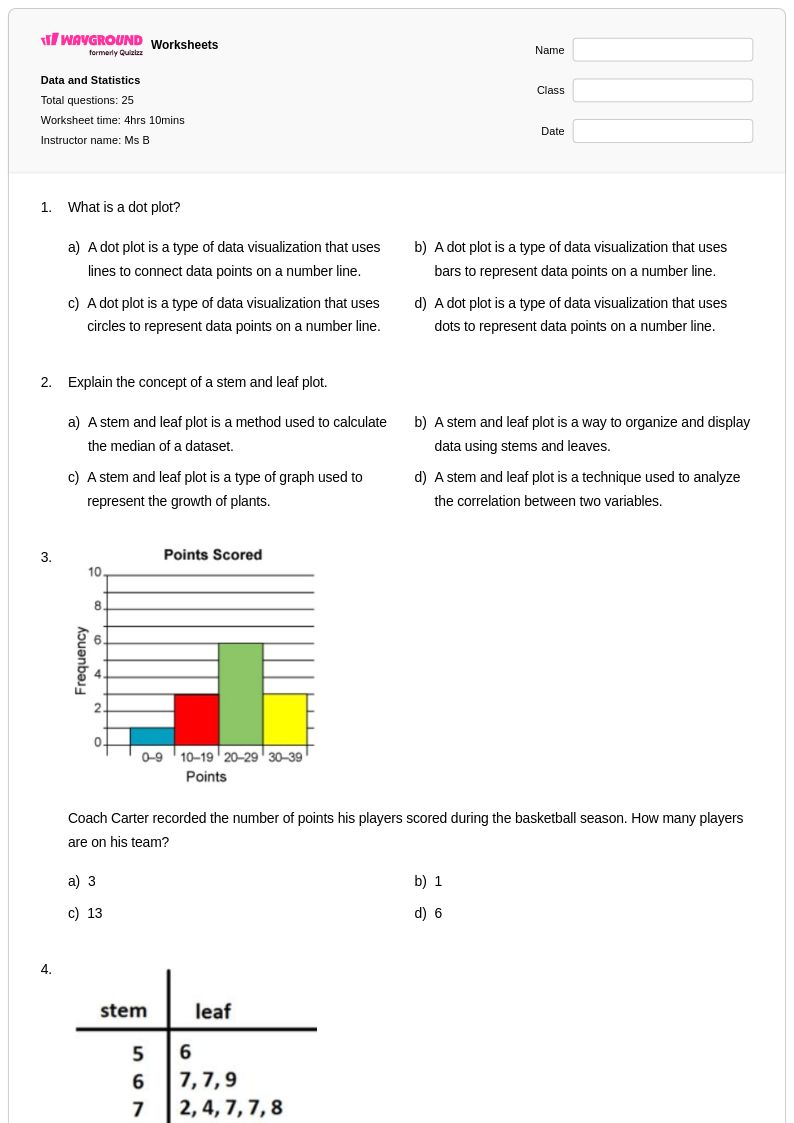
Data visualization worksheets for Grade 12 students through Wayground (formerly Quizizz) provide comprehensive practice in creating, interpreting, and analyzing various graphical representations of statistical data. These expertly crafted resources strengthen essential skills including constructing histograms, box plots, scatter plots, and other advanced visual displays while developing proficiency in selecting appropriate graph types for different data sets and research questions. Students engage with practice problems that require them to extract meaningful insights from complex visualizations, calculate statistical measures from graphical data, and critically evaluate the effectiveness of different display methods. Each worksheet includes a detailed answer key to support independent learning, and teachers can access these materials as free printables in convenient pdf format for seamless classroom integration.
Wayground (formerly Quizizz) empowers educators with millions of teacher-created data visualization resources that feature robust search and filtering capabilities aligned to state and national mathematics standards. The platform's differentiation tools allow teachers to customize worksheet difficulty levels and content focus areas, ensuring appropriate challenge levels for diverse learners while maintaining rigorous Grade 12 expectations. These flexible resources are available in both printable and digital formats, including downloadable pdf versions, making them ideal for varied instructional settings and learning preferences. Teachers utilize these comprehensive worksheet collections for targeted skill practice, remediation of foundational graphing concepts, enrichment activities for advanced students, and efficient lesson planning that addresses the sophisticated analytical thinking required in advanced probability and statistics coursework.